Just Waves MT5

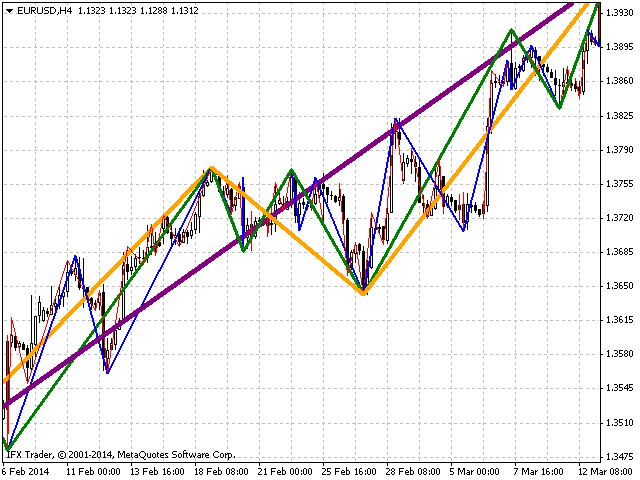
Among various methods of technical analysis of the Forex market, wave analysis is a fundamental one. Anyway, when it comes to the price change over a period of time, we are dealing with waves. According to Elliott's theory, waves are formed in a fractal way. On the same principle MT5 indicator Just Waves marks up waves of different levels (up to 8) and creates graphic lines indicating the beginning and ending points of the waves.

Just Waves offers an objective criterion of a wave, thereby uncovering tremendous opportunities not only for traders but also for programmers, developers of trading systems and analysis. It was created in order to help people to get rid of routine actions and focus attention to the decision-making process.
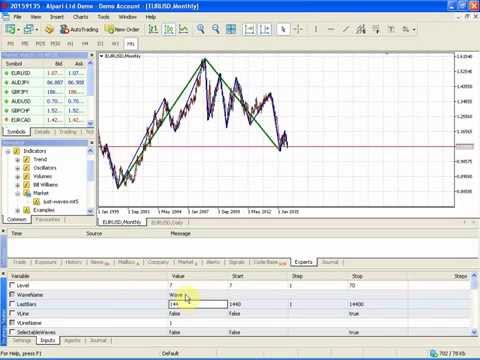

Settings

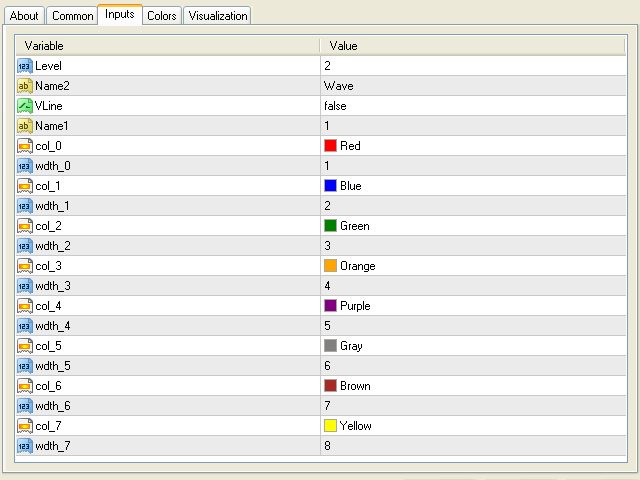
  • Level - number of wave levels (0-7)
  • FixedTimeframe: - true: waves are drawn based on a fixed timeframe 
                               - false: waves are drawn based on the current timeframe
  • TF - selection of a fixed timeframe 
  • DeledeWaves: - false: waves are not removed from the chart after deinitialization
                           - true: waves are removed from the chart after deinitialization
  • WaveName - major name of a single wave (default is "Wave")
  • LastBars - number of last bars for calculation. If 0 or VLine is true, the parameter is ignored
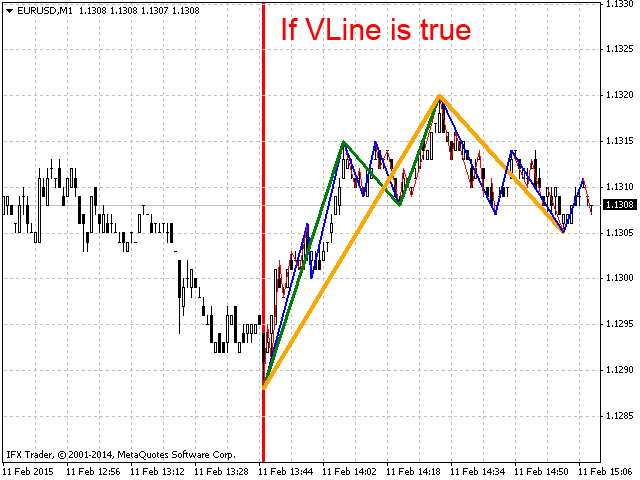
  • VLine - if true, the indicator starts working from the bar, which has a vertical line
  • VLineName - name of the vertical line (default "1")
  • TesterStart - time, at which the indicator builds a vertical line in a strategy tester if VLine is true
  • SelectableWaves - opportunity to control the selection by clicking waves 
  • WavesOnBackground - opportunity to draw waves in the background
  • You can also set the color and width of the wave lines


Produits recommandés
RBreaker
Zhong Long Wu
RBreaker Gold Indicators est une stratégie de trading intraday à court terme pour les contrats à terme sur l'or, qui combine deux approches : le suivi de tendance et le retournement intraday. Elle permet non seulement de capturer les profits dans les marchés en tendance, mais aussi de prendre des bénéfices en temps opportun lors des retournements de marché et d'ouvrir une position en sens inverse. Cette stratégie a été classée pendant 15 années consécutives parmi les dix stratégies de trading l
TRI Visualizer
Yoshimi Mon 三 Ura
TRI Visualizer MT5 – Thermodynamic Market Analysis Overview The TRI (Thermal Range Indicator) Visualizer Enhanced is a rare market analysis indicator that goes beyond conventional technical analysis, applying principles of thermodynamics from physics. It interprets market price fluctuations as “thermodynamic energy,” enabling the highly accurate detection of subtle market changes that are often overlooked. Innovative Mechanisms 1. Dual Calculation Engines Classic TRI Mode Formula: |Close
Auto Optimized RSI   est un indicateur fléché intelligent et facile à utiliser, conçu pour fournir des signaux d’achat et de vente précis. Il utilise des simulations de trading sur des données historiques pour déterminer automatiquement les niveaux RSI les plus efficaces pour chaque instrument et période. Cet indicateur peut être utilisé comme un système de trading autonome ou intégré dans votre stratégie existante, et il est particulièrement utile pour les traders à court terme. Contrairement a
Price Magnet — Price Density and Attraction Levels Indicator Price Magnet is a professional analytical tool designed to identify key support and resistance levels based on statistical Price Density. The indicator analyzes a specified historical period and detects price levels where the market spent the most time. These zones act as “magnets,” attracting price action or forming a structural base for potential reversals. Unlike traditional Volume Profile tools, Price Magnet focuses on price-time d
Double HMA MTF for MT5
Pavel Zamoshnikov
4 (4)
This is an advanced multi-timeframe version of the popular Hull Moving Average (HMA) Features Two lines of the Hull indicator of different timeframes on the same chart. The HMA line of the higher timeframe defines the trend, and the HMA line of the current timeframe defines the short-term price movements. A graphical panel with HMA indicator data from all timeframes at the same time . If the HMA switched its direction on any timeframe, the panel displays a question or exclamation mark with a tex
Volume Profile V6
Andrey Kolesnik
4.67 (3)
Indicateur de profil de volume de marché + oscillateur intelligent. Fonctionne sur pratiquement tous les instruments — paires de devises, actions, futures, crypto-monnaies, sur volumes réels et sur ticks. Il est possible de configurer la définition automatique de la plage de construction du profil (par exemple, pour une semaine ou un mois, etc.), ou de définir la plage manuellement en déplaçant les limites (deux lignes verticales : rouge et bleue). L'affichage se fait sous forme d'histogramme. L
STRICTLY FOR BOOM INDEX ONLY!!!!! Here I bring the Maximum Trend Arrows OT1.0 MT5 indicator. This indicator is made up of a combination of different trend indicators for entries and exits, for entries an orange arrow will paint on the chart below the current market and a red flag for closing of trades and it produces buy arrows only. When the orange arrow appears, it will appear along with it's sound to notify you. The 1H timeframe is recommended, don't use it anywhere else than on the 1H timefr
CosmiCLab SMC FIBO CosmiCLab SMC FIBO is a professional trading indicator designed for traders who use Smart Money Concepts (SMC), market structure analysis and Fibonacci retracement levels. The indicator automatically detects market swings and builds Fibonacci levels based on the latest impulse movement. It also identifies market structure changes such as BOS (Break of Structure) and CHOCH (Change of Character), helping traders understand the current market direction. CosmiCLab SMC FIBO also pr
Volume Delta Candle
Muhammad Muzaffar Hussan
Volume Delta Candles: A Comprehensive Tool for In-Depth Trading Analysis Unlock a seamless way to interpret trading experience within each candle. With Volume Delta Candles, there's no need for additional volume indicators—everything you need is built in. This advanced tool utilizes lower timeframes or live market data to present the percentage of buying versus selling volume within each candle as an intuitive color-coded bar. Before diving in, ensure you’re familiar with Volume and Volume Delta
Terra Infinity is a flat indicator. This improved version of the CalcFlat indicator has three additional lines that significantly increase its effectiveness. Unlike its predecessor with two static levels, Terra Infinity adds three dynamic lines above the main histogram, which are interpreted as follows: base signal line, minimum signal line, maximum signal line. These lines are formed using the additional parameter Avg, which is the average value of the histogram. Averaging produces a line cl
# DRAWDOWN INDICATOR V4.0 - L'Outil Essentiel pour Maîtriser Votre Trading ## Transformez Votre Trading avec une Vision Complète de Vos Performances en Temps Réel Dans le monde exigeant du trading Forex et CFD, **connaître vos performances en temps réel** n'est pas un luxe, c'est une **nécessité absolue**. Le **Drawdown Indicator V4.0** est bien plus qu'un simple indicateur : c'est votre **tableau de bord professionnel** qui vous donne une vision claire, précise et instantanée de l'état de vo
An indicator of patterns #24 and #26 ("Head and Shoulders") from Encyclopedia of Chart Patterns by Thomas N. Bulkowski. Parameters: Alerts - show alert when an arrow appears   Push - send a push notification when an arrow appears (requires configuration in the terminal) PeriodBars - indicator period K - an additional parameter that influences the accuracy of pattern shape recognition ArrowType - a symbol from 1 to 17 ArrowVShift - vertical shift of arrows in pixels   ShowLevels - show levels Col
Trend Monitor MT5
Pavel Zamoshnikov
4.5 (2)
The indicator generates early signals basing on ADX reading data combined with elements of price patterns. Works on all symbols and timeframes. The indicator does not redraw its signals. You see the same things on history and in real time. For better visual perception signals are displayed as arrows (in order not to overload the chart). Features The best results are obtained when the indicator works on two timeframes. For example: M30 – the indicator shows the main trend; M5 – the indicator gen
An indicator of pattern #31 ("Long Island") from Encyclopedia of Chart Patterns by Thomas N. Bulkowski. The second gap is in the opposite direction. Parameters: Alerts - show alert when an arrow appears   Push - send a push notification when an arrow appears (requires configuration in the terminal) GapSize - minimum gap size in points ArrowType - a symbol from 1 to 17 ArrowVShift - vertical shift of arrows in points   ShowLevels - show levels ColUp - color of an upward line ColDn - color of a d
Universal Soul Reaper
Pieter Gerhardus Van Zyl
Universal Soul Reaper is an atmospheric market-flow oscillator designed to interpret price behavior as a cycle of spiritual energy. Instead of reacting to raw price alone, it visualizes the state of the market’s soul —revealing when momentum is awakening, stabilizing, or fading. The indicator operates in a separate window and presents three interwoven entities: the Ectoplasmic Veil , the Spirit Boundary , and the Soul Core . Together, they form a living framework that helps traders sense pressu
Fibaction
Abdelkhalek Orabi
Indicator Name: Fibaction – price action candle Detector Description: Fibo Signal Boxes is a powerful Smart Money Concept (SMC)-inspired indicator that auto-detects price action candles. bullish hammers and shooting stars, then draws precise Fibonacci entry zones and multiple take-profit levels directly on the chart. as for the SL personally i use 40 pips rules  Key Features: Detects bullish hammer and shooting star reversal candles. Automatically draws Fibonacci entry and TP boxes. as
## Description complète de l’indicateur WPRV2 L’indicateur **WPRV2** est une version améliorée du classique outil d’analyse technique appelé « Pourcentage de Williams » (%R). Il est principalement utilisé dans les marchés financiers tels que les places boursières, le Forex et les plateformes de cryptomonnaies pour analyser les tendances du marché et déterminer les meilleurs moments d’entrée et de sortie sur les transactions. ### Objectif de l’indicateur Le but principal de l’indicateur WPRV2
This indicator will help traders quickly identify inside bars, which are often used in price action trading strategies as potential consolidation or continuation patterns. An inside bar formation is a counter trend candle on both sides as it didn't break the previous candle high or low. Key feature: Identify inside bars in real-time. Colours inside bars while keeping normal bars. Configurable history bars. Optional pop-up alerts and phone notifications with symbol name and time of detection. W
L'indicateur montre des modèles harmoniques sur le graphique   sans repeindre   avec le minimum de décalage possible. La recherche de sommets d'indicateurs est basée sur le principe des vagues de l'analyse des prix. Les paramètres avancés vous permettent de choisir les paramètres de votre style de trading. À l'ouverture d'une bougie (barre), lorsqu'un nouveau motif se forme, une flèche de la direction probable du mouvement des prix est fixée, qui reste inchangée. L'indicateur reconnaît les modèl
Noize Absorption Index - is the manual trading system that measures the difference of pressure between bears forces and bulls forces. Green line - is a noize free index that showing curent situation. Zero value of index shows totally choppy/flat market.Values above zero level shows how powerfull bullish wave is and values below zero measures bearish forces.Up arrow appears on bearish market when it's ready to reverse, dn arrow appears on weak bullish market, as a result of reverse expectation.
Unlock key market insights with automated support and resistance lines Tired of plotting support and resistance lines? This is a multi-timeframe indicator that detects and plots supports and resistance lines in the chart with the same precision as a human eye would. As price levels are tested over time and its importance increases, the lines become thicker and darker, making price leves easy to glance and evaluate. [ Installation Guide | Update Guide | Troubleshooting | FAQ | All Products ] Boos
L'indicateur SMC Venom Model BPR est un outil professionnel pour les traders travaillant dans le concept Smart Money (SMC). Il identifie automatiquement deux modèles clés sur le graphique des prix: FVG   (Fair Value Gap) est une combinaison de trois bougies, dans laquelle il y a un écart entre la première et la troisième bougie. Forme une zone entre les niveaux où il n'y a pas de support de volume, ce qui conduit souvent à une correction des prix. BPR   (Balanced Price Range) est une combinaiso
This trading indicator is non-repainting, non-redrawing, and non-lagging, making it an ideal choice for both manual and automated trading. It is a Price Action–based system that leverages price strength and momentum to give traders a real edge in the market. With advanced filtering techniques to eliminate noise and false signals, it enhances trading accuracy and potential. By combining multiple layers of sophisticated algorithms, the indicator scans the chart in real-time and translates comple
HMA Trend Professional MT5
Pavel Zamoshnikov
4.25 (4)
Improved version of the free HMA Trend indicator (for MetaTrader 4) with statistical analysis. HMA Trend is a trend indicator based on the Hull Moving Average (HMA) with two periods. HMA with a slow period identifies the trend, while HMA with a fast period determines the short-term movements and signals in the trend direction. The main differences from the free version: Ability to predict the probability of a trend reversal using analysis of history data. Plotting statistical charts for analyzi
The RSI Divergence + FVG Signal indicator combines Relative Strength Index (RSI) Divergence with Fair Value Gap (FVG) detection to generate high-probability buy and sell signals based on both momentum shifts and institutional imbalance zones. Core Features: RSI Divergence Detection : Identifies both regular and hidden bullish/bearish divergences between price and RSI. Divergences indicate potential trend reversals or continuation. FVG Zone Recognition : Detects Fair Value Gaps (imbalances caused
A machine translation from the English product description was used. We apologize for possible imprecisions. Une traduction automatique de la description du produit en anglais a été utilisée. Nous nous excusons pour les éventuelles imprécisions. Un système de visualisation des modèles d'action des prix des chandeliers préférés. Une fois attaché, l'indicateur marquera automatiquement les modèles suivants sur le graphique : Barre Pinocchio  - une barre de petit corps avec un long «nez», motif inve
Trend Master Chart MT5
Frederic Jacques Collomb
Trend Master Chart est l'indicateur de tendance qu'il vous faut. Il se superpose au graphique et utilise un code couleur pour définir les différentes tendances/impulsions du marché. Il utilise un algorithme qui combine deux moyennes mobiles et différents oscillateurs. Les périodes de ces trois élément sont modifiables. Il fonctionne sur n'importe quel time-frame et n'importe quelle Pair. D'un coup d’œil vous pourrez identifier une tendance haussière ou baissière et les différents points d'entrée
The Trend Duration Forecast MT5 indicator is designed to estimate the probable lifespan of a bullish or bearish trend. Using a Hull Moving Average (HMA) to detect directional shifts, it tracks the duration of each historical trend and calculates an average to forecast how long the current trend is statistically likely to continue. This allows traders to visualize both real-time trend strength and potential exhaustion zones with exceptional clarity. KEY FEATURES Dynamic Trend Detection:   Utiliz
Your Trend Friend
Luigi Nunes Labigalini
5 (1)
The trend is your friend! Look at the color of the indicator and trade on that direction. It does not  repaint. After each candle is closed, that's the color of the trend. You can focus on shorter faster trends or major trends, just test what's most suitable for the symbol and timeframe you trade. Simply change the "Length" parameter and the indicator will automatically adapt. You can also change the color, thickness and style of the lines. Download and give it a try! There are big movements w
PipFinite Trend PRO MT5
Karlo Wilson Vendiola
4.84 (558)
Breakthrough Solution For Trend Trading And Filtering With All Important Features Built Inside One Tool! Trend PRO's smart algorithm detects the trend, filters out market noise and gives entry signals with exit levels. The new features with enhanced rules for statistical calculation improved the overall performance of this indicator. Important Information Revealed Maximize the potential of Trend Pro, please visit www.mql5.com/en/blogs/post/713938 The Powerful Expert Advisor Version Automatin
Les acheteurs de ce produit ont également acheté
SuperScalp Pro
Van Minh Nguyen
5 (14)
SuperScalp Pro – Système d’indicateur de scalping avancé multi-filtres SuperScalp Pro est un système d’indicateur de scalping avancé qui combine le Supertrend classique avec plusieurs filtres de confirmation intelligents. L’indicateur fonctionne efficacement sur toutes les unités de temps de M1 à H4 et est particulièrement adapté à XAUUSD, BTCUSD et aux principales paires Forex. Il peut être utilisé comme système autonome ou intégré de manière flexible dans des stratégies de trading existantes.
Azimuth Pro
Ottaviano De Cicco
5 (6)
LAUNCH PROMO Azimuth Pro price is initially set at 299$ for the first 100 buyers. Final price will be 499$ . THE DIFFERENCE BETWEEN RETAIL AND INSTITUTIONAL ENTRIES ISN'T THE INDICATOR — IT'S THE LOCATION. Most traders enter at arbitrary price levels, chasing momentum or reacting to lagging signals. Institutions wait for price to reach structured levels where supply and demand actually shift. Azimuth Pro maps these levels automatically: swing-anchored VWAP, multi-timeframe structure lines, an
Divergence Bomber
Ihor Otkydach
4.9 (86)
Chaque acheteur de cet indicateur reçoit également gratuitement : L’outil exclusif « Bomber Utility », qui accompagne automatiquement chaque opération de trading, fixe les niveaux de Stop Loss et de Take Profit, et clôture les positions selon les règles de la stratégie Des fichiers de configuration (set files) pour adapter l’indicateur à différents actifs Des set files pour configurer le Bomber Utility selon différents modes : « Risque Minimum », « Risque Équilibré » et « Stratégie d’Attente » U
Entry In The Zone and SMC Multi Timeframe is a real-time market analysis tool developed based on Smart Money Concepts (SMC). It is designed to analyze market structure, price direction, reversal points, and key zones across multiple timeframes in a systematic way. The system displays Points of Interest (POI) and real-time No Repaint signals, with instant alerts when price reaches key zones or when signals occur within those zones. It functions as both an Indicator and a Signal System (2-in-1), c
CGE Trading Suite
Carl Gustav Johan Ekstrom
5 (1)
CGE Trading Suite delivers the analytical edge typically reserved for professional trading desks. The platform integrates a full suite of analytical tools into one seamless workflow: dynamic grid mapping, liquidity behavior analysis, ECM, trend lines, MIDAS, trade cycles, and directional channel projections. Together, these provide a unified view of market structure and momentum. Directional clarity is further enhanced by the capital flow index, which measures currency basket strength to identif
Power Candles MT5
Daniel Stein
5 (7)
Power Candles – Signaux d’entrée basés sur la force pour tous les marchés Power Candles intègre l’analyse de force éprouvée de Stein Investments directement dans le graphique des prix. Au lieu de réagir uniquement au prix, chaque bougie est colorée en fonction de la force réelle du marché, ce qui permet d’identifier instantanément les phases de momentum, l’accélération de la force et les transitions de tendance propres. Une logique unique pour tous les marchés Power Candles fonctionne automatiqu
Voyez quelle strategie fonctionne reellement sur votre symbole - avant de risquer de l'argent reel. Power Bar detecte les barres de prix extremes sur n'importe quel symbole et n'importe quel timeframe, puis backteste instantanement 3 strategies de trading differentes pour que vous puissiez comparer les taux de reussite, les facteurs de profit et les P&L cote a cote. Le tout dans un seul panneau interactif. Pas de suppositions. Pas de suroptimisation. Juste des donnees. Qu'est-ce qui rend Power
Si vous achetez cet indicateur, vous recevrez mon Gestionnaire de Trading Professionnel + EA  GRATUITEMENT. Tout d'abord, il convient de souligner que ce système de trading est un indicateur non repeint, non redessiné et non retardé, ce qui le rend idéal pour le trading manuel et automatisé. Cours en ligne, manuel et téléchargement de préréglages. Le "Système de Trading Smart Trend MT5" est une solution de trading complète conçue pour les traders débutants et expérimentés. Il combine plus de 10
Meridian Pro
Ottaviano De Cicco
5 (1)
Meridian Pro: Professional Multi-Timeframe Trend Matrix for MT5 Overview Meridian Pro is a multi-timeframe trend matrix by Merkava Labs that compresses directional state, strength, momentum condition and matrix agreement into one compact panel. One adaptive engine, applied consistently from M1 to W1. No per-symbol tuning. No indicator stacking. One structured readout across every asset and every timeframe. Launch Offer — Get Meridian Pro for USD 99 (introductory). Regular price: USD 149. 1. Why
FX Trend MT5 NG
Daniel Stein
5 (4)
FX Trend NG : La Nouvelle Génération d’Intelligence de Tendance Multi-Marchés Vue d’ensemble FX Trend NG est un outil professionnel d’analyse de tendance multi-timeframe et de surveillance des marchés. Il vous permet de comprendre la structure complète du marché en quelques secondes. Au lieu de naviguer entre de nombreux graphiques, vous identifiez immédiatement quels instruments sont en tendance, où le momentum s’affaiblit et où plusieurs unités de temps sont alignées. Offre de Lancement – Ob
RelicusRoad Pro : Système d'Exploitation Quantitatif du Marché 70% DE RÉDUCTION ACCÈS À VIE (DURÉE LIMITÉE) - REJOIGNEZ 2 000+ TRADERS Pourquoi la plupart des traders échouent-ils même avec des indicateurs "parfaits" ? Parce qu'ils tradent des concepts isolés dans le vide. Un signal sans contexte est un pari. Pour gagner, il faut de la CONFLUENCE . RelicusRoad Pro est un Écosystème Quantitatif complet . Il cartographie la "Fair Value Road", distinguant le bruit des cassures structurelles. Arrête
Trend Screener Pro MT5
STE S.S.COMPANY
4.84 (103)
Indicateur de tendance, solution unique révolutionnaire pour le trading et le filtrage des tendances avec toutes les fonctionnalités de tendance importantes intégrées dans un seul outil ! Il s'agit d'un indicateur multi-période et multi-devises 100 % non repeint qui peut être utilisé sur tous les symboles/instruments : forex, matières premières, crypto-monnaies, indices et actions. Trend Screener est un indicateur de suivi de tendance efficace qui fournit des signaux de tendance fléchés avec des
Btmm state engine pro
Garry James Goodchild
5 (3)
BTMM State Engine Pro is a MetaTrader 5 indicator for traders who use the Beat The Market Maker approach: Asian session context, kill zone timing, level progression, peak formation detection, and a multi-pair scanner from a single chart. It combines cycle state logic with a built-in scanner dashboard so you do not need the same tool on many charts at once. What it does Draws the Asian session range; session times can follow broker server offset or be set in inputs. Tracks level progression (L
Crystal Heikin Ashi Signals
Muhammad Jawad Shabir
5 (2)
Crystal Heikin Ashi Signals - Professional Trend & Signal Detection Indicator Advanced Heikin Ashi Visualization with Intelligent Signal System for Manual & Automated Trading Final Price: $149 ---------> Price goes up $10 after every 10 sales . Limited slots available — act fast . Overview Crystal Heikin Ashi Signals is a professional-grade MetaTrader 5 indicator that combines pure Heikin Ashi candle visualization with an advanced momentum-shift detection system. Designed for both manual traders
Quantum TrendPulse
Bogdan Ion Puscasu
5 (22)
Présentation de   Quantum TrendPulse   , l'outil de trading ultime qui combine la puissance de   SuperTrend   ,   RSI   et   Stochastic   dans un seul indicateur complet pour maximiser votre potentiel de trading. Conçu pour les traders qui recherchent précision et efficacité, cet indicateur vous aide à identifier les tendances du marché, les changements de dynamique et les points d'entrée et de sortie optimaux en toute confiance. Caractéristiques principales : Intégration SuperTrend :   suivez f
FX Power MT5 NG
Daniel Stein
5 (31)
FX Power : Analysez la force des devises pour des décisions de trading plus intelligentes Aperçu FX Power est l'outil essentiel pour comprendre la force réelle des principales devises et de l'or, quelles que soient les conditions du marché. En identifiant les devises fortes à acheter et les faibles à vendre, FX Power simplifie vos décisions de trading et révèle des opportunités à forte probabilité. Que vous suiviez les tendances ou anticipiez les retournements à l'aide de valeurs extrêmes de D
OmniSync Projection
Antonio-alin Teculescu
5 (1)
Chronos Fractal Engine is an innovative price projection indicator for MetaTrader 5, designed to transform your technical analysis by intelligently identifying and projecting historical price patterns. Built upon an advanced correlation algorithm and the fractal principles of the market, this powerful tool visualizes potential future price movements, giving you a unique edge in your trading decisions. What is Chronos Fractal Engine? At its core, the Chronos Fractal Engine employs a sophisticat
Atomic Analyst MT5
Issam Kassas
3.94 (31)
Tout d'abord, il convient de souligner que cet indicateur de trading n'est ni repainting, ni redrawing et ne présente aucun délai, ce qui le rend idéal à la fois pour le trading manuel et automatisé. Manuel de l'utilisateur : réglages, entrées et stratégie. L'Analyste Atomique est un indicateur d'action sur les prix PA qui utilise la force et le momentum du prix pour trouver un meilleur avantage sur le marché. Équipé de filtres avancés qui aident à éliminer les bruits et les faux signaux, et à
RFI levels PRO MT5
Roman Podpora
3.67 (3)
L'indicateur montre avec précision les points de retournement et les zones de retour des prix où le       Acteurs majeurs   . Vous repérez les nouvelles tendances et prenez des décisions avec une précision maximale, en gardant le contrôle de chaque transaction. VERSION MT4     -    Révèle son potentiel maximal lorsqu'il est combiné à l'indicateur   TREND LINES PRO Ce que l'indicateur montre : Structures et niveaux d'inversion avec activation au début d'une nouvelle tendance. Affichage des nivea
Currency Strength Dashboard Pro Tableau de bord professionnel d’ analyse de la force des devises en temps réel pour MetaTrader 5 . L’indicateur calcule et affiche la force de 8 devises majeures (EUR, USD, GBP, JPY, CHF, AUD, CAD, NZD) en utilisant 28 paires de devises simultanément sur plusieurs unités de temps. Le tableau de bord offre au trader une vision complète du marché en un seul coup d’œil — sans calculs supplémentaires ni changement entre plusieurs graphiques. Méthode de calcul L’indica
Gann Made Easy   est un système de trading Forex professionnel et facile à utiliser qui est basé sur les meilleurs principes de trading en utilisant la théorie de mr. WD Gann. L'indicateur fournit des signaux d'ACHAT et de VENTE précis, y compris les niveaux Stop Loss et Take Profit. Vous pouvez échanger même en déplacement en utilisant les notifications PUSH. VEUILLEZ ME CONTACTER APRÈS L'ACHAT POUR RECEVOIR GRATUITEMENT DES INSTRUCTIONS DE TRADING ET D'EXCELLENTS INDICATEURS SUPPLÉMENTAIRES! V
Market Structure Order Block Dashboard MT5 est un indicateur MT5 axé sur la structure de marché et les concepts ICT / Smart Money : HH/HL/LH/LL , BOS , ChoCH , ainsi que Order Blocks , Fair Value Gaps (FVG) , Liquidité (EQH/EQL, sweeps), Sessions / Kill Zones et un Volume Profile intégré, avec un dashboard compact de confluence. Important : c’est un outil d’analyse . Il ne passe aucun ordre (ce n’est pas un EA). Bonus acheteurs Après achat, vous pouvez recevoir 2 indicateurs bonus (au choix) pa
ARICoins
Temirlan Kdyrkhan
ARICoin is a powerful trading companion designed to generate high-probability entry signals with dynamic TP/SL/DP levels based on volatility. Built-in performance tracking shows win/loss stats, PP1/PP2 hits, and success rates all updated live. Key Features: Buy/Sell signals with adaptive volatility bands Real-time TP/SL/DP levels based on ATR Built-in MA Filter with optional ATR/StdDev volatility Performance stats panel (Success, Profit/Loss, PP1/PP2) Alerts via popup, sound, push, or email Cust
[ My Products ] , [ My Channel ]   ,  [ LIVE SIGNAL ] HFT Spike Detector HFT Spike Detector est un outil professionnel de surveillance des ticks conçu pour analyser et mesurer en temps réel les mouvements de prix à haute fréquence (pics soudains causés par le HFT). Son objectif est de vous permettre de détecter les glissements anormaux, les lacunes de liquidité et les pics de prix au niveau milliseconde causés par le broker, à l'aide de données numériques. Comme il analyse le flux de ticks e
Grabber System MT5
Ihor Otkydach
4.83 (23)
Je vous présente un excellent indicateur technique : Grabber, qui fonctionne comme une stratégie de trading "tout-en-un", prête à l'emploi. En un seul code sont intégrés des outils puissants d'analyse technique du marché, des signaux de trading (flèches), des fonctions d'alerte et des notifications push. Chaque acheteur de cet indicateur reçoit également gratuitement : L'utilitaire Grabber : pour la gestion automatique des ordres ouverts Un guide vidéo étape par étape : pour apprendre à installe
Gold Sniper Scalper Pro
Ich Khiem Nguyen
3.78 (9)
Gold Sniper Scalper Pro est un indicateur pour MetaTrader 5 conçu spécifiquement pour détecter les figures de fausse cassure (false breakout) sur XAUUSD. Il identifie la structure piège à 4 barres où le prix franchit la limite d'un range, attire les traders de cassure, puis inverse — confirmant que le mouvement était une fausse cassure. L'indicateur évalue chaque configuration selon 17 facteurs de qualité, la traite à travers un pipeline de confluence à 4 couches, la vérifie contre un moteur de
TREND LINES PRO   Cet indicateur permet de comprendre les véritables changements de direction du marché. Il révèle les renversements de tendance et les points de retour des principaux acteurs. Tu vois   Lignes BOS   Détection des changements de tendance et des niveaux clés sur des unités de temps supérieures, sans paramètres complexes ni interférences inutiles. Les signaux restent affichés sur le graphique même après la fermeture de la bougie. Version MT4   -   Révèle son potentiel maximal lorsq
Smart Stop Indicator – Précision intelligente du stop-loss directement sur votre graphique Présentation Smart Stop Indicator est la solution idéale pour les traders qui souhaitent placer leur stop-loss de manière claire et méthodique, sans deviner ni suivre leur intuition. Cet outil combine la logique classique de price action (succession de plus hauts et de plus bas) avec une reconnaissance moderne des cassures pour identifier le prochain niveau de stop réellement logique. Que le marché soit
Bill Williams Advanced
Siarhei Vashchylka
5 (11)
Bill Williams Advanced is designed for automatic chart analysis using Bill Williams' "Profitunity" system. The indicator analyzes four timeframes at once. Manual (Be sure to read before purchasing) Advantages 1. Analyzes the chart using Bill Williams' "Profitunity" system. Signals are displayed in a table in the corner of the screen and on the price chart. 2. Finds all known AO and AC signals, as well as zone signals. Equipped with a trend filter based on the Alligator. 3. Finds "Divergence Bar
ARIPoint
Temirlan Kdyrkhan
ARIPoint is a powerful trading companion designed to generate high-probability entry signals with dynamic TP/SL/DP levels based on volatility. Built-in performance tracking shows win/loss stats, PP1/PP2 hits, and success rates all updated live. Key Features: Buy/Sell signals with adaptive volatility bands Real-time TP/SL/DP levels based on ATR Built-in MA Filter with optional ATR/StdDev volatility Performance stats panel (Success, Profit/Loss, PP1/PP2) Alerts via popup, sound, push, or email Cu
Plus de l'auteur
Just Waves
Dmitriy Medvedev
4.33 (3)
Among various methods of technical analysis of the Forex market, wave analysis used to be the basic one. Anyway, when it comes to the price change over a period of time, we are dealing with waves. According to Elliott's theory, waves are formed in a fractal way. On the same principle MT4 indicator "Just Waves" marks up waves of different levels (up to 8) and creates graphic lines that indicate the beginning and ending points of the waves. "Just Waves" offers an objective criterion of a wave, the
Filtrer:
Aucun avis
Répondre à l'avis