SimSim Trading Simple Signal MT5
- Indicateurs
- Version: 1.1
- Mise à jour: 22 juin 2021
- Activations: 9

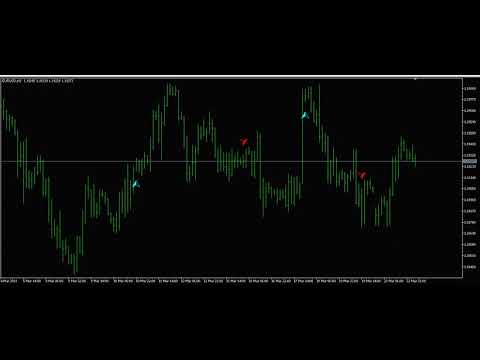
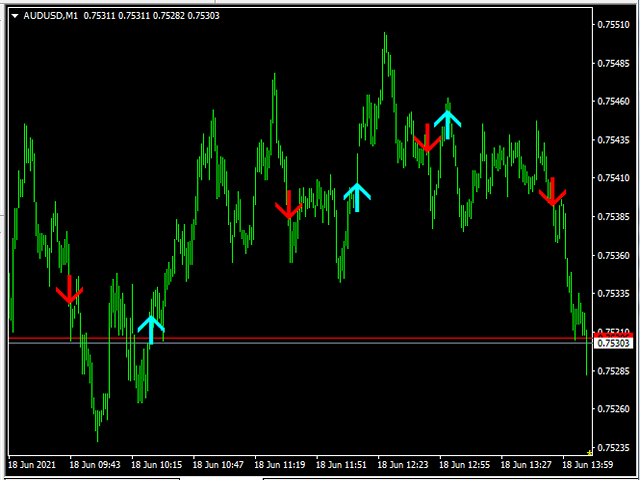
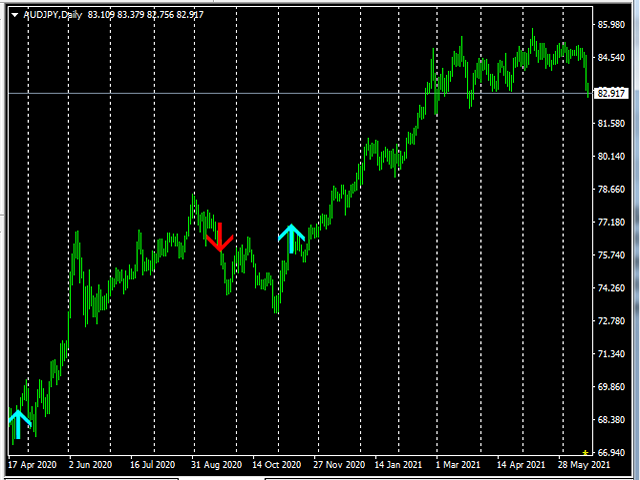
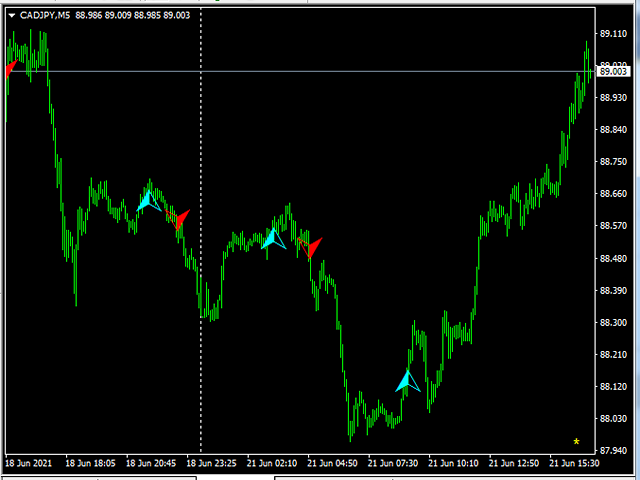
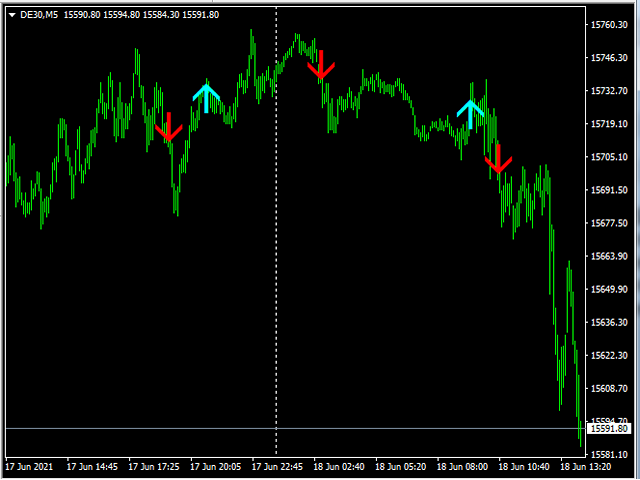
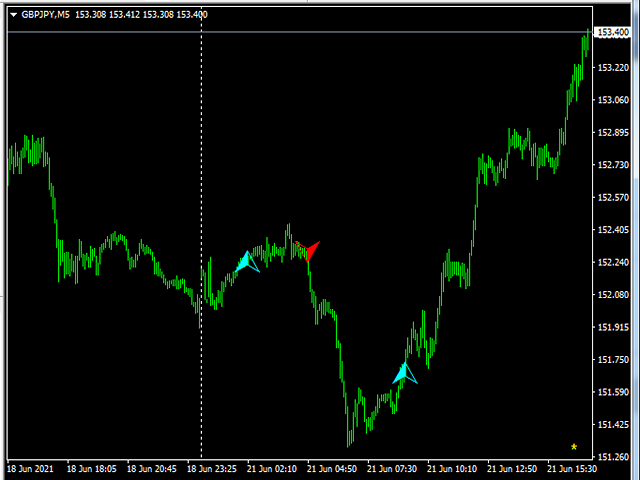
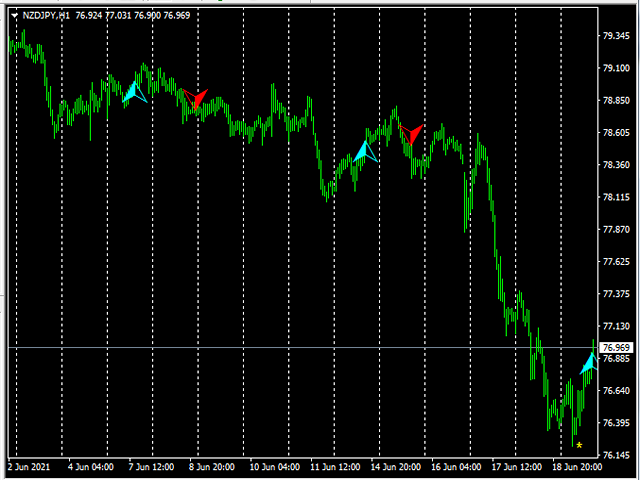
MT5 trend indicator works without redrawing. Provides signals for entering trades, works on charts of any instrument.
Трендовый индикатор МТ5, работает без перерисовки. Выдает сигналы для входа в сделки, работает на графиках любого инструмента.
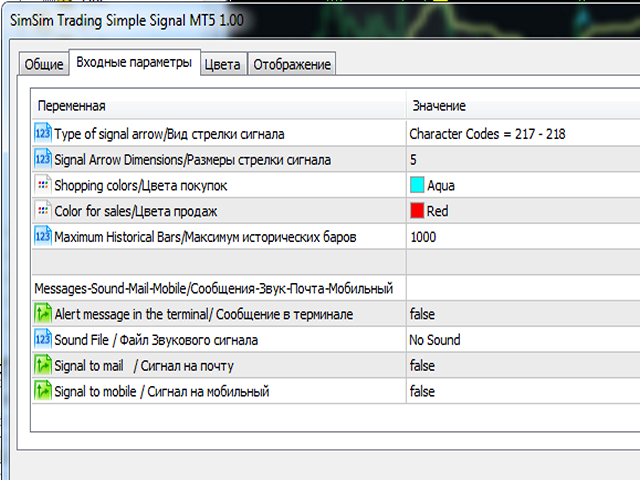
Input parameters are for styling and messages only. / Входные параметры только для оформления и сообщений.
All original signal calculations do not need additional parameters. / Все оригинальные расчеты сигнала, не нуждаются в дополнительных параметрах.
Link to MT4 version of the indicator: Ссылка на МТ4 версию индикатора:
https://www.mql5.com/ru/market/product/68521
Input parameters. / Входные параметры.
- Type of signal arrow / Вид стрелки сигнала
- Signal Arrow Dimensions / Размеры стрелки сигнала
- Shopping colors / Цвета покупок
- Color for sales / Цвета продаж
- Maximum Historical Bars / Максимум исторических баров
Messages-Sound-Mail-Mobile / Сообщения-Звук-Почта-Мобильный
- Alert message in the terminal / Сообщение в терминале
- Sound File / Файл Звукового сигнала
- Signal to mail / Сигнал на почту
- Signal to mobile / Сигнал на мобильный
Download the demo version, see what signals the indicator generates, and draw conclusions. An additional signal in your strategy will not be superfluous!
Загружайте демо версию, смотрите какие сигналы генерирует индикатор, и делайте выводы. Дополнительный сигнал в вашей стратегии лишним не будет!
Загружайте демо версию, смотрите какие сигналы генерирует индикатор, и делайте выводы. Дополнительный сигнал в вашей стратегии лишним не будет!
For developers: using the indicator in an Expert Advisor: / Для разработчиков: использование индикатора в советнике:
Buffer 0 - signals for BUY: If the value is not equal to EMPTY_VALUE in the buffer signal = Low () of the candle.
Buffer 1 - signals for SELL: If the value is not equal to EMPTY_VALUE in the buffer signal = High () candles.
Буфер 0 - сигналы для BUY: Если значение не равно EMPTY_VALUE в буфере сигнал = Low() свечи.
Буфер 1 - сигналы для SELL: Если значение не равно EMPTY_VALUE в буфере сигнал = High() свечи.