Fractals scanner MT5

This multi time frame and multi symbol indicator identifies fractals patterns. As a bonus it can also scan for Parabolic SAR (pSAR) trend changes. Combined with your own rules and techniques, this indicator will allow you to create (or enhance) your own powerful system.

Features

  • Can monitor all symbols visible in your Market Watch window at the same time. Apply the indicator to just one chart and instantly monitor the entire market.
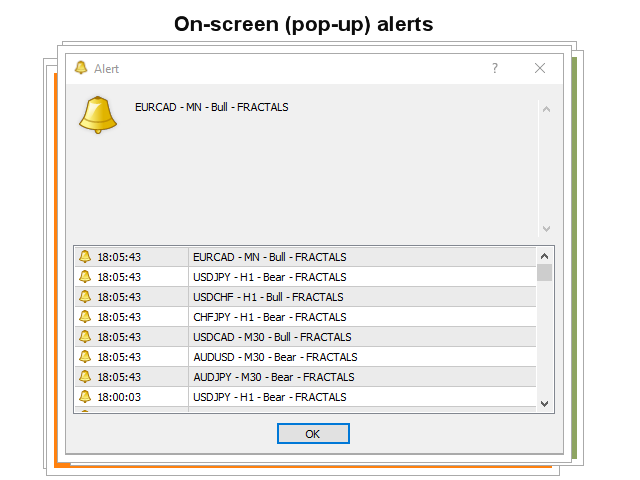
  • Can monitor every time frame, from M1 to MN, and sends you a real-time alert when when the pattern or trend change has been identified. All Metatrader native alert types are supported.
  • Can use RSI and/or moving average as trend filters to properly identify potential reversals.
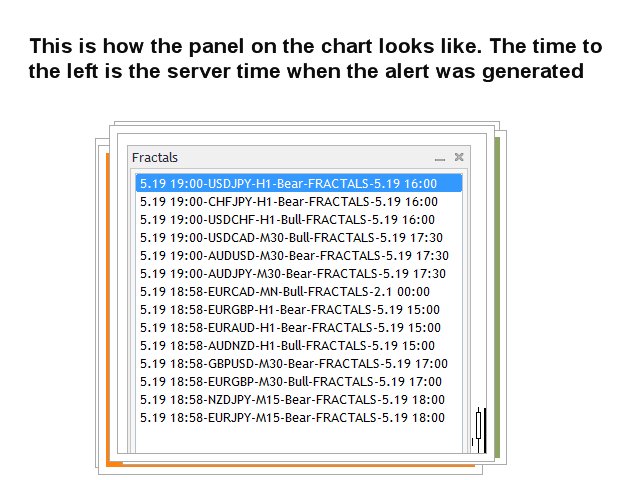
  • The indicator includes an interactive panel. When clicking on an item a new chart will be opened with the symbol and time frame in question.
  • The indicator can write the signals to a text file or to global variables which both can be used by an own developed Expert Advisor (EA) for auto trading. You can find more information about the content and location of the text file in the blog.
  • Can also be used in single chart mode (scanning only current chart).

Input parameters

The description and explanation of the input parameters can be found here.

Important

Please note that due to the multi functionality neither buy and sell advice nor lines and arrows will be drawn on the chart where the indicator is installed (except for single chart mode). An arrow showing the pattern will be drawn on the chart which will be opened by clicking on a signal in the panel.

It is highly advisable to put the indicator on a clean (empty) chart without any other indicators or Expert Advisors on it which could interfere with the scanner.


Produits recommandés
Follow The Line MT5
Oliver Gideon Amofa Appiah
4.6 (35)
This indicator obeys the popular maxim that: "THE TREND IS YOUR FRIEND" It paints a GREEN line for BUY and also paints a RED line for SELL. (you can change the colors). It gives alarms and alerts of all kinds. IT DOES NOT REPAINT and can be used for all currency pairs and timeframes. Yes, as easy and simple as that. Even a newbie can use it to make great and reliable trades. NB: For best results, get my other premium indicators for more powerful and reliable signals. Get them here: https://www.m
FREE
Important Lines
Terence Gronowski
4.88 (24)
This indicator displays Pivot-Lines, preday high and low, preday close and the minimum and maximum of the previous hour. You just have to put this single indicator to the chart to have all these important lines, no need to setup many single indicators. Why certain lines are important Preday high and low : These are watched by traders who trade in a daily chart. Very often, if price climbs over or falls under a preday low/high there is an acceleration in buying/selling. It is a breakout out of a
FREE
Donchian Breakout And Rsi
Mattia Impicciatore
4.5 (2)
Description générale Cet indicateur est une version améliorée du Canal Donchian classique, enrichie de fonctionnalités pratiques pour le trading réel. En plus des trois lignes standard (supérieure, inférieure et ligne médiane), le système détecte les cassures et les affiche visuellement avec des flèches sur le graphique, en montrant uniquement la ligne opposée à la direction actuelle de la tendance pour une lecture plus claire. L’indicateur comprend : Signaux visuels : flèches colorées lors des
FREE
Donchian Channel DC is the indicator of Donchian Channels, that plots maximum and minimum values of a specific period, besides mean value line. It´s possible to configure simple period for analysis and the indicator will plot all three values. You can trade with this indicator as trend or reversal, according to each strategy. Do not let to test others indicators as soon as others expert advisors.
Mitimom
Danil Poletavkin
The indicator is based on Robert Miner's methodology described in his book "High probability trading strategies" and displays signals along with momentum of 2 timeframes. A Stochastic oscillator is used as a momentum indicator. The settings speak for themselves period_1 is the current timeframe, 'current' period_2 is indicated - the senior timeframe is 4 or 5 times larger than the current one. For example, if the current one is 5 minutes, then the older one will be 20 minutes The rest of the s
FREE
The indicator identifies when a divergence occurs between price and an indicator or oscillator. It identifies both regular and hidden divergences. Combined with your own rules and techniques, this indicator will allow you to create (or enhance) your own powerful system. For higher probability setups I can recommend you to use my Supply Demand indicator and trade only if the divergence occurs inside a zone. Supply zone for bearish div and demand zone for bullish div. The optimal scenario is if it
FREE
Statistical Arbitrage Spread Generator for Cointegration [MT5] What is Pair Trading? Pair trading is a market-neutral strategy that looks to exploit the relative price movement between two correlated assets — instead of betting on the direction of the market. The idea? When two assets that usually move together diverge beyond a statistically significant threshold, one is likely mispriced. You sell the expensive one, buy the cheap one , and profit when they converge again. It’s a statistica
FREE
FlatBreakout MT5 (Free Version) Flat Range Detector and Breakout Panel for MT5 — GBPUSD Only FlatBreakout MT5   is the free version of the professional FlatBreakoutPro MT5 indicator, specially designed for flat (range) detection and breakout signals on the   GBPUSD   pair only. Perfect for traders who want to experience the unique fractal logic of FlatBreakout MT5 and test breakout signals on a live market without limitations. Who Is This Product For? For traders who prefer to trade breakout of
FREE
All-in-One Chart Patterns Professional Level: The Ultimate 36-Pattern Trading System All-in-One Chart Patterns Professional Level is a comprehensive 36-pattern indicator well known by retail traders, but significantly enhanced with superior accuracy through integrated news impact analysis and proper market profile positioning. This professional-grade trading tool transforms traditional pattern recognition by combining advanced algorithmic detection with real-time market intelligence.  CORE FEATU
FREE
Candle Countdown — Temps précis jusqu’à la clôture de la bougie pour MT5 Candle Countdown est un outil simple et précis qui affiche le temps restant avant la clôture de la bougie actuelle directement sur le graphique. Lorsque l’entrée dépend de la clôture de la bougie, même quelques secondes peuvent faire la différence. Cet indicateur vous permet de voir l’heure exacte et de prendre des décisions sans précipitation ni suppositions. Un indicateur pour un contrôle précis de la clôture des bougies
FREE
PZ Inside Bars MT5
PZ TRADING SLU
4.5 (12)
Enhance your price action strategy: inside bar breakouts at your fingertips This indicator detects inside bars of several ranges, making it very easy for price action traders to spot and act on inside bar breakouts. [ Installation Guide | Update Guide | Troubleshooting | FAQ | All Products   |  Get Help ] Easy to use and understand Customizable color selections The indicator implements visual/mail/push/sound alerts The indicator does not repaint or backpaint An inside bar is a bar or series of
FREE
Indicateur Heiken Ashi MT5 Améliorez votre analyse de marché avec l'indicateur Heiken Ashi MT5. Cet outil puissant transforme les données de prix standard en bougies plus lisses et orientées tendance, facilitant ainsi l'identification des tendances du marché et des points de retournement potentiels. Principales caractéristiques: Identification claire des tendances: Distinguez visuellement les tendances haussières et baissières grâce à différentes couleurs de bougies. Réduction du bruit: Filtrez
FREE
Easy GOLD MT5
Franck Martin
3.88 (42)
Easy Gold is the latest addition to the BotGPT family. It is surprising and very powerful. It is ideal for beginners due to its simplicity.  There is absolutely nothing to do, it's 100% automated, simply indicate the percentage of risk you want to take per trade and the EA is ready. Whatever your capital, the EA takes care of everything. Optimized on (XAUUSD).  Unleash all the power with the professional version (AGI Gold) and its connection to the neural network, available in my store. My othe
FREE
RSI abcd
Francisco Gomes Da Silva
4.33 (3)
Détecteur de Motif ABCD RSI : Stratégie Technique 1. Fonctionnement de l'Indicateur Combine le RSI classique avec la détection automatique de motifs harmoniques ABCD . Composants Clés RSI standard (période ajustable) Marqueurs de sommets et creux (flèches) Motifs ABCD (lignes vertes/rouges) Filtres de surachat (70) et survente (30) 2. Configuration sur MT5 period = 14 ; // Période RSI size = 4 ; // Taille maximale du motif OverBought = 70 ; // Niveau de surachat OverSold = 30 ; // Niveau de surv
FREE
Reversal Candles MT5
Nguyen Thanh Cong
4.86 (7)
Introduction Reversal Candles is a cutting-edge non-repainting   forex indicator designed to predict price reversals with remarkable accuracy through a sophisticated combination of signals. Signal Buy when the last closed candle has a darker color (customizable) and an up arrow is painted below it Sell when the last closed candle has a darker color (customizable) and a down arrow is painted above it
FREE
PZ Penta O MT5
PZ TRADING SLU
3.5 (4)
The Penta-O is a 6-point retracement harmonacci pattern which usually precedes big market movements. Penta-O patterns can expand and repaint quite a bit. To make things easier this indicator implements a twist: it waits for a donchian breakout in the right direction before signaling the trade. The end result is an otherwise repainting indicator with a very reliable trading signal. The donchian breakout period is entered as an input. [ Installation Guide | Update Guide | Troubleshooting | FAQ | A
FREE
SMMA Bands Indicator
Elie Baptiste Granger
The SMMA Bands indicator is an advanced volatility-based trading tool that creates 6 dynamic support and resistance levels around an envelope formed by two Smoothed Moving Averages (SMMA).  This indicator combines the reliability of SMMA trend identification with the precision of standard deviation-based volatility bands, making it suitable for both trend-following and mean-reversion strategies. Every band has its own buffer for use in EA. feel free to make suggestions and add reviews , i will
FREE
LT Donchian Channel
Thiago Duarte
4.86 (7)
Donchian Channel is an indicator created by Richard Donchian. It is formed by taking the highest high and the lowest low of the last specified period in candles. The area between high and low is the channel for the chosen period. Its configuration is simple. It is possible to have the average between the upper and lower lines, plus you have alerts when price hits one side. If you have any questions or find any bugs, please contact me. Enjoy!
FREE
HMA Color with Alerts MT5
Pavel Zamoshnikov
4.75 (57)
Hull Moving Average (HMA) is well-deservedly popular among traders because of the effective averaging of market noise and a relatively small delay. The current MetaTrader 5 version changes its color when the movement direction changes. Sound and text signals are available. It also supports sending email and push messages. It is possible to trigger a signal on the current incomplete bar, although such a signal may be canceled before completion if conditions are no longer appropriate. One of the p
FREE
Magic 7 Indicator
Marek Pawel Szczesny
5 (1)
Overview Magic 7 Indicator is a comprehensive MetaTrader 5 (MQL5) indicator that identifies seven different trading scenarios based on candlestick patterns and technical analysis. The indicator combines traditional price action patterns with modern concepts like Fair Value Gaps (FVG) to provide trading signals with precise entry points and stop loss levels. Features 7 Trading Scenarios : Each scenario identifies specific market conditions and trading opportunities Visual Signals : Clear buy/sell
FREE
Pivot MT5
Dmitrij Isaenko
The indicator draws daily support and resistance lines on the chart, as well as the Pivot level (reversal level). Adapted to work in MT5 The standard timeframe for calculating support and resistance levels is D1. You can choose other timeframes according to your strategy (for example, for M1-M15, the optimal timeframe for calculations is H1) The function for calculating support and resistance levels has been updated; in this calculation option, fibonacci levels are taken into account, respec
FREE
This indicator is a zero-lag indicator and displays  strength of trend change . True Trend  Oscillator Pro works best in combination with True Trend Moving Average Pro that displays exact trend as is. Oscillator value is exact price change in given direction of the trend. True Trend Moving Average Pro: https://www.mql5.com/en/market/product/103586 If you set PERIOD input parameter to 1 this indicator becomes a sharpshooter for binary options. Developers can use True Trend Oscillator in Exper
FREE
Indicator and Expert Adviser  EA Available in the comments section of this product. Download with Indicator must have indicator installed for EA to work. Mt5 indicator alerts for bollinger band and envelope extremes occurring at the same time. Buy signal alerts occur when A bullish candle has formed below both the lower bollinger band and the lower envelope  Bar must open and close below both these indicators. Sell signal occur when A bear bar is formed above the upper bollinger band and upper
FREE
Multi-timeframe trend indicator based on the ADX / ADXWilder indicator with Fibonacci levels The indicator shows trend areas using ADX or ADXWilder indicator data from multiple timeframes. The impulse mode of the indicator allows you to catch the beginning of a trend, and several "Screens" with different timeframes allow you to filter out market noise. Fibonacci levels are added to the price chart, which have flexible settings. How the indicator works: if PDI is greater than NDI, then   it`s
FREE
The indicator detects and displays М. Gartley's Butterfly pattern. The pattern is plotted by the extreme values of the ZigZag indicator (included in the resources, no need to install). After detecting the pattern, the indicator notifies of that by the pop-up window, a mobile notification and an email. The pattern and wave parameters are displayed on the screenshots. The default parameters are used for demonstration purposes only in order to increase the amount of detected patterns. Parameters z
Mirror Chart MT5
Andrej Hermann
5 (1)
The Mirror Chart MT5 is a overlay indicator specifically designed to project a second financial instrument directly onto the main chart window. This tool is invaluable for traders who rely on correlation analysis, as it visualizes the price movements of two different instruments in real time. Unlike traditional overlays, this indicator utilizes intelligent, dynamic centering and scaling logic. It continuously analyzes the visible price range in the current window for both symbols and calculates
FREE
Dual RSI
Paul Conrad Carlson
3.5 (2)
Indicator alerts for Dual Relative strength index rsi. Large rsi preset at 14 is below 30 small rsi preset at 4 is below 10 for buy bullish signals . Large rsi preset are 14 is above 70 small rsi preset at 4 is above 90 for sell bearish signals . Includes mobile and terminal alerts. draws lines when alerts. This indicator can help identify extremes and then the tops or bottoms of those extremes .
FREE
L'Indice Directionnel Moyen (ADX) Scanner Multidevises MT5 est un indicateur de trading avancé conçu pour analyser simultanément plusieurs paires de devises. Il bénéficie aux traders cherchant à améliorer leur processus de prise de décision en fournissant des signaux en temps réel basés sur l'Indice Directionnel Moyen, permettant une analyse efficace des tendances du marché. Cet outil simplifie l'expérience de trading en facilitant l'identification de la force des tendances et du mouvement direc
JAC Trend Color Candle
Eduardo Da Costa Custodio Santos
L'indicateur "JAC Trend Color Candle" pour Meta Trader 5, a été créé pour faciliter visuellement la tendance pour le trader. Il est basé sur trois paramètres, qui identifient la tendance haussière, la tendance baissière et le marché sans tendance. Les couleurs sont configurables par le commerçant, et le commerçant moyen également. les paramètres de tendance ne peuvent pas être configurés car ils sont le différentiel de l'indicateur.
Easy Correlations Indicator The Easy Correlations Indicator is designed to help traders analyze the relationship between two correlated instruments. By monitoring the distance between their Relative Strength Index (RSI) values, the indicator highlights situations where one instrument has moved significantly further than the other. This creates potential trading opportunities: Sell the stronger instrument (overstretched RSI) Buy the weaker instrument (lagging RSI) Because the positions are opened
FREE
Les acheteurs de ce produit ont également acheté
ARIPoint
Temirlan Kdyrkhan
ARIPoint is a powerful trading companion designed to generate high-probability entry signals with dynamic TP/SL/DP levels based on volatility. Built-in performance tracking shows win/loss stats, PP1/PP2 hits, and success rates all updated live. Key Features: Buy/Sell signals with adaptive volatility bands Real-time TP/SL/DP levels based on ATR Built-in MA Filter with optional ATR/StdDev volatility Performance stats panel (Success, Profit/Loss, PP1/PP2) Alerts via popup, sound, push, or email Cu
SuperScalp Pro
Van Minh Nguyen
4.57 (21)
SuperScalp Pro – Système avancé d’indicateur de scalping multi-filtres SuperScalp Pro est un indicateur de scalping avancé qui combine le Supertrend classique avec plusieurs filtres de confirmation intelligents afin d’identifier les opportunités de trading. Il fonctionne efficacement sur plusieurs unités de temps, de M1 à H4, avec des performances optimisées sur XAUUSD, BTCUSD et les principales paires Forex. L’indicateur fournit des signaux d’achat et de vente clairs, ainsi que des niveaux d’en
Divergence Bomber
Ihor Otkydach
4.9 (87)
Chaque acheteur de cet indicateur reçoit également gratuitement : L’outil exclusif « Bomber Utility », qui accompagne automatiquement chaque opération de trading, fixe les niveaux de Stop Loss et de Take Profit, et clôture les positions selon les règles de la stratégie Des fichiers de configuration (set files) pour adapter l’indicateur à différents actifs Des set files pour configurer le Bomber Utility selon différents modes : « Risque Minimum », « Risque Équilibré » et « Stratégie d’Attente » U
Entry In The Zone and SMC Multi Timeframe is a real-time 2-in-1 market analysis tool that combines market structure analysis and a No Repaint BUY / SELL signal system into a single indicator, built on Smart Money Concepts (SMC) — a widely adopted framework used by professional traders to understand market structure. This indicator helps you see the market more clearly, make decisions based on structure rather than guesswork, and focus on high-probability zones where price is more likely to react
Power Candles MT5
Daniel Stein
4.75 (8)
Power Candles V3 - Le premier indicateur de force auto-optimisant Power Candles V3 transforme l'analyse de force en un véritable système de trading actionnable. L'indicateur ne se contente plus de colorer votre graphique selon la force du marché : il exécute en arrière-plan une auto-optimisation en direct et vous livre le meilleur Stop Loss, Take Profit et seuil de signal pour votre symbole. Un clic l'adopte pour le trading en direct. Cet outil fait partie de l'écosystème Stein Investments.  Dé
Grabber System MT5
Ihor Otkydach
4.83 (23)
Je vous présente un excellent indicateur technique : Grabber, qui fonctionne comme une stratégie de trading "tout-en-un", prête à l'emploi. En un seul code sont intégrés des outils puissants d'analyse technique du marché, des signaux de trading (flèches), des fonctions d'alerte et des notifications push. Chaque acheteur de cet indicateur reçoit également gratuitement : L'utilitaire Grabber : pour la gestion automatique des ordres ouverts Un guide vidéo étape par étape : pour apprendre à installe
Quantum TrendPulse
Bogdan Ion Puscasu
5 (23)
Présentation de   Quantum TrendPulse   , l'outil de trading ultime qui combine la puissance de   SuperTrend   ,   RSI   et   Stochastic   dans un seul indicateur complet pour maximiser votre potentiel de trading. Conçu pour les traders qui recherchent précision et efficacité, cet indicateur vous aide à identifier les tendances du marché, les changements de dynamique et les points d'entrée et de sortie optimaux en toute confiance. Caractéristiques principales : Intégration SuperTrend :   suivez f
Azimuth Pro
Ottaviano De Cicco
5 (7)
Azimuth Pro V2: Synthetic Fractal Structure and Confirmed Entries for MT5 Overview Azimuth Pro is a multi-level swing structure indicator by Merkava Labs . Four nested swing layers, swing-anchored VWAP, ABC pattern detection, three-timeframe structural filtering, and closed-bar confirmed entries — one chart, one workflow from micro-swings to macro-cycles. This is not a blind signal product. It is a structure-first workflow for traders who care about location, context, and timing. V2 Launch Offe
Si vous achetez cet indicateur, vous recevrez mon Gestionnaire de Trading Professionnel + EA  GRATUITEMENT. Tout d'abord, il convient de souligner que ce système de trading est un indicateur non repeint, non redessiné et non retardé, ce qui le rend idéal pour le trading manuel et automatisé. Cours en ligne, manuel et téléchargement de préréglages. Le "Système de Trading Smart Trend MT5" est une solution de trading complète conçue pour les traders débutants et expérimentés. Il combine plus de 10
SignalTech MT5 is a trading system for EURUSD, USDCHF, USDJPY, AUDUSD, NZDUSD, EURJPY, AUDJPY, NZDJPY, CADJPY H2 and H3 Timeframe.  It can generate signals with Buy/Sell Arrows and Pop-Up/Sound Alerts. Each signal has clear Entry and Stop Loss levels, which should be automatically flagged on the chart, as well as potential Targets 1, 2, and 3. The Entry and TP levels are fixed after the trade is taken. The exit level is dynamic. If there are signs of a potential short-term trend reversal, the
Gann Made Easy   est un système de trading Forex professionnel et facile à utiliser qui est basé sur les meilleurs principes de trading en utilisant la théorie de mr. WD Gann. L'indicateur fournit des signaux d'ACHAT et de VENTE précis, y compris les niveaux Stop Loss et Take Profit. Vous pouvez échanger même en déplacement en utilisant les notifications PUSH. VEUILLEZ ME CONTACTER APRÈS L'ACHAT POUR RECEVOIR GRATUITEMENT DES INSTRUCTIONS DE TRADING ET D'EXCELLENTS INDICATEURS SUPPLÉMENTAIRES! V
FX Trend MT5 NG
Daniel Stein
5 (4)
FX Trend NG : La Nouvelle Génération d’Intelligence de Tendance Multi-Marchés Vue d’ensemble FX Trend NG est un outil professionnel d’analyse de tendance multi-timeframe et de surveillance des marchés. Il vous permet de comprendre la structure complète du marché en quelques secondes. Au lieu de naviguer entre de nombreux graphiques, vous identifiez immédiatement quels instruments sont en tendance, où le momentum s’affaiblit et où plusieurs unités de temps sont alignées. Offre de Lancement – Ob
Meravith MT5
Ivan Stefanov
5 (1)
Outil des market makers. Meravith va : Analyser toutes les unités de temps et afficher la tendance actuellement en vigueur. Mettre en évidence les zones de liquidité (équilibre des volumes) où le volume haussier et baissier est égal. Afficher tous les niveaux de liquidité provenant de différentes unités de temps directement sur votre graphique. Générer et présenter une analyse de marché sous forme de texte pour votre référence. Calculer les objectifs, les niveaux de support et les points de stop
Atomic Analyst MT5
Issam Kassas
3.94 (31)
Tout d'abord, il convient de souligner que cet indicateur de trading n'est ni repainting, ni redrawing et ne présente aucun délai, ce qui le rend idéal à la fois pour le trading manuel et automatisé. Manuel de l'utilisateur : réglages, entrées et stratégie. L'Analyste Atomique est un indicateur d'action sur les prix PA qui utilise la force et le momentum du prix pour trouver un meilleur avantage sur le marché. Équipé de filtres avancés qui aident à éliminer les bruits et les faux signaux, et à
Bill Williams Advanced
Siarhei Vashchylka
5 (11)
Bill Williams Advanced is designed for automatic chart analysis using Bill Williams' "Profitunity" system. The indicator analyzes four timeframes at once. Manual (Be sure to read before purchasing) Advantages 1. Analyzes the chart using Bill Williams' "Profitunity" system. Signals are displayed in a table in the corner of the screen and on the price chart. 2. Finds all known AO and AC signals, as well as zone signals. Equipped with a trend filter based on the Alligator. 3. Finds "Divergence Bar
Trend Screener Pro MT5
STE S.S.COMPANY
4.85 (104)
Indicateur de tendance, solution unique révolutionnaire pour le trading et le filtrage des tendances avec toutes les fonctionnalités de tendance importantes intégrées dans un seul outil ! Il s'agit d'un indicateur multi-période et multi-devises 100 % non repeint qui peut être utilisé sur tous les symboles/instruments : forex, matières premières, crypto-monnaies, indices et actions. Trend Screener est un indicateur de suivi de tendance efficace qui fournit des signaux de tendance fléchés avec des
Top indicator for MT5   providing accurate signals to enter a trade without repainting! It can be applied to any financial assets:   forex, cryptocurrencies, metals, stocks, indices .  Watch  the video  (6:22) with an example of processing only one signal that paid off the indicator! MT4 version is here It will provide pretty accurate trading signals and tell you when it's best to open a trade and close it. Most traders improve their trading results during the first trading week with the help of
Commençons par être honnêtes. Aucun indicateur ne vous rendra rentable à lui seul. Si quelqu’un vous dit le contraire, il vous vend un rêve. Tout indicateur qui affiche des flèches parfaites d’achat/vente peut être rendu impeccable — il suffit de zoomer sur la bonne partie de l’historique et de capturer uniquement les trades gagnants. Nous ne faisons pas cela.  SMC Intraday Formula est un outil. Il lit la structure du marché pour vous, identifie les zones de prix à la probabilité la plus élevée
Présentation       Quantum Breakout PRO   , l'indicateur révolutionnaire MQL5 qui transforme la façon dont vous négociez les zones d'évasion ! Développé par une équipe de traders expérimentés avec une expérience commerciale de plus de 13 ans,       Évasion quantique PRO       est conçu pour propulser votre parcours commercial vers de nouveaux sommets grâce à sa stratégie de zone de discussion innovante et dynamique. Quantum Breakout Indicator vous donnera des flèches de signalisation sur les z
Voyez quelle strategie fonctionne reellement sur votre symbole - avant de risquer de l'argent reel. Power Bar detecte les barres de prix extremes sur n'importe quel symbole et n'importe quel timeframe, puis backteste instantanement 3 strategies de trading differentes pour que vous puissiez comparer les taux de reussite, les facteurs de profit et les P&L cote a cote. Le tout dans un seul panneau interactif. Pas de suppositions. Pas de suroptimisation. Juste des donnees. Qu'est-ce qui rend Power
Btmm state engine pro
Garry James Goodchild
5 (4)
BTMM State Engine Pro is a MetaTrader 5 indicator for traders who use the Beat The Market Maker approach: Asian session context, kill zone timing, level progression, peak formation detection, and a multi-pair scanner from a single chart. It combines cycle state logic with a built-in scanner dashboard so you do not need the same tool on many charts at once. What it does Draws the Asian session range; session times can follow broker server offset or be set in inputs. Tracks level progression (L
OmniSync Projection
Antonio-alin Teculescu
5 (1)
Chronos Fractal Engine is an innovative price projection indicator for MetaTrader 5, designed to transform your technical analysis by intelligently identifying and projecting historical price patterns. Built upon an advanced correlation algorithm and the fractal principles of the market, this powerful tool visualizes potential future price movements, giving you a unique edge in your trading decisions. What is Chronos Fractal Engine? At its core, the Chronos Fractal Engine employs a sophisticat
FX Power MT5 NG
Daniel Stein
5 (31)
FX Power : Analysez la force des devises pour des décisions de trading plus intelligentes Aperçu FX Power est l'outil essentiel pour comprendre la force réelle des principales devises et de l'or, quelles que soient les conditions du marché. En identifiant les devises fortes à acheter et les faibles à vendre, FX Power simplifie vos décisions de trading et révèle des opportunités à forte probabilité. Que vous suiviez les tendances ou anticipiez les retournements à l'aide de valeurs extrêmes de D
Crystal Heikin Ashi Signals
Muhammad Jawad Shabir
5 (2)
Crystal Heikin Ashi Signals - Professional Trend & Signal Detection Indicator Advanced Heikin Ashi Visualization with Intelligent Signal System for Manual & Automated Trading Final Price: $149 ---------> Price goes up $10 after every 10 sales . Limited slots available — act fast . Overview Crystal Heikin Ashi Signals is a professional-grade MetaTrader 5 indicator that combines pure Heikin Ashi candle visualization with an advanced momentum-shift detection system. Designed for both manual traders
Berma Bands
Muhammad Elbermawi
5 (8)
L'indicateur Berma Bands (BB) est un outil précieux pour les traders qui cherchent à identifier et à capitaliser sur les tendances du marché. En analysant la relation entre le prix et les BB, les traders peuvent déterminer si un marché est dans une phase de tendance ou de range. Visitez le [ Berma Home Blog ] pour en savoir plus. Les bandes de Berma sont composées de trois lignes distinctes : la bande de Berma supérieure, la bande de Berma moyenne et la bande de Berma inférieure. Ces lignes sont
Gartley Hunter Multi
Siarhei Vashchylka
5 (11)
Gartley Hunter Multi - An indicator for searching for harmonic patterns simultaneously on dozens of trading instruments and on all possible timeframes. Manual (Be sure to read before purchasing) | Version for MT4 Advantages 1. Patterns: Gartley, Butterfly, Shark, Crab. Bat, Alternate Bat, Deep Crab, Cypher 2. Simultaneous search for patterns on dozens of trading instruments and on all possible timeframes 3. Search for patterns of all possible sizes. From the smallest to the largest 4. All fou
FX Levels MT5
Daniel Stein
5 (13)
FX Levels : Des zones de Support et Résistance d’une Précision Exceptionnelle pour Tous les Marchés Présentation Rapide Vous recherchez un moyen fiable pour déterminer des niveaux de support et résistance dans n’importe quel marché—paires de devises, indices, actions ou matières premières ? FX Levels associe la méthode traditionnelle « Lighthouse » à une approche dynamique de pointe, offrant une précision quasi universelle. Grâce à notre expérience réelle avec des brokers et à des mises à jour
Market Structure Order Block Dashboard MT5 est un indicateur MT5 conçu pour les traders qui veulent lire la structure de marché et les principales zones de réaction du prix directement sur le graphique. Il combine BOS, ChoCH, Order Blocks, Fair Value Gaps (FVG), Liquidité, Kill Zones, Volume Profile, et un dashboard compact pour une analyse rapide. Cet indicateur s'adresse aux traders qui utilisent la structure de marché, les concepts ICT et Smart Money comme cadre de décision. Il peut aider à r
IX Power MT5
Daniel Stein
4.92 (13)
IX Power : Découvrez des insights de marché pour les indices, matières premières, cryptomonnaies et forex Vue d’ensemble IX Power est un outil polyvalent conçu pour analyser la force des indices, matières premières, cryptomonnaies et symboles forex. Tandis que FX Power offre une précision maximale pour les paires de devises en utilisant toutes les données disponibles, IX Power se concentre exclusivement sur les données du symbole sous-jacent. Cela fait de IX Power un excellent choix pour les m
Meridian Pro
Ottaviano De Cicco
5 (1)
Meridian Pro: Professional Multi-Timeframe Trend Matrix for MT5 Overview Meridian Pro is a multi-timeframe trend matrix by Merkava Labs that compresses directional state, strength, momentum condition and matrix agreement into one compact panel. One adaptive engine, applied consistently from M1 to W1. No per-symbol tuning. No indicator stacking. One structured readout across every asset and every timeframe. Launch Offer — Get Meridian Pro for USD 99 (introductory). Regular price: USD 149. 1. Why
Plus de l'auteur
The indicator identifies when a divergence occurs between price and an indicator or oscillator. It identifies both regular and hidden divergences. Combined with your own rules and techniques, this indicator will allow you to create (or enhance) your own powerful system. For higher probability setups I can recommend you to use my Supply Demand indicator and trade only if the divergence occurs inside a zone. Supply zone for bearish div and demand zone for bullish div. The optimal scenario is if it
FREE
Cet indicateur dessine des zones d'offre et de demande sur le graphique. Associé à vos propres règles et techniques, cet indicateur vous permettra de créer (ou d'améliorer) votre propre système puissant. Veuillez également consulter la   version payante   qui offre bien plus. Ma recommandation est de rechercher des opportunités de trading où le premier test de zone se produit après au moins 25 barres. Caractéristiques Les zones ont 3 couleurs (réglables par entrée). Couleur foncée pour la zone n
FREE
Cet indicateur de tableau de bord de divergence multi périodes et multi symboles envoie une alerte lorsqu'une ou deux divergences différentes ont été identifiées sur plusieurs périodes et non sur des divergences uniques. Il peut être utilisé avec toutes les plages horaires de M1 à MN. Un maximum de 9 périodes peuvent être affichées dans le tableau de bord en même temps. Il est possible d'activer le filtre de tendance de la moyenne mobile, du RSI ou des bandes de Bollinger pour filtrer uniquement
Cet indicateur à plusieurs périodes et à plusieurs symboles identifie les formations haut/bas doubles ou triples ou une cassure de décolleté suivante (haut/bas confirmé). Il offre des filtres RSI, pin bar, engloutissant, pince à épiler, étoile du matin/soir ainsi que des options de filtre de divergence qui permettent de filtrer uniquement les configurations les plus fortes.       L'indicateur peut également être utilisé en mode graphique unique. Veuillez en savoir plus sur cette option dans le p
I recommend you to read the   product's blog  (manual) from start to end so that it is clear from the beginning what the indicactor offers. This multi time frame and multi symbol indicator can identify the following 5 crosses: when a fast moving average crosses a slow moving average line. when price has reached a single moving average (closed above/below or just bounced). when a triple moving average formation has appeared (all 3 MA:s in consecutive alignment) when the MACD main line crosses th
Cet indicateur de zone d'offre et de demande dessine les zones sur le graphique et envoie des alertes lorsque le prix a atteint ou cassé une zone. Il est également possible de l'utiliser pour être alerté des doubles hauts/bas réguliers au lieu des zones. Il est possible d'utiliser des filtres RSI, de volume et de divergence pour filtrer uniquement les configurations les plus fortes. Combiné avec vos propres règles et techniques, cet indicateur vous permettra de créer (ou d'améliorer) votre propr
This multi time frame and multi symbol indicator scans for pin bars. Combined with your own rules and techniques, this indicator will allow you to create (or enhance) your own powerful system. Features Can monitor all symbols visible in your Market Watch window at the same time. Apply the indicator to just one chart and instantly monitor the entire market. Can monitors every time frame, from M1 to MN, and sends you a real-time alert when a pin bar is identified. All Metatrader native alert types
Cet indicateur reconnaît un type spécial de formation de barre intérieure qui est formée d'une grande bougie principale suivie de 4 bougies plus petites (veuillez consulter l'explication de la stratégie ci-dessous). Caractéristiques Trace les lignes d'arrêt d'achat/vente sur le graphique ainsi que les niveaux de profit et d'arrêt de perte. Les niveaux TP/SL sont basés sur l'indicateur Average True Range (ATR). Les couleurs des objets sont modifiables. Vous envoie une alerte en temps réel lorsqu'
Cet indicateur dessine des zones d'offre et de demande sur le graphique. Associé à vos propres règles et techniques, cet indicateur vous permettra de créer (ou d'améliorer) votre propre système puissant. Veuillez également consulter la   version payante   qui offre bien plus. Ma recommandation est de rechercher des opportunités de trading où le premier test de zone se produit après au moins 25 barres. Caractéristiques Les zones ont 3 couleurs (réglables par entrée). Couleur foncée pour la zone n
FREE
This indicator can send alerts when a Heiken Ashi Smoothed color change occurs. Combined with your own rules and techniques, this indicator will allow you to create (or enhance) your own powerful system. Features Can send all types of alerts. Option to delay the alert one or more bars in order to confirm the color (trend) change. Input parameters Candle shift for alert: Default is 1. Setting it to 0 will alert you on color change on the current candle. This should be regarded as a pending (uncon
FREE
The indicator identifies when a divergence occurs between price and an indicator or oscillator. It identifies bullish and bearish hidden or regular (classical) divergences. Combined with your own rules and techniques, this indicator will allow you to create (or enhance) your own powerful system. For higher probability setups I can recommend you to use my  Supply Demand indicator  and trade only if the divergence occurs inside a zone. Supply zone for bearish div and demand zone for bullish div. T
FREE
Features This is an indicator that recognizes a special type of Inside Bar formation which is formed by a Master candle followed by 4 smaller candles (please see the strategy explanation below). Plots buy/sell stop lines on the chart as well as well as take profit and stop loss levels. The TP/SL levels are based on the Average True Range (ATR) indicator. Object colors are changeable. Sends you a real-time alert when a Master candle formation is identified - sound / pop-up / email / push notifica
Cet indicateur de tableau de bord d'offre et de demande à plusieurs périodes et à plusieurs symboles envoie des alertes lorsque le prix a atteint une zone d'offre/demande. Il est également possible de l'utiliser pour être alerté des doubles hauts/bas réguliers au lieu des zones. Il peut être utilisé avec toutes les plages horaires de M1 à MN.       Un maximum de 9 périodes peuvent être affichées dans le tableau de bord en même temps.   Il est possible d'utiliser des filtres RSI, divergence (MACD
L'indicateur identifie quand une divergence se produit entre le prix et un oscillateur/indicateur. Il identifie à la fois les divergences régulières et cachées. Il dispose d'une option de filtre RSI qui permet de filtrer uniquement les configurations les plus puissantes. L'indicateur offre également des options pour attendre une formation engloutissante, une cassure du canal Donchian ou que le prix croise une moyenne mobile   (voir capture d'écran #3)       pour confirmer la divergence avant de
This indicator can send alerts when a Heiken Ashi Smoothed color change occurs. Combined with your own rules and techniques, this indicator will allow you to create (or enhance) your own powerful system. Features Can send all types of alerts. Option to delay the alert one bar in order to confirm the color (trend) change. Input parameters Wait for candle close: 'true' or 'false'. Setting it to 'true' will delay the alert to the opening of the bar following the bar where the color change occurred.
FREE
Cet indicateur à plusieurs périodes et à plusieurs symboles recherche les barres à épingles, les étoiles du matin/soir, les engloutissements, les pinces à épiler, les frappes à trois lignes, les barres intérieures, les fanions et les triangles.   L'indicateur peut également être utilisé en mode graphique unique. Veuillez en savoir plus sur cette option dans le produit   blogue .   Combiné à vos propres règles et techniques, cet indicateur vous permettra de créer (ou d'améliorer) votre propre sys
I recommend you to read the   product's blog  (manual) from start to end so that   it is clear from the beginning what the indicator offers. This multi oscillator, multi time frame and multi symbol indicator identifies when a divergence occurs between price and an oscillator/indicator. It identifies both regular/classical (trend reversal) and hidden (trend continuation) divergences. It has moving average, RSI/Bollinger, ADX, pin bar and engulfing filter options which makes it possible to filter
Je vous recommande de lire le       le blog du produit   (manuel) du début à la fin afin qu'il soit clair dès le début ce que l'indicateur offre. Cet indicateur multi-périodes et multi-symboles recherche les barres de pin. Associé à vos propres règles et techniques, cet indicateur vous permettra de créer (ou d'améliorer) votre propre système puissant. Caractéristiques Vous pouvez surveiller simultanément tous les symboles visibles dans votre fenêtre Market Watch. Appliquez l'indicateur à un seu
I  recommend you to read the   product's blog  (manual) from start to end so that it is clear from the beginning what the indicator offers. This multi time frame and multi symbol indicator scans for engulfing and tweezer formations. The indicator can also be used in single chart mode. Combined with your own rules and techniques, this indicator will allow you to create (or enhance) your own powerful system. Features Can monitor all symbols visible in your Market Watch window at the same time. Ap
This multi time frame and multi symbol indicator identifies high-probability breakout patterns. It does this by identifying strong, symmetrical pennants and triangles. This pattern DOES NOT appear very often on higher time frames. But when it does, it is a very high-probability setup. The indicator also includes an Inside bars scanner. It can for example be used to detect a special type of Inside bars formation which is formed by a Master candle (MC) followed by 4 inside candles (please see the
This multi time frame and multi symbol indicator scans for Pin bars, Morning/Evening stars, Engulfings, Tweezers, Three line strikes, Inside bars and Pennants and Triangles. The indicator can also be used in single chart mode. Please read more about this option in the product's blog . Combined with your own rules and techniques, this indicator will allow you to create (or enhance) your own powerful system. Features Can monitor all symbols visible in your Market Watch window at the same time. App
I  recommend you to read the   product's blog  (manual) from start to end so that it is clear from the beginning what the indicator offers. This multi symbol and multi time frame indicator scans for the following candlestick patterns (please see screenshot for explanation of the patterns): Three white soldiers (reversal>continuation pattern) Three black crows (reversal>continuation pattern) Bullish and bearish Three line strike (reversal pattern) The patterns do not appear very often on higher
Cet indicateur multi-temps et multi-symboles permet d'identifier les 5 croix suivantes : lorsqu'une moyenne mobile rapide croise une ligne moyenne mobile lente. lorsque le prix a atteint une moyenne mobile unique (fermé au-dessus/au-dessous ou rebondi). lorsqu'une formation de moyenne mobile triple est apparue (tous les 3 MA:s en alignement consécutif). lorsque la ligne principale MACD croise la ligne de signal. lorsque la ligne de signal croise la ligne MACD zéro (0). Combiné à vos propres règl
L'indicateur identifie lorsqu'une divergence se produit entre le prix et un oscillateur/indicateur. Il identifie à la fois les divergences haussières et baissières. Il dispose d'une option de filtre RSI qui permet de filtrer uniquement les configurations les plus fortes. L'indicateur offre également des options pour attendre une cassure du canal Donchian ou que le prix croise une moyenne mobile (voir capture d'écran #3) pour confirmer la divergence avant de signaler l'opportunité commerciale. Co
Cet indicateur à plusieurs périodes et à plusieurs symboles identifie les formations haut/bas doubles ou triples ou une cassure de décolleté suivante (haut/bas confirmé). Il offre des filtres RSI, pin bar, engloutissant, pince à épiler, étoile du matin/soir ainsi que des options de filtre de divergence MACD, Awesome (AO) ou RSI qui permettent de filtrer uniquement les configurations les plus fortes.       L'indicateur peut également être utilisé en mode graphique unique. Veuillez en savoir plus
This multi indicator/oscillator (hereafter indicator), multi time frame and multi symbol indicator identifies when a divergence occurs between price and one, two or three indicators. It identifies both regular/classical (trend reversal) and hidden (trend continuation) divergences. It has RSI and MA trend filter options which makes it possible to filter out only the strongest setups. Combined with your own rules and techniques, this indicator will allow you to create (or enhance) your own powerfu
Cet indicateur multi-temps et multi-symboles identifie le moment où la ligne de signal stochastique croise la ligne principale stochastique. En prime, il peut également rechercher les bandes de Bollinger et les croisements de surachat/survente RSI. Combiné à vos propres règles et techniques, cet indicateur vous permettra de créer (ou d'améliorer) votre propre système puissant. Caractéristiques Peut surveiller tous les symboles visibles dans votre fenêtre Market Watch en même temps. Appliquez l'i
Averaging down EA
Jan Flodin
5 (1)
This cost averaging Expert advisor (EA) places additional trades in the same direction as the original (manually opened) order when the price goes against you. It can be used as a grid system or as pure martingale system (exponential increasing of lot size) or smoothed martingale (for instance linear increasing of the lot size). Due to the risk involved, this EA is more suitable for intermediate to advanced traders who are well aware of how to handle risk management and trading an already profit
I recommend you to read the   product's blog  (manual) from start to end so that it is clear from the beginning what the indicactor offers. This multi time frame and multi symbol trend indicator sends an alert when a strong trend or trend reversal has been identified. It can do so by selecting to build up the dashboard using Moving average (single or double ( both MA:s aligned and price above/below both ) ), RSI, Bollinger bands, ADX, Composite index, Parabolic SAR, Awesome (AO), MACD (signal l
Divergence dashboard
Jan Flodin
4.64 (11)
I recommend you to read the   product's blog  (manual) from start to end so that it is clear from the beginning what the indicactor offers. This multi time frame and multi symbol divergence dashboard indicator sends an alert when one or two different divergences have been identified. It can be used with all time frames from M1 to MN. It is possible to enable moving average or RSI trend filter to filter out only the strongest setups. It should be combined with your own confirmation rules, techni
Filtrer:
Aucun avis
Répondre à l'avis