FX Secretary

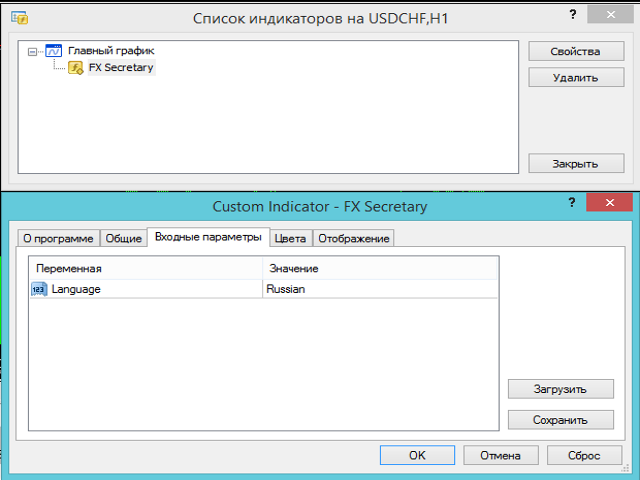
The FX Secretary indicator is a mini assistant for MT-4. His functional duties include - notifying the trader about closing deals with profit or at a loss. In the settings there is only one parameter in which you can change the language of the voice message. So far, the indicator speaks only two languages. In the future, it is possible to expand the functionality with an increase in languages and a set of words. Use for health!
Produits recommandés
CycleTraderPro CycleWave Indicator is 9 indicators in 1. It uses the CycleTraderPro Indicators and Patterns to identify Cycles and more in real time.  The 9 parts of CycleWave: Plots Cycle Bands and confirm Cycle High / Lows in real time after each successful cycle high or low. Plots Cycle Wave Price Windows above and below each bar using a modified % range of the previous bar. Automatically plots the Fibonacci Retracement from cycle low and highs after each cycle. Automatically plots Gann Fan
Virtual Collider Manual   is a trading assistant with a built-in panel for manual trading. It automatically moves a position opened by a trader in profit using innovative adaptive grid algorithm of averaging and adaptive pyramiding Know-how of the grid algorithm of averaging and pyramiding of the   Virtual Collider Manual   trading robot is based on fully automatic adaptation of all characteristics of dynamically build order grid and pyramid with actual price movement with no need for adjusting
Short Description: FTMO Protector PRO MT4 is an EA designed to protect your funded account by managing risk and ensuring compliance with the Prop Firm's trading rules. This EA automatically monitors equity levels, closes trades when profit targets or drawdown limits are reached, and provides a visual display of key account metrics. EA w orks with all different Prop Firm service providers. Overview: FTMO Protector PRO MT4 is an Drawdown Safeguard Expert Advisor meticulously crafted for traders
Trade with Gann on your side!! MASTER CIRCLE 360 CIRCLE CHART, originally created by Gann admitted that this is “The Mother of all charts”. It is one of the last studies that this great trader left for us. The numeric tab le is apparently quite simple like all the tables and is based on square numbers, the SQUARE OF 12 and is by evolution, one of the most important square numbers. Here we can find CYCLE, PRICE AND TIME thanks to angles and grades, to show past and future support and resistance.
EZT Trade History This is a great tool to analyze past trades or follow current ongoing trades, especially when you using an EA to manage your transactions. You will see the exact candle where the trade was opened and closed. Collapsible floating panel on the chart, free to move anywhere with your mouse. When you using multiple EA’s with different magic numbers, you have 5 options to separate those trades, so you will know which EA opened specific transactions. You can set the day limits how fa
This indicator is a must have tool that scans the active chart for candlestick patterns. It labels each bar according the candlestick pattern(s) that it finds enabling you to more easily analyze price action and be more informed about your trading decision. There are 103 common and uncommon possible patterns plus 6 new patterns based on research that the indicator can identify. If a candlestick(s) meets the requirements for multiple patterns, the bar will be labeled with up to 4 patterns names f
Commodity Channel Index Message is an indicator for the MetaTrader 4 trading platform. Unlike the original indicator, this three in one version has a system of alerts that inform on market situation changes. It consists of the following signals: when the Main line crosses the levels of extreme zones and 50% level; when the Main line crosses the Trend line in the indicator window; Divergence on the last bar. Values of the middle and extreme levels and divergence zones are customizable. Parameter
Super
Mati Maello
This indicator super indicator.Indicator displays trend movement. Indicator calculates automatically bars Features FiltPer - displays indicator period. Multiplier - displays indicator multiplier. How to understand the status: If the indicator bar is higher , trend is up. If the indicator bar is lower , trend is down. IIIIIIIIIIIIIIIIIIIIIIIIIIIIIIIIIIIIIIIIIIIIIIIIIIIIIIIIIIIIIIIIIIIIII
For this set of indicators 1. General information     - Calculates with high performance mathematical algorithms.     - Calculated from the price of candles     - The entry point of this order is filtered by the train EMA and the oscillator.     - Calculate the integrity of the candle 2. How does it work?     - You can see two types of order entry points: the notification on the monitor and the arrow.     - You can trust 75-95 percent of this entry point. 3. Settings     - A complete candle i
Reversal Pattern AI
Stanislav Konin
5 (1)
Reversal Pattern AI is a groundbreaking advancement in indicator development, combining artificial intelligence algorithms, multi-level market analysis, and classical technical analysis methods. It not only detects reversal patterns but also evaluates market inefficiencies, generating highly accurate trading signals.Thanks to its hybrid model, which utilizes price action analysis, volume, volatility, VWAP, and Volume AVG %, the indicator easily adapts to any market conditions. Reversal Pattern A
The Th3Eng PipFinite indicator is based on a very excellent analysis of the right trend direction with perfect custom algorithms. It show the true direction and the best point to start trading. With StopLoss point and Three Take Profit points. Also it show the right pivot of the price and small points to order to replace the dynamic support and resistance channel, Which surrounds the price. And Finally it draws a very helpful Box on the left side on the chart includes (take profits and Stop loss
Trendiness Index
Libertas LLC
5 (3)
"The trend is your friend" is one of the best known sayings in investing, because capturing large trendy price movements can be extremely profitable. However, trading with the trend is often easier said than done, because many indicators are based on price reversals not trends. These aren't very effective at identifying trendy periods, or predicting whether trends will continue. We developed the Trendiness Index to help address this problem by indicating the strength and direction of price trend
The Vortex Indicator was inspired by the work of an Austrian inventor, Viktor Schauberger, who studied the flow of water in rivers and turbines. Etienne Botes and Douglas Siepman developed the idea that movements and flows within financial markets are similar to the vortex motions found in water. The Vortex Indicator was also partly inspired by J. Welles Wilder's concept of directional movement, which assumes the relationship between price bars gives clues as to the direction of a market. This i
This is an arrow indicator without a future function,developed based on the most advanced profit trading algorithms.It has the most innovative and advanced dual trend analysis module, as well as the latest and highly effective market trend prediction algorithm.Trends are your friends, and following larger trends can earn the maximum profit in foreign exchange. This indicator helps traders identify current trends and track them. Someone once made a profit of 10 times in a week by relying on it.No
Indicator function This index buys and sells according to the color, using time is one hour,Please run the test on a 30-minute cycle It is best to use 1H for testing   About update questions In order to be more suitable for market fluctuations, the company regularly updates the indicators   Product cycle and trading time applicable to indicators Applicable mainstream currency pair EUR/USD GBP/USD NZD/USD AUD/USD USD/JPY USD/CAD USD/CHF Applicable mainstream cross currency pair EUR/JPY EUR/GBP E
Diamond Pattern
Ugur Oezcan
5 (1)
The diamond top and bottom are reversal patterns. It represents a rally to a new high with a drop to a support level followed by a rally to make a new high and a quick decline, breaking the support level to make a higher low. The bounce from the higher low is then followed by a rally, but making a lower high instead. Once this behavior is identified, prices then break the trend line connecting the first and second lows and start to decline further. You can find MT5 version hier Indicator shows
The analyzer panel allows traders to add the pending order grid (Buy Limit, Sell Limit, Buy Stop, Sell Stop) quickly and efficiently.   Parameters stop mode - select stop setting mode every order - stop levels are set for each order separately position as - common stop levels for all orders order type - select pending order type Buy Limit Sell Limit Buy Stop Sell Stop magic - set a magic number for open orders if necessary. If position as mode is enabled, stop levels are corrected for all orders
Line Magnit
Aleksey Trenin
The LineMagnit Indicator for MT4 is a highly precise tool that builds support and resistance levels which magnetically attract prices. This feature allows traders to easily determine the most probable entry and exit points in the market, as well as identify the market's directional forces, as levels are based on capital inflows into the instrument. Equipped with an intuitively understandable graphical interface, the LineMagnit Indicator enables users to quickly locate and analyze support and res
Margin Call Shield – Defend Your Margin on Your Terms Margin Call Shield   is a tool for MetaTrader 4 traders who want to decide for themselves which open positions are closed during margin call situations before the platform does so automatically based on its internal rules. By default, the broker or platform decides which positions to close, often using undisclosed algorithms. Margin Call Shield lets you set this order according to your own strategy. Why Was Margin Call Shield Created? In a  
For sure, this indicator has become very popular amongst traders. Through coding this indicator will give you the most accurate levels possible for your trading analysis. We have also added in the ability for you to receive alerts when the price breaks above or below a Support or Resistance lines! HOW TO USE The red rectangles represent your resistance/supply zone. The green rectangles represent your support/demand zone.  BONUS FEATURES We coded this indicator with the ability to switch between
The indicator looks for buying and selling zones, where a deal can be opened with a minimal stop loss and a better Risk Reward Ratio. The indicator is based on qualitative search of the Double top/Double bottom pattern. Indicator operation principle Looks for local tops/bottoms which can potentially become a Reversal zone It waits for an impulse movement that would exceed the Reversal zone and draws a red/blue wide rectangle Within the Reversal zone, it looks for the strongest area of the zone
MR BEAST INDICATOR ATR SUPLIED AND DEMAND ¡Descubre la herramienta definitiva para la toma de decisiones financieras con nuestro asesor experto! Diseñado para operar en la vanguardia de los mercados globales, este asesor se destaca por su capacidad única para analizar tendencias en tiempo real utilizando el indicador Average True Range (ATR) y el equilibrio de oferta y demanda. Al aprovechar el ATR, nuestro asesor experto evalúa la volatilidad actual del mercado, proporcionándote una visión clar
PABT Pattern Indicator - it's classical system one of the signal patterns. Indicator logic - the Hi & Lo of the bar is fully within the range of the preceding bar, look to trade them as pullback in trend. In the way if indicator found PABT pattern it's drawing two lines and arrow what showing trend way.  - First line - it's entry point and drawing at: 1. On the high of signal bar or on middle of the signal bar (depending from indicator mode) for buy; 2. On the low of signal bar or on middle of t
This indicator depends on High and Low price of Currency in last Week and then i made some secret equations to draw 10 lines. Features: You will know what exactly price you should enter the market . You will know when to be out of market. You will know you what should you do in market: Buy Sell Take profit and there are 3 levels to take your profit Support Resistance Risk to buy Risk to Sell Signal Types and Frame used: You can use this indicator just on H4 frame and you have to download the h
"Impulses and Corrections 4" is created to help traders navigate the market situation. The indicator shows multi-time frame upward and downward "Impulses" of price movements. These impulses are the basis for determining the "Base" , which is composed of zones of corrections of price movements, as well as "Potential" zones for possible scenarios of price movement. Up and down impulses are determined based on a modified formula of Bill Williams' "Fractals" indicator. The last impulse is always "U
CrossPoint4
Denis Trubachev
CrossPoint4 is an indicator that helps novice traders. In addition to the standard "Crosshair" function (Ctrl + F), CrossPoint4 will show you how to set the StopLoss and TakeProfit levels correctly, taking into account the minimum allowable level, calculate the number of points between two points and convert this into the currency of the account, taking into account the expected lot of the transaction. Sometimes, when opening a deal, a novice trader completely forgets about the spread. After
Mirror
Stanislav Korotky
This indicator predicts rate changes based on the chart display principle. It uses the idea that the price fluctuations consist of "action" and "reaction" phases, and the "reaction" is comparable and similar to the "action", so mirroring can be used to predict it. The indicator has three parameters: predict - the number of bars for prediction (24 by default); depth - the number of past bars that will be used as mirror points; for all depth mirroring points an MA is calculated and drawn on the ch
RSI Speed mp
DMITRII GRIDASOV
Indicateur Crypto_Forex « RSI SPEED » pour MT4 : excellent outil prédictif, sans retouche. - Le calcul de cet indicateur est basé sur des équations physiques. Le RSI SPEED est la dérivée première du RSI lui-même. - Le RSI SPEED est idéal pour scalper les entrées dans la direction de la tendance principale. - Utilisez-le en combinaison avec un indicateur de tendance approprié, par exemple HTF MA (comme sur les images). - L'indicateur RSI SPEED indique la vitesse à laquelle le RSI change de dire
Candlestick Pattern Scanner is a multi-timeframe and multi-symbol dashboard and alert system that checks all timeframes and currency pairs for different candlestick patterns that are formed in them. Scanner is integrated with support and resistance zones so you can check the candlestick patterns in the most important areas of the chart to find breakout and reversal patterns in the price chart. Download demo version   (works on M30,D1,W1 timeframes and 20 symbols of Market Watch window) Read the
BreakEven Grid Utility for MT4 BreakEven Grid is a powerful utility for manual trade management on the MetaTrader 4 platform. It provides a convenient on-screen panel with buttons to help you manage your open positions with a single click.  Features: Set BE+Profit: Automatically sets Take Profit to breakeven + desired profit in pips or money. Close BUY/SELL: Instantly close all Buy or Sell orders for the current symbol. Close +$/-$/Old/New: Close only profitable, losing, oldest or newest tra
Les acheteurs de ce produit ont également acheté
Gann Made Easy
Oleg Rodin
4.83 (160)
Gann Made Easy est un système de trading Forex professionnel et facile à utiliser qui est basé sur les meilleurs principes de trading en utilisant la théorie de mr. WD Gann. L'indicateur fournit des signaux d'ACHAT et de VENTE précis, y compris les niveaux Stop Loss et Take Profit. Vous pouvez échanger même en déplacement en utilisant les notifications PUSH. VEUILLEZ ME CONTACTER APRÈS L'ACHAT POUR RECEVOIR GRATUITEMENT DES INSTRUCTIONS DE TRADING ET D'EXCELLENTS INDICATEURS SUPPLÉMENTAIRES! Vou
M1 Sniper
Oleg Rodin
5 (21)
M1 SNIPER est un système d'indicateurs de trading facile à utiliser. Il s'agit d'un indicateur à flèche conçu pour l'unité de temps M1. Cet indicateur peut être utilisé seul pour le scalping sur l'unité de temps M1 ou intégré à votre système de trading existant. Bien que conçu spécifiquement pour le trading sur l'unité de temps M1, ce système peut également être utilisé avec d'autres unités de temps. Initialement, j'avais conçu cette méthode pour le trading du XAUUSD et du BTCUSD. Cependant, je
Scalper Inside PRO
Alexey Minkov
4.74 (69)
12% OFF EASTER SALE An exclusive indicator that utilizes an innovative algorithm to swiftly and accurately determine the market trend. The indicator automatically calculates opening, closing, and profit levels, providing detailed trading statistics. With these features, you can choose the most appropriate trading instrument for the current market conditions. Additionally, you can easily integrate your own arrow indicators into Scalper Inside Pro to quickly evaluate their statistics and profitabi
Ultimate Sniper Dashboard
Hispraise Chinedum Abraham
4.82 (22)
Prix réduit à 299 $ ! Les prix peuvent augmenter à l'avenir ! Lisez la description ci-dessous ! Meilleur système d'entrée pour le tableau de bord Ultimate Sniper : NIVEAUX DYNAMIQUES ULTIMES. (Veuillez consulter mes produits) L'Ultimate Sniper Dashboard fonctionne UNIQUEMENT sur les marchés en direct en raison des limites des tests multidevises de MT4. Voici l'Ultimate-Sniper Dashboard ! Notre meilleur produit qui contient à la fois HA-Sniper, MA-Sniper et de nombreux modes spéciaux. L'Ultima
Market Makers
Mohamed Hassan
5 (3)
After purchase, contact me privately to receive 1 month of free testing with EA Forex Proton! This advanced MT4 trading robot automatically executes signals from any MT4 indicator, including Market Makers. The latest version also includes AI integration, allowing each trade signal to be analyzed using Artificial Intelligence. Live Signal with EA Forex Proton: Click here Market Makers is a powerful price action trading system designed to identify high-probability Buy and Sell opportunities based
Trend Screener
STE S.S.COMPANY
4.79 (95)
Indicateur de tendance, solution unique révolutionnaire pour le trading et le filtrage des tendances avec toutes les fonctionnalités de tendance importantes intégrées dans un seul outil ! Il s'agit d'un indicateur multi-période et multi-devises 100 % non repeint qui peut être utilisé sur tous les symboles/instruments : forex, matières premières, crypto-monnaies, indices et actions. OFFRE À DURÉE LIMITÉE : L'indicateur Support and Resistance Screener est disponible pour seulement 50 $ et à vie. (
Atomic Analyst
Issam Kassas
5 (5)
Tout d'abord, il convient de souligner que cet indicateur de trading n'est ni repainting, ni redrawing et ne présente aucun délai, ce qui le rend idéal à la fois pour le trading manuel et automatisé. Manuel de l'utilisateur : réglages, entrées et stratégie. L'Analyste Atomique est un indicateur d'action sur les prix PA qui utilise la force et le momentum du prix pour trouver un meilleur avantage sur le marché. Équipé de filtres avancés qui aident à éliminer les bruits et les faux signaux, et à
Super Signal – Skyblade Edition Système de signaux de tendance professionnel sans repaint / sans latence, avec un taux de réussite exceptionnel | Pour MT4 / MT5 Il fonctionne mieux sur des unités de temps inférieures, comme 1 minute, 5 minutes et 15 minutes. Caractéristiques principales : Super Signal – Skyblade Edition est un système de signaux intelligent conçu spécifiquement pour le trading de tendance. Il utilise une logique de filtrage multicouche pour détecter uniquement les mouvements d
Trend indicator AI
Ramil Minniakhmetov
4.53 (83)
L'indicateur Trend Ai est un excellent outil qui améliorera l'analyse du marché d'un trader en combinant l'identification des tendances avec des points d'entrée exploitables et des alertes d'inversion. Cet indicateur permet aux utilisateurs de naviguer dans les complexités du marché forex avec confiance et précision Au-delà des signaux primaires, l'indicateur Trend Ai identifie les points d'entrée secondaires qui surviennent lors des retraits ou des retracements, permettant aux traders de capit
Nous vous présentons ON Trade Waves Patterns Harmonic Elliot Wolfe, un indicateur avancé conçu pour détecter divers types de schémas sur le marché à l'aide de méthodes manuelles et automatiques. Voici comment il fonctionne : Schémas Harmoniques : Cet indicateur peut identifier les schémas harmoniques qui apparaissent sur votre graphique. Ces schémas sont essentiels pour les traders qui pratiquent la théorie du trading harmonique, telle qu'elle est décrite dans le livre de Scott Carney "Harmonic
L'indicateur « Dynamic Scalper System » est conçu pour la méthode de scalping, permettant de trader au sein des vagues de tendance. Testé sur les principales paires de devises et l'or, il est compatible avec d'autres instruments de trading. Fournit des signaux pour l'ouverture de positions à court terme le long de la tendance, avec un support supplémentaire pour les fluctuations de prix. Principe de l'indicateur : De grandes flèches déterminent la direction de la tendance. Un algorithme de gén
Le système PRO Renko est un système de trading très précis spécialement conçu pour le trading de graphiques RENKO. Il s'agit d'un système universel qui peut être appliqué à divers instruments de négociation. Le système neutralise efficacement ce qu'on appelle le bruit du marché en vous donnant accès à des signaux d'inversion précis. L'indicateur est très facile à utiliser et n'a qu'un seul paramètre responsable de la génération du signal. Vous pouvez facilement adapter l'outil à n'importe que
TPSpro RFI Levels
Roman Podpora
4.86 (28)
INSTRUCTIONS RUS  /  INSTRUCTIONS   ENG  /  Version MT5 Fonctions principales : Affiche les zones actives des vendeurs et des acheteurs ! L'indicateur affiche tous les niveaux/zones de première impulsion corrects pour les achats et les ventes. Lorsque ces niveaux/zones sont activés, là où commence la recherche de points d'entrée, ils changent de couleur et se remplissent de certaines couleurs. Des flèches apparaissent également pour une perception plus intuitive de la situation. LOGIC AI - Affi
BTMM State Engine Pro is a MetaTrader 4 indicator for traders who use the Beat The Market Maker approach: Asian session context, kill zone timing, level progression, peak formation detection, and a multi-pair scanner from a single chart. It combines cycle state logic with a built-in scanner dashboard so you do not need the same tool on many charts at once. What it does Draws the Asian session range; session times can follow broker server offset or be set in inputs. Tracks level progression (L
Linear Trend Predictor - Un indicateur de tendance qui combine des points d'entrée et des lignes de support de direction. Fonctionne sur le principe de franchissement du canal des prix haut/bas. L'algorithme de l'indicateur filtre le bruit du marché, prend en compte la volatilité et la dynamique du marché. Capacités de l'indicateur  À l'aide de méthodes de lissage, il montre la tendance du marché et les points d'entrée pour l'ouverture d'ordres d'ACHAT ou de VENTE.  Convient pour déterminer l
ACTUELLEMENT 40% DE RÉDUCTION La meilleure solution pour tout débutant ou trader expert ! Cet indicateur est un outil de trading unique, de haute qualité et abordable car nous avons incorporé un certain nombre de caractéristiques exclusives et une nouvelle formule. Avec seulement UN graphique, vous pouvez lire la force de la devise pour 28 paires Forex ! Imaginez comment votre trading va s'améliorer parce que vous êtes capable de repérer le point de déclenchement exact d'une nouvelle tendance
Easy Breakout
Mohamed Hassan
4.71 (14)
After your purchase, feel free to contact me for more details on how to receive a bonus indicator called VFI, which pairs perfectly with Easy Breakout for enhanced confluence!    Easy Breakout is a powerful price action trading system built on one of the most popular and widely trusted strategies among traders: the Breakout strategy ! This indicator delivers crystal-clear Buy and Sell signals based on breakouts from key support and resistance zones. Unlike typical breakout indicators, it levera
Volatility Trend System - un système de trading qui donne des signaux pour les entrées. Le système de volatilité donne des signaux linéaires et ponctuels dans le sens de la tendance, ainsi que des signaux pour en sortir, sans redessiner ni retarder. L'indicateur de tendance surveille la direction de la tendance à moyen terme, montre la direction et son changement. L'indicateur de signal est basé sur les changements de volatilité et montre les entrées sur le marché. L'indicateur est équipé de pl
Trend Lines PRO
Roman Podpora
5 (1)
TREND LINES PRO     Cet indicateur permet de comprendre les véritables changements de direction du marché. Il révèle les renversements de tendance et les points de retour des principaux acteurs. Tu vois     Lignes BOS     Détection des changements de tendance et des niveaux clés sur des unités de temps supérieures, sans paramètres complexes ni interférences inutiles. Les signaux restent affichés sur le graphique même après la fermeture de la bougie. VERSION MT 5    -     Révèle son potentiel max
GOLD Impulse with Alert
Bernhard Schweigert
4.67 (12)
Cet indicateur est une super combinaison de nos 2 produits Advanced Currency IMPULSE with ALERT  +   Currency Strength Exotics . Il fonctionne pour tous les cadres temporels et montre graphiquement l'impulsion de force ou de faiblesse pour les 8 principales devises plus un symbole ! Cet indicateur est spécialisé pour montrer l'accélération de la force des devises pour tout symbole comme l'or, les paires exotiques, les matières premières, les indices ou les contrats à terme. C'est le premier
Order Block Hunter
Noha Mohamed Fathy Younes Badr
5 (10)
Order block hunter indicator is the best indicator for  hunt the order blocks that area where there has been a large concentration of limit orders waiting to be executed Order blocks are identified on a chart by observing previous price action and looking for areas where the price experienced significant movement or sudden changes in direction .This indicator does that for you by using very complicated codes and helps you to take the best areas To buy and sell because it make marks at the best a
- Real price is 80$ - 40% Discount (It is 49$ now) Contact me for instruction, add group and any questions! - Non-repaint - I just sell my products in Elif Kaya profile, any other websites are stolen old versions, So no any new updates or support. - Lifetime update free Related product:   Bitcoin Expert Introduction The breakout and retest strategy is traded support and resistance levels. it involves price breaking through a previous level.  The break and retest strategy is designed to help tr
KT Gaussian Trend Filter MT4
KEENBASE SOFTWARE SOLUTIONS
Le KT Gaussian Trend Filter combine le filtrage gaussien avec le lissage par régression linéaire pour fournir une analyse de tendance claire et précise. Il génère des signaux d'achat et de vente faciles à suivre tout en mettant en évidence la direction à long terme du marché. Fonctionnalités Filtre gaussien entièrement personnalisable : Ajustez la longueur et les pôles pour affiner la précision du lissage et améliorer la lisibilité de la tendance. Amélioration par régression linéaire : Affine d
Special offer : ALL TOOLS , just $35 each! New tools   will be   $30   for the   first week   or the   first 3 purchases !  Trading Tools Channel on MQL5 : Join my MQL5 channel to update the latest news from me L'indicateur Volumetric Order Blocks Multi Timeframe est un outil puissant conçu pour les traders cherchant à obtenir des informations approfondies sur le comportement du marché en identifiant les zones clés de prix où les participants importants accumulent des ordres. Ces zones, connues
Advanced Supply Demand
Bernhard Schweigert
4.91 (299)
Offre spéciale : 40 % de réduction La solution idéale pour les traders débutants comme experts ! Cet indicateur est un outil de trading unique, performant et abordable grâce à l’intégration de nombreuses fonctionnalités exclusives et d’une nouvelle formule. Cette mise à jour vous permet d’afficher des zones sur deux unités de temps. Vous pourrez ainsi visualiser non seulement une unité de temps supérieure, mais aussi l’unité de temps du graphique, ainsi que l’unité de temps supérieure : des z
Route Lines Prices - est un indicateur conçu pour identifier les directions des prix. Son interface simple intègre plusieurs algorithmes de calcul du comportement des prix et de leur direction future. Ces algorithmes incluent le calcul de la volatilité et le lissage des prix en fonction des unités de temps utilisées. L'indicateur possède un unique paramètre permettant de modifier la valeur « Calculating price values ». La valeur par défaut de 1 assure un calcul automatique équilibré, utilisabl
Stratos Pali
Michela Russo
4.43 (7)
Stratos Pali Indicator   is a revolutionary tool designed to enhance your trading strategy by accurately identifying market trends. This sophisticated indicator uses a unique algorithm to generate a complete histogram, which records when the trend is Long or Short. When a trend reversal occurs, an arrow appears, indicating the new direction of the trend. Important Information Revealed Leave a review and contact me via mql5 message to receive My Top 5 set files for Stratos Pali at no cost! Dow
Actuellement 40% de réduction ! La meilleure solution pour tout débutant ou trader expert ! Ce logiciel de tableau de bord fonctionne sur 28 paires de devises. Il est basé sur 2 de nos principaux indicateurs (Advanced Currency Strength 28 et Advanced Currency Impulse). Il donne un excellent aperçu de l'ensemble du marché Forex. Il montre les valeurs de l'Advanced Currency Strength, la vitesse de mouvement des devises et les signaux pour 28 paires de devises dans tous les (9) délais. Imaginez
Daily Candle Predictor est un indicateur qui prédit le cours de clôture d'une bougie. L'indicateur est principalement destiné à être utilisé sur les graphiques D1. Cet indicateur convient à la fois au trading forex traditionnel et au trading d'options binaires. L'indicateur peut être utilisé comme un système de trading autonome, ou il peut servir de complément à votre système de trading existant. Cet indicateur analyse la bougie actuelle, calcule certains facteurs de force à l'intérieur du corps
Volumatic Fair Value Gaps   is a precision-engineered indicator for identifying, analyzing, and visualizing   Fair Value Gaps (FVGs)   backed by volume intelligence. This tool goes beyond standard FVG plotting by dissecting volume dynamics inside each gap using   lower-timeframe sampling , offering clear insight into whether bulls or bears dominate the imbalance. Designed for technical traders, this indicator overlays high-probability gaps only, visualizes   bullish vs. bearish volume compositio
Plus de l'auteur
Good old snake with various options. You can play directly on the chart. And you can play in a separate window. You can not play at all, but set her speed of movement and run it on the machine, the snake itself will chase and devour apples. You can turn on different sounds of eating apples, or you can completely turn off all sounds. You can set the maximum length of the snake, and you can also set the number of dice on the game board. In short - a lot of things are possible. Enjoy.. )
FREE
Mini Assistant is a small training tool in the strategy tester. A minimal set of buttons provides ease of use. There are no external parameters; they are simply not needed here. All you need is right on the screen. Before opening a position, in the special input windows, specify the required volume, as well as Stop Loss and Take Profit levels. To close a position, select it by ticket in the lower window. The program was written quickly, and also does not have a special uniqueness, so I post it i
FREE
The ZZ Snake indicator is a small entertainment utility and does not have any benefit for trading. Made on the indicator ZigZag, so the parameters will be easy to figure out. If you set it on a graph, you can see a serpent monster that moves across the screen, changing the dimensions of the head and torso in movement. Just connect it to the schedule and let yourself crawling. Careful, he can bite! ) P.S. For a more dynamic movement of the snake, it is recommended to run it in the strategy teste
FREE
Indicator Draw Line, is a utility for drawing in the chart trend lines, connecting together and following one after another. It will be especially useful for traders who use in their trading wave analysis. Above the graph are buttons for switching the basic settings: Calling the color bar, Turning the indicator on and off, Turning the sound on and off, Clearing the chart from the created objects. With the rest of the settings will not be difficult to understand. Use your health!
The Find Levels utility scans the range of prices and bars indicated by you on the chart, finds the levels most often related to High and Low prices and provides a full report. The color of the level line depends on the number of touches and changes in the program settings. The level is drawn in the event that if the shadow of the High or Low candle was at least two touches during the period specified in the parameters. The characteristics of the candle, namely, what should be its parameters for
WaveAnalyzer works on the basis of the ZagZag indicator. When a wave formation appears on the chart, which can be chosen from the list in the program settings, it informs the trader in the following ways: - Starts Alert. - Informs by voice. - Sends a letter. - Sends a push notification to a smartphone. - Makes a screenshot, which can be viewed in the MQL4 / Files folder. In the future we plan to expand the functionality of this indicator. Thus, by placing on the chart several indicators w
Candle Inside indicator - draws Japanese candlesticks of a higher timeframe on the chart. Now, after loading the indicator, it is possible to see what is happening inside each candle. In addition to the standard buttons for selecting the timeframe in the MT-4 terminal, additional buttons are added, when clicked, an older period is selected to display Japanese candles or zones. For example, if you select the standard period M1 and the period of the indicator M5, then the chart will display minute
Wave Slope - works on the basis of the ZigZag indicator and is designed to measure the slope of the current wave, in degrees. The sharper the angle of inclination, the stronger the trend. And on this you can build a trading system. In the settings, you can connect the ZigZag indicator, set the color and width of the slope line. And you can also turn on and off the sound signal, which is triggered in case of a change in the slope of the wave.
Signal AO is a simple informational utility. It gives a signal about crossing the zero mark by the Awesome Oscillator (AO) indicator. Signals will be received depending on the chart on which the utility is located. The settings are pretty simple: SYGNAL TYPE: ALERT - The signal gives alert. SOUND - Voice notification. ALERT_AND_SOUND - Alert together with voice notification. LANGUAGE: Select the language in which the Signal AO will communicate.
Filtrer:
Aucun avis
Répondre à l'avis