AlgoTrade Line Alerts

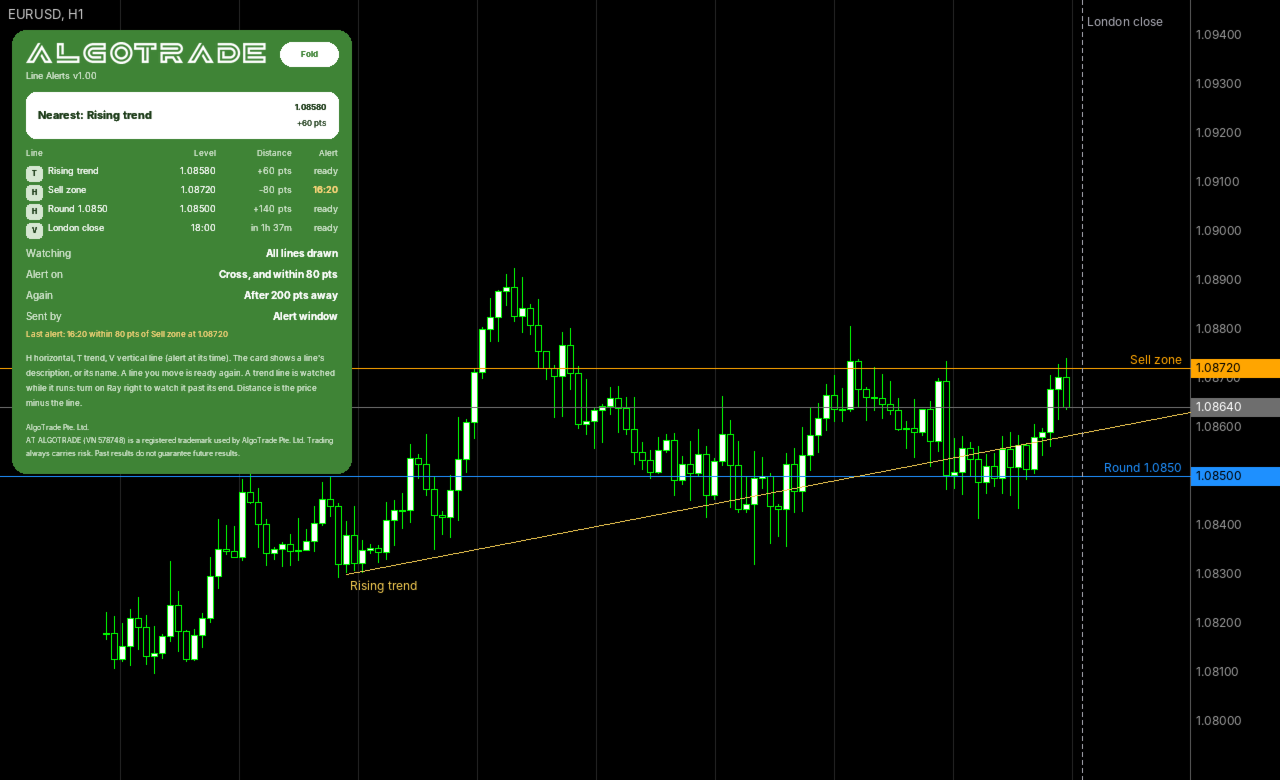
AlgoTrade Line Alerts monitors the lines drawn on the chart and alerts you when the price crosses a line or when a vertical line's time is reached. A card lists each line with its level, distance from the price, and alert status. It reads data only and does not modify your lines.

What it does

  • Works with horizontal, trend, and vertical lines. Draw them as usual from Insert > Objects > Lines; each new line is watched immediately.
  • Alerts when the chart price crosses or touches a horizontal or trend line. Trend lines follow their slope, triggering at the line's value at that moment.
  • Provides an optional early alert when the price comes within a set number of points of a line.
  • Vertical lines act as time alarms, alerting when the server time reaches the line (for example, before a news release or a session close).
  • Each line alerts once until moved, or it can alert again after the price moves a set distance away.
  • Moving a line does not trigger an alert; moved lines are ready again.
  • Watch all lines or only those containing a specific word, such as "alert", in their description.
  • Alerts via an alert window with sound, with optional push notifications to your phone and email. Lines crossed by the same move are combined into one alert.
  • Displays a card showing the nearest line first, followed by each line's type, level, distance in points (or time left for vertical lines), and last alert time.

How to use

  • Attach the indicator to the chart and draw your lines. The card displays each line's description, or its name if no description exists.
  • To watch a trend line past its end, enable Ray right in the line properties.
  • Click "Fold" to show a single line, or "Show" to display the full card. The card corner can be changed in the inputs.

Inputs: lines watched, word in the description, horizontal, trend and vertical lines, near distance, distance to alert again, alert window, push notification, email, card corner.

Please read

  • This indicator reads data only and does not open, modify, or close trades.
  • For questions or feature requests, please post in the comments section on this page. Your reviews help us plan updates.

Made by AlgoTrade Pte. Ltd. Trading always carries risk. Past results do not guarantee future results.

Produits recommandés
Virtual Targets MT5
Hoang Van Dien
4.63 (8)
This indicator is very useful for day traders or short term traders. (MT5 version) No need to calculate the number of pips manually, just look at the chart and you will see the Virtual Take Profit / Virtual Stop Loss target line and evaluate whether the entry point is feasible to reach the intended target or not. Enter the intended   Take Profit / Stop Loss   pips for your trade. The indicator will display   Virtual Take Profit / Virtual Stop Loss   lines for you to easily see if the target is
FREE
Multi Currency Strength Dashboard Mini (FREE) – Currency Strength Meter for MetaTrader 5 Multi Currency Strength Dashboard Mini est un indicateur gratuit pour MetaTrader 5 qui affiche en temps réel la force relative des 8 devises majeures (USD, EUR, GBP, JPY, CHF, CAD, AUD, NZD) sous forme de tableau de bord clair et rapide à lire. Objectif : repérer en quelques secondes les devises fortes et faibles afin d'orienter votre watchlist (par exemple, sélectionner des paires où une devise forte fait f
FREE
AZ ATR indicator (with volume correlation bonus) Standard ATR indicator, you can enable ignoring abnormally large candles. It is possible to change the location of the displayed text in 4 corners of the chart. You can change the calculation period (days ago). Bonus - the indicator has a correlation with volumes. Can be enabled to display a possible priority at the current moment in the market. What do the values ​​mean: Positive correlation (0.3 - 1.0): 0.3-0.7 - moderate connection
FREE
A simple indicator that displays current profit/loss in both USD and as a percentage of capital. It also shows the spread and a countdown timer for the current candle. You can customize the display of profit/loss, spread, and the countdown timer by toggling them on or off. Additionally, you can adjust their position—for example, placing them in the corners of the screen or right next to the BID/ASK prices. I created this indicator for my own use and for my friends, so the display language is
FREE
This Mt5 Indicator Signals when there is two opposite direction bars engulfed by current bar.  has a recent Exponential Moving Average Cross and past bar was oversold/bought Expert Advisor Available in Comments  Free Version Here : https://www.mql5.com/en/market/product/110114?source=Site&nbsp ; Full Alerts for mt5 terminal , phone , email, print to file, print to journal  Buy Signal ( blue line ) Past ema cross ( set at 30 bars back ) Past bar rsi is oversold ( level 40  ) Engulfing bar closes
FREE
Market Time Pad
Vladislav Andruschenko
4.29 (7)
L'indicateur qui affiche l'heure actuelle sur les principaux marchés du monde. Il affiche également la session en cours. Très facile à utiliser. Il n'occupe pas beaucoup d'espace sur un graphique. Il peut être utilisé avec des Expert Advisors et d'autres panneaux, tels que   VirtualTradePad   . La version de style classique. Chers amis et utilisateurs de nos EA, veuillez ajouter vos notes dans la section   Avis. Toutes les mises à jour de notre logiciel forex sont   gratuites   ! Ceci est un u
FREE
RiskCockpit - conseiller de risque en temps réel pour comptes de prop-firm et comptes financés (FundedNext, FTMO, E8, The5ers, MyFundedFX) et comptes personnels/démo. C'est un INDICATEUR (un conseiller) : il affiche et propose ; il n'ouvre, ne modifie et ne ferme jamais un trade. LE PROBLÈME QU'IL RÉSOUT Un compte financé se perd rarement à cause d'une mauvaise stratégie - il se perd sur un seul clic d'inattention : un lot trop gros, un stop-loss oublié, un trade dans une fenêtre de news, une l
FREE
KF Market Structure — Smart Money Concepts Trend & Breakout Analyzer KF Market Structure is a clean, rule-based Smart Money Concepts (SMC) indicator for MetaTrader 5 that automatically detects and visualizes market structure: Swing Highs, Swing Lows, Break of Structure (BOS), and Change of Character (CHoCH). Built strictly for closed bar evaluation, it provides an objective structural baseline for Price Action traders and automated trading strategies without erratic signals. Whether you trade
FREE
The "Support Resistance Dynamic" indicator is a powerful technical analysis tool for the MetaTrader 5 platform, designed to automatically identify and plot dynamic Support and Resistance zones on price charts. This indicator helps traders easily recognize important price levels, potential reversal points, or breakout areas, thereby enabling more informed trading decisions. 2. Key Features Dynamic S/R Identification : Automatically identifies support and resistance zones based on an advanced Pivo
FREE
Expasion Limits
Danny Giovanni Romero Lozano
Expansion Limits  Expansion Limits is a powerful multi-timeframe indicator that automatically draws dynamic support, resistance, and expansion levels based on higher timeframe price action. How It Works The indicator takes the high and low from a selected higher timeframe (default H4) and calculates 11 strategic levels: HTF High – The high price from the higher timeframe HTF Median – The exact midpoint between high and low HTF Low – The low price from the higher timeframe 4 Upper Expansio
FREE
Fabii Memory Support Resistance
Fabien Georges Andre Guillemaud
Arrêtez de deviner quelles zones de support et de résistance comptent : chacune indique combien de fois le prix l'a testée. No repaint. Toute paire, tout timeframe. Sur votre graphique en 2 minutes. Test gratuit dans le Strategy Tester. Get more indicators here Baselines, volatility filters and oscillators. No repaint. Pourquoi vous en avez besoin Vous tracez les supports et les résistances à la main, et deux traders ne tracent jamais les mêmes niveaux sur le même graphique. Vous ne savez pas
FREE
Major Support and Resistance
Henri Salvatore Bigatti
4.86 (7)
This indicator shows current major support and resistance, if one exists. And as a support or resistance is broken it shows the new current, if any. To identify support and resistance points it uses the high and low points identified on the current chart. Allows too you to inform the maximum number of bars used to consider a support or resistance point still valid.
FREE
Nebula Gold Strike – Micro-Noise Heatmap + Hybrid Direction Logic + Tick Anomaly Detector   Version 1.3 | Copyright 2025 Bob's Channel | t.me/BobsGoldCrusherVIP "See the market in ticks — not bars."  What You Get in 1 Minute   - Hybrid Heatmap: Real-time color shows **direction + noise level** (green = bullish clean, dark red = bearish chaos).   - Tick Anomaly Dot: Yellow alert **the moment** a statistically weird tick arrives — no bar-close delay.   - DOM Imbalance Line: Buyer vs seller pr
FREE
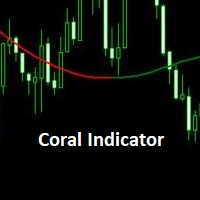
Coral Indi
Dinh Duong Luong
Coral trend is   a trend-following indicator that is widely popular among FOREX traders . It is usually used as a confluence with other indicators. It uses combinations of moving averages with complex smoothing formulas! It has two configurable parameters: Coefficient   - smoothing ratio (*) Applied price Calculation: Coral = (-0.064) * B6 + 0.672 * B5 - 2.352 * B4 + 2.744 * B3
FREE
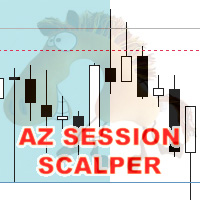
AZ session scalper
Yurii Shvechikov
5 (1)
AZ session scalper A small but useful session indicator, designed primarily for scalping. Enable the session you plan to trade, watch the reaction of the M5/M15 candlesticks to the level of the previous trading session, and enter. We always look at the reaction of the current session to the previous one. For example, if you trade the Americas, enable the European session, and watch how one session takes away liquidity from another. Important: adjust the time to your broker's time zone in the i
FREE
SC MTF Rsi MT5
Krisztian Kenedi
5 (7)
Indicateur d'Indice de Force Relative (RSI) avec support multi-timeframe, signaux visuels personnalisables et système d'alertes configurable. Services de programmation freelance, mises à jour et autres produits TrueTL sont disponibles sur mon profil MQL5 . Les retours et avis sont très appréciés ! Qu'est-ce que le RSI ? L'Indice de Force Relative (RSI) est un oscillateur de momentum qui mesure la vitesse et l'ampleur des variations de prix. L'indicateur oscille entre 0 et 100, comparant l'amp
FREE
Maîtrisez le rythme du marché avec l'indicateur Advanced Market Sessions. Le timing est primordial en trading. Savoir exactement quand les principales places financières ouvrent et ferment est la clé pour comprendre la volatilité du marché, la liquidité et le biais directionnel. Cet indicateur vous offre une visibilité cristalline sur les trois principales sessions de trading : l'Asie, Londres et New York. En traçant automatiquement le Plus Haut et le Plus Bas exacts de chaque session en temps r
FREE
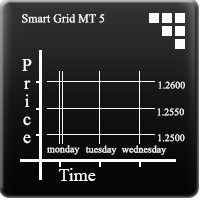
Smart Grid MT5
Dmitry Kotov
5 (5)
Smart Grid MT5 automatically recognizes any symbol, period and scale of the chart and marks it up accordingly. It is possible to mark up the chart by trading sessions. The grid consists of the two main line types. Vertical lines There are two visualization methods: Standard - the lines are divided into three types, separating: Small time period. Medium time period. Large time period. Trading Session - the lines are divided into groups (a total of ten). Each group has two lines: the first is res
FREE
Phoenix Range Indicator
Nigel Nii Darku Narnor Darko
Phoenix Range Indicator v6 is a multi-timeframe tool designed to track and display price ranges for XAUUSD (Gold).  Core Functionality Range Detection: It identifies the highest and lowest price points over specific time intervals (e.g., 1-minute, 1-hour, or 4-hour ranges). Timeframe-Specific Toggles: It uses a dashboard with checkboxes (like the chk_1 for 1m and chk_4H for 4-hour) to allow you to turn the visibility of different range levels on or off. Visual Levels: The indicator plots horizo
FREE
High Low Day MT5
Manuel Guillermo Sanchez Castro
Prior Day PRO is an advanced trading indicator for MetaTrader 5 that automatically identifies the market's most significant price levels using the previous day's range and the current trading session. Designed for professional traders, it provides high-probability trading zones for entries, exits, profit targets, and potential market reversals in real time—eliminating the need for manual calculations. Key Features 1. Previous Day High & Low Automatically calculates: Previous Day High (High Day)
FREE
Key Takeaways This timer does not lag like other timer indicators Show the time end of candlesticks and spread Hide or Show Spread depending on user needs Works on all timeframes Adjust Text Size Adjust Text Color Adjust Text Font  If you love this indicator, please leave a positive rating and comment, it will be a source of motivation to help me create more products <3
FREE
Trade Behavior Mirror lit uniquement l'historique des transactions déjà clôturées de votre propre compte et compte un seul phénomène précis : l'ouverture d'une nouvelle position peu après une perte réalisée, avec un lot plus important que votre volume habituel. L'outil ne prédit rien et ne conseille rien. Chaque chiffre du panneau correspond à quelque chose qui s'est déjà produit sur ce compte. Comment les chiffres sont construits : l'outil lit jusqu'à 31 jours de transactions clôturées, tous s
FREE
Auto Triangle Patterns Overview Auto Triangle Patterns is a chart indicator for MetaTrader 5. It scans the price history of the current chart and looks for three classical triangle formations: ascending, descending and symmetrical. When a formation is found, the indicator draws its two boundary lines, fills the area between them and adds a text label with the name of the formation. The pattern stays on the chart and is extended to the right with every new bar. When price leaves the formation in
FREE
VFI Quantum
Nikita Berdnikov
5 (1)
Introducing VFI (Volume Flow Indicator) – a trading indicator that analyzes the relationship between volume and price movement to identify key trading opportunities. The indicator displays the strength and direction of volume flow, providing clear signals about potential entry and exit points. Signals are formed based on zero line crossovers, crossovers between the VFI line and its exponential moving average (EMA), and when the indicator exits overbought and oversold zones. Attention! This stra
FREE
Draws the previous day, week and month high and low on your chart (PDH, PDL, PWH, PWL, PMH, PML) as clean lines with exact price labels. Optional previous close, today's open, and an alert when price touches a level. Free indicator, works on forex, gold, indices and any other symbol. The high and low of yesterday, last week and last month are some of the most watched levels in trading. Many traders mark them by hand every morning. This indicator does it for you, on every chart, and updates them
FREE
Rainbow MT5
Jamal El Alama
4 (1)
Description : Rainbow MT5 is a technical indicator based on Moving Average with period 34 and very easy to use. When price crosses above MA and MA changes color to green, then this is a signal to buy. When price crosses below MA and MA changes color to red, then this is a signal to sell. The Expert advisor ( Rainbow EA MT5 ) based on Rainbow MT5 indicator is now available here . MT4 version is available here .
FREE
The  Day Trading Price Pattern  indicator is an indicator of entry points that searches for and displays Price Action system patterns on dozens of trading instruments and on all standard time frames: (m1, m5, m15, m30, H1, H4, D1, Wk, Mn).  Show all the main Price Patterns are introduced in the Ebook  Day Trading With Price Action - Galen Wood You won't never miss any potential trading setup. Want to send all the signals to your Telegram Channel? Checkout this guide Advantages 1. Patterns: Tre
FREE
Zaxti Trend Levels [SORSAWO]: Where Algorithmic Precision Meets Visual Elegance Step into a new era of technical analysis. Zaxti Trend Levels is not just another charting tool; it is a comprehensive trend-visualization engine crafted for the discerning trader. By seamlessly blending the mathematical rigor of advanced adaptive filtering with intuitive visual mapping, this indicator transforms chaotic price action into a clear, actionable roadmap. Designed to eliminate noise and highlight what tru
FREE
Session Box Hours dessine des rectangles de session Asia, London et New York. Chaque boîte utilise le plus haut/plus bas des barres dans la plage horaire configurée. Outil de contexte visuel uniquement — n’envoie pas d’ordres et ne génère pas de signaux. Fonctions - trois sessions : Asia, London, New York (chacune on/off + heures/minutes + couleur) ; - base horaire : horloge broker/serveur ou heures GMT avec décalage Broker GMT ; - sessions overnight (fin ≤ début) se prolongent au jour suivant ;
FREE
The Magic SMA indicator is of great help in determining trend direction. It can be an excellent addition to your existing strategy or the basis of a new one. We humans can make better decisions when we see better visually. So we designed it to show a different color for rising and falling trends. Everyone can customize this in the way that suits them best. By setting the Trend Period, we can optimize it for longer or shorter trends for our strategy. It is great for all time frames. IF YOU NEED
FREE
Les acheteurs de ce produit ont également acheté
Trend Sniper X
Sarvarbek Abduvoxobov
4.86 (43)
Trend Sniper X est un indicateur de suivi de tendance multi-unités de temps pour MetaTrader 5 qui aide les traders à identifier la direction de la tendance et les points d'inversion potentiels avec clarté et précision. pour MT4: https://www.mql5.com/en/market/product/193245 Informations sur le prix : Le prix actuel est un prix promotionnel et est susceptible de changer lors des prochaines mises à jour et nouvelles fonctionnalités. Offre bonus : Pour obtenir GRATUITEMENT l'Auto-Trade Assistant E
Smart Trend Trading System — MetaTrader 5 Après votre achat, envoyez-moi un message sur MQL5 pour recevoir GRATUITEMENT Smart Universal Expert Advisor, ainsi que le cours en ligne, le manuel PDF et l’accès au groupe privé. STTS réunit la direction de la tendance, les signaux d’entrée et de sortie, les zones de retournement et les niveaux de prix importants directement sur votre graphique. Suivez le système manuellement ou connectez un EA compatible distinct pour une exécution automatique selon l
Un nouveau Roi en ville - Indicateur + Gestion des ordres (TP1 + TP2 + TP3) + Envoi optionnel de signaux Telegram INCLUS (GRATUIT) (SYSTÈME COMPLET DE TRADING et DE SIGNAUX) Notre meilleur EA pour l’Or : Gold Slayer Cet indicateur inclut une stratégie avancée, un système de trading avec gestion des ordres personnalisable ainsi qu’un système de retour à la moyenne combinant des extensions d’enveloppes, soutenu par plusieurs filtres intelligents de confirmation comme le RSI afin de détecter des en
Zoryk Gold
Reda El Koutbane
4.78 (18)
ZORYK — Système avancé de signaux XAUUSD pour MetaTrader 5 Vous connaissez certainement cette sensation. Vous passez du temps à analyser l’or. Vous attendez le bon point d’entrée. Vous ouvrez enfin la position, puis le prix commence immédiatement à évoluer contre vous. Vous fermez trop tôt, déplacez le Stop Loss ou hésitez pendant quelques secondes. Ensuite, le marché atteint exactement l’objectif que vous aviez initialement prévu, mais sans vous dans la position. Le problème n’était pas toujour
Ultra Indicator
Ihor Otkydach
5 (1)
ULTRA est un indicateur technique « tout-en-un » : il analyse le marché de manière autonome, génère des signaux de trading, affiche les niveaux permettant de définir des ordres stop-loss et suggère le moment opportun pour clôturer les positions afin de sécuriser les bénéfices ou de minimiser les pertes. En d'autres termes, peu importe que vous ne sachiez pas analyser le marché, déterminer les niveaux (où placer votre stop-loss) ou que vous ayez du mal à gérer votre capital. ULTRA s'occupera de t
Gardez votre avantage de trading dans votre ligne de mire ! M5 Sniper est un nouvel indicateur de MeanFX. Il combine des signaux de trading précis avec des niveaux de TP/SL adaptatifs — créant ainsi les meilleures opportunités de trading statistiques possibles ! Le prix augmente tous les 5 achats, le prochain prix est de 69$ Envoyez-moi un message après l’achat pour recevoir des conseils/un guide et un EA bonus Qu’est-ce qui le distingue ? Performance statistique éprouvée sur Gold XAUUSD ( fonct
En 2019, j'ai montré au monde entier ce dont cet indicateur est capable. J'ai tradé ses signaux manuellement, sur un compte réel, en toute transparence — le compte était suivi sur Myfxbook, et je relatais cette expérience en détail sur Facebook. Résultat : en quatre mois, 10 000 dollars sont devenus 941 411. Le risque était délibérément extrême — le drawdown allait jusqu'à 54 %, car dans notre métier, le profit et le risque vont toujours de pair. La capture d'écran de Myfxbook est la première im
SuperScalp Pro
Van Minh Nguyen
4.54 (37)
SuperScalp Pro - Professional Multi-Layer Confluence Scalping System SuperScalp Pro est un indicateur de scalping avancé qui améliore le Supertrend classique grâce à plusieurs filtres intelligents de confirmation. Il vous aide à identifier des opportunités de trading Buy/Sell présentant une probabilité de réussite plus élevée, tout en réduisant considérablement les faux signaux. Des flèches Buy et Sell bien visibles apparaissent directement sur le graphique, avec des niveaux de Stop Loss et de T
Gann Made Easy   est un système de trading Forex professionnel et facile à utiliser qui est basé sur les meilleurs principes de trading en utilisant la théorie de mr. WD Gann. L'indicateur fournit des signaux d'ACHAT et de VENTE précis, y compris les niveaux Stop Loss et Take Profit. Vous pouvez échanger même en déplacement en utilisant les notifications PUSH. VEUILLEZ ME CONTACTER APRÈS L'ACHAT POUR RECEVOIR GRATUITEMENT DES INSTRUCTIONS DE TRADING ET D'EXCELLENTS INDICATEURS SUPPLÉMENTAIRES! V
SMC Intraday Formula
VividMind Digital Solutions
5 (26)
Commençons par être honnêtes. Aucun indicateur ne vous rendra rentable à lui seul. Si quelqu’un vous dit le contraire, il vous vend un rêve. Tout indicateur qui affiche des flèches parfaites d’achat/vente peut être rendu impeccable — il suffit de zoomer sur la bonne partie de l’historique et de capturer uniquement les trades gagnants. Nous ne faisons pas cela.  SMC Intraday Formula est un outil. Il lit la structure du marché pour vous, identifie les zones de prix à la probabilité la plus élevée
M1 Sniper MT5
Oleg Rodin
5 (7)
M1 SNIPER   est un système d'indicateurs de trading facile à utiliser. Il s'agit d'un indicateur à flèche conçu pour l'unité de temps M1. Cet indicateur peut être utilisé seul pour le scalping sur l'unité de temps M1 ou intégré à votre système de trading existant. Bien que conçu spécifiquement pour le trading sur l'unité de temps M1, ce système peut également être utilisé avec d'autres unités de temps. Initialement, j'avais conçu cette méthode pour le trading du XAUUSD et du BTCUSD. Cependant, j
GoldenX Entry MT5
VividMind Digital Solutions
5 (17)
GoldenX Entry est un indicateur MT5 doté d’un algorithme adaptatif Smart Entry Trend, d’un système de scoring des signaux, d’un détecteur de régime de marché et d’un filtre de volatilité. Chaque signal inclut un niveau d’entrée calculé, trois niveaux de Take-Profit (TP1, TP2, TP3) ainsi qu’un niveau de Stop-Loss. Il est construit sur plusieurs couches analytiques conçues pour s’adapter à différentes conditions de marché, combinant un système analytique multicouche avec un optimiseur intégré et u
Gold Entry Sniper
Tahir Mehmood
5 (21)
Gold Entry Sniper – Tableau de Bord ATR Multi-Unités de Temps pour Scalping et Swing Trading sur l'Or Gold Entry Sniper est un indicateur avancé pour MetaTrader 5 qui fournit des signaux d'achat/vente précis sur XAUUSD et autres actifs, basé sur la logique de Trailing Stop ATR et l' analyse multi-unités de temps . Caractéristiques et Avantages Clés Analyse Multi-Unités de Temps – Affiche les tendances en M1, M5, M15 sur un seul tableau. Trailing Stop Basé sur l'ATR – Ajuste automatiquement selon
Gold Trend Coach MT5
Cristhian Alexander Gaibor Cuasquer
5 (4)
Gold Trend Coach est un indicateur de tendance pour l'or (XAUUSD) sur MetaTrader 5 avec des signaux d'achat et de vente, un stop loss et trois take profit confirmés à la clôture de la bougie (sans repaint), un coach qui vous guide de l'entrée jusqu'au TP3, un tableau multi-timeframe et des alertes sur votre téléphone et sur Telegram. Conçu pour le scalping en M1 et M5 et l'intraday en M15 pendant les sessions de Londres et de New York. BONUS : EA d'auto-trading GRATUIT pour Gold Trend Coach. Écr
Prochaine mise à jour — Version 2.52 bientôt disponible ! [NOUVEAU] Préparez-vous à découvrir 4 nouvelles fonctionnalités majeures conçues pour améliorer votre analyse du marché et votre flux de travail de trading Nous faisons passer l’analyse du marché au niveau supérieur avec 4 nouvelles fonctionnalités conçues pour répondre à vos besoins en trading. Découvrez : 1. TRADE OVERVIEW DASHBOARD 2. CONFLUENCE AT ZONE 3. STRONG & WEAK HIGH/LOW 4. OTE 1. TRADE OVERVIEW DASHBOARD Un tableau de bord qu
Atomic Analyst MT5
Issam Kassas
4.5 (64)
Atomic Analyst — MetaTrader 5 Après votre achat, envoyez-moi un message sur MQL5 pour recevoir GRATUITEMENT Smart Universal Expert Advisor, ainsi que le cours en ligne, le manuel PDF et l’accès au groupe privé. Atomic Analyst réunit l’action des prix, la direction de la tendance, les signaux d’entrée et de sortie, le Stop Loss et plusieurs niveaux de Take Profit directement sur votre graphique. REPÉREZ LE SIGNAL. COMPRENEZ LA CONFIGURATION. Atomic Analyst présente son analyse sous forme d’inform
Adaptive Price Action Engine Achetez un indicateur, obtenez l'EA gratuitement Analyse auto-optimisée des tendances et des figures de chandeliers Multi-Timeframe Les marchés évoluent constamment, et tous les modèles de Price Action n’ont pas la même valeur dans toutes les conditions de marché. Adaptive Price Action Engine a été conçu pour s’adapter aux changements du marché en combinant structure de tendance, analyse Multi-Timeframe, figures de chandeliers et optimisation statistique au sein d’un
ARICoins
Temirlan Kdyrkhan
ARICoin is a powerful trading companion designed to generate high-probability entry signals with dynamic TP/SL/DP levels based on volatility. Built-in performance tracking shows win/loss stats, PP1/PP2 hits, and success rates all updated live. Key Features: Buy/Sell signals with adaptive volatility bands Real-time TP/SL/DP levels based on ATR Built-in MA Filter with optional ATR/StdDev volatility Performance stats panel (Success, Profit/Loss, PP1/PP2) Alerts via popup, sound, push, or email Cust
Boba Analysis Suite
Trade Ready Solutions LLC
5 (2)
Boba Analysis Suite Boba Analysis Suite est un indicateur d’analyse pour MetaTrader 5. Il réunit la structure du marché, les zones de prix pertinentes et le contexte général du marché dans une même vue graphique. Développé à partir de l’expérience pratique d’un trader et formateur en trading, il accompagne une démarche d’analyse structurée : évaluer la direction du marché, identifier les niveaux importants et analyser plusieurs unités de temps conjointement. Une analyse en contexte La significat
ScalpPoint
Temirlan Kdyrkhan
ScalpPoint is a powerful trading companion designed to generate high-probability entry signals with dynamic TP/SL/DP levels based on volatility. Built-in performance tracking shows win/loss stats, PP1/PP2 hits, and success rates — all updated live. Key Features: Buy/Sell signals with adaptive volatility bands Real-time TP/SL/DP levels based on ATR Built-in MA Filter with optional ATR/StdDev volatility Performance stats panel (Success, Profit/Loss, PP1/PP2) Alerts via popup, sound, push, or emai
Auto Optimized SpeedAngle est un système de vectorisation du momentum de niveau institutionnel qui élimine l'ajustement de courbe ( curve-fitting ) grâce à une optimisation continue par avancement ( Walk-Forward Optimization , WFO). Plutôt que de s'appuyer sur des entrées statiques qui se dégradent lorsque les régimes de marché changent, l'indicateur recalibre dynamiquement ses paramètres en utilisant une validation hors échantillon ( Out-of-Sample , OOS), garantissant ainsi que les signaux affi
Zain Gold Scalping
Ahmed Gamal Abdel Nasser Mohamed
A complete price-action analysis tool built around dual independent entry logic, each confirmed against a volatility band, combined with a configurable set of nine optional confirmation filters that let you shape exactly how conservative or aggressive the tool's signals behave. Core Strategy Two independent entry setups, each triggering only when price moves outside a dynamic volatility band — giving two distinct ways to spot potential reversal points, which can be used together or separately.
Tokyo mt5 Indicator
Vasiliy Strukov
5 (14)
Le Tokyo Indicator offre une vue d'ensemble visuelle et claire de l'orientation de la tendance, des signaux de trading potentiels et des conditions du marché. Sa ligne de tendance en escalier, codée par couleur, distingue les phases haussières (en bleu) des phases baissières (en magenta). Des flèches directionnelles associées mettent en évidence les opportunités d'achat et de vente potentielles lors des changements de tendance. Un tableau de bord intégré regroupe le signal actuel, l'orientation
Azimuth Pro
Ottaviano De Cicco
5 (7)
Azimuth Pro V2: Synthetic Fractal Structure and Confirmed Entries for MT5 Overview Azimuth Pro is a multi-level swing structure indicator by Merkava Labs . Four nested swing layers, swing-anchored VWAP, ABC pattern detection, three-timeframe structural filtering, and closed-bar confirmed entries — one chart, one workflow from micro-swings to macro-cycles. This is not a blind signal product. It is a structure-first workflow for traders who care about location, context, and timing. Halloween P
Superhero
Ihor Otkydach
5 (3)
L'indicateur SUPERHERO est un système de trading multidevises conçu selon un principe « tout compris ». Cet indicateur analyse le marché de manière autonome et fournit des signaux indiquant quand ouvrir et clôturer des positions. Il utilise des ordres Stop Loss et Take Profit. Le rapport R:R est de 1:1. Ce système peut envoyer des notifications push sur votre smartphone, ce qui vous permet de passer des ordres « où que vous soyez », sans avoir à rester devant un ordinateur. C'est la solution idé
Indicateur de force et de momentum multi-devises MT5 Dynamic Forex28 Navigator est l'évolution de nos indicateurs populaires de longue date et réunit la puissance de trois outils en un : Advanced Currency Strength28 Indicator (700 avis) Advanced Currency IMPULSE with ALERT (530 avis) CS28 Combo Signals (bonus actuel) Les deux indicateurs précédents totalisent plus de 1 200 avis sur le MQL5 Market et font partie des outils incontournables de la communauté MT4 depuis 2016. Dynamic Forex28 Navigato
Volatility Master for MetaTrader is a real-time dashboard tool that scans up to  50 symbols  to identify high-volatility , trending markets instantly. With bullish/bearish signals, customizable alerts, and a user-friendly interface, it helps you avoid range-bound conditions and focus on high-probability trades. Clarity leads to confidence. Trade confidently and protect your capital effectively with this powerful dashboard. We don't offer free or bonus indicators in exchange of reviews from you.
Apex Patterns PRO Achetez l'indicateur - Obtenez GRATUITEMENT l'Expert Advisor basé sur celui-ci. Intelligence auto-optimisée des figures chartistes et des cassures Les scanners de figures traditionnels s'appuient sur des paramètres fixes, sous-performant souvent lorsque la volatilité et les structures du marché changent. Apex Patterns PRO est conçu pour s'adapter aux conditions changeantes du marché en combinant la reconnaissance des figures chartistes structurelles, le filtrage du momentum et
Neuro Poseidon MT5
Daria Rezueva
4.68 (53)
Neuro Poseidon is a new indicator by Daria Rezueva. It combines precise trading signals with adaptive TP/SL levels - creating best possible trades as a result! Message me and get  Neuro Poseidon Assistant  as a gift to automize your trading process! What makes it stand out? 1. Proven profitability on all assets and timeframes 2. Only confirmed BUY and SELL signals present on the chart 3. Adaptive TP & SL levels generated by the software for each trade 4. Easy to understand - suitable for al
Break and Retest Hunter is a powerful MetaTrader 5 indicator designed to automatically identify support and resistance levels, breakout structures, and potential retest opportunities in real time. Bonus Indicator: After purchasing Break and Retest Hunter , contact me to receive Trade Indicator Assistant EA completely free as a bonus utility. $65 for the next 10 copies . Next price is $120.  Combining adaptive market analysis, clear BUY/SELL signals, Fibonacci-based profit targets, and a premiu
Plus de l'auteur
AlgoTrade Margin Call Levels shows the prices where your broker's margin call and stop out would start for open positions on the active chart symbol. It draws horizontal lines at each level and shows the distance to them. What it shows The current margin level, used margin and free margin. The margin call price and stop out price for the symbol, based on the account settings from your broker. The distance to each level in points, percentage and average daily ranges. The potential loss before rea
FREE
AlgoTrade Gold Range Meter shows how far the price has moved today compared with an average day. It is made for XAUUSD and works on any symbol. What it shows The average daily range of the last 20 closed days (high minus low; weekend bars and flat bars are left out). Today's range so far and the percentage of an average day it has reached, with a bar marked at 100% and 150%. Two dotted lines: today's low plus the average range, and today's high minus the average range. Today becomes an average-s
FREE
AlgoTrade Position Size Panel works out the lot size for the risk you choose. Drag three lines on the chart (entry, stop loss and take profit) and the panel shows the result at once. What it shows Lot size for a risk in percent of balance, percent of equity or a fixed amount in the account currency, rounded down to the broker lot step so the loss stays within your risk. Loss at the stop and profit at the target, in money and in percent of the balance. Reward to risk, margin needed and free margi
FREE
AlgoTrade News on Chart displays the MetaTrader 5 economic calendar directly on your chart. It draws vertical lines for events affecting the currencies of the chart symbol and lists upcoming events on a compact card, including forecast, previous, and actual values. What it shows A dotted vertical line at each event: red for high importance, orange for medium importance, and grey for low importance. Hover over a line to view the event name, time, and values. The next high-importance event with a
FREE
AlgoTrade ATR Stop Levels displays the average true range (ATR) of the chart symbol and the stop distance: ATR times a multiplier. It draws the stop for a buy and the stop for a sell on the chart, and shows the ATR on four timeframes on a card. It reads data only. What it does The ATR of the last closed bars (14 by default), on the chart timeframe or on M15, H1, H4 or D1. Stop distance equals ATR times the multiplier (1.5 by default), rounded up to whole ticks. Two dashed lines from the newest b
FREE
AlgoTrade News Impact Statistics shows how your closed trades performed around economic news. It runs on any chart and reads account data only. What it shows Trades opened near news: an event of the symbol's currencies within 30 minutes before or after entry (1 to 240 minutes). Trades held through news: an event occurring later while the trade was open. Trades away from news. For each group: the number of trades, the share of winning trades, the net result, and the average trade. The net result
FREE
AlgoTrade Basket Manager treats your open trades as one basket. It shows the net result of the basket and closes all of its trades at the net profit or the net loss you choose. It never opens a trade. What it shows The net result of the basket: floating profit, swaps and the commission paid when the trades were opened. The number of buy trades and sell trades and their lots. The break-even price of the trades on the chart symbol, drawn as a line on the chart. The prices where the basket would cl
FREE
AlgoTrade Round Number Levels draws round price levels around the price and shows on a card the levels just above and below, the distance to each, and how many times the price visited each one today. It reads data only. What it does Major levels: 100 pips on forex pairs, or a step of about 1% of the price on other symbols (for example 50 on gold). You can also set the step yourself. Minor levels: 50 pips on forex, or a smaller step such as 10 on gold. Quarter levels (25 and 75 pips) can be turne
FREE
AlgoTrade Currency Strength Meter shows the strength of each of the 8 major currencies (USD, EUR, GBP, JPY, CHF, CAD, AUD, NZD) against the other 7, ranked on a card with the strongest and the weakest. It reads data only. What it does Strength is the average move of each currency against the other 7 across the 28 pairs: since the open of today's, this week's, or this month's candle in server time, or over the last hours (4 by default). Displays a ranked list with a bar for each currency, stronge
FREE
AlgoTrade Previous Day High Low draws the previous day's high, low, and close, today's open, and the previous week's and month's high and low on the chart, displaying the price position relative to these levels on a card. It reads data only. What it does Lines for each level from the start of the current day, week, or month, showing the level's name and price. Colors adapt to dark or light charts or can be set in the inputs. A card showing the price position relative to yesterday's range (above
FREE
AlgoTrade Pivot Points draws the daily, weekly, or monthly pivot point, resistance, and support levels on the chart and shows the current price position on a card. It reads data only. What it does Five formulas: Classic, Fibonacci, Camarilla, Woodie and DeMark, based on the previous day's, week's or month's high, low and close (DeMark also uses the open). Levels from R1 and S1 up to R3 and S3, or up to R4 and S4 with Camarilla. Lines for the current period from its start, showing each level's na
FREE
AlgoTrade Spread and Slippage Monitor displays the chart symbol spread and fill slippage on the chart. It runs on any chart and reads account data only. What it shows Current spread in points, along with the average and widest spread since the indicator started, updated on every new tick. Today's average and widest spread based on 1-minute bars. Hourly spread over the last 7 days (1 to 60 days), showing the widest hour, narrowest hour, and usual spread for the current hour. Slippage in points: t
FREE
AlgoTrade Trading Sessions draws the Sydney, Tokyo, London and New York sessions as boxes on the chart from the high to the low of each session, and shows on a card which sessions are open, when the next one opens, and each session's range against its average. It reads data only. What it does Boxes for the sessions of recent days (5 by default) on charts up to H4, with the session name and its range in points. Colors fit a dark or a light chart, or can be set in the inputs. A card with each sess
FREE
AlgoTrade Swap and Commission Tracker shows what your trades paid in commission, swap and fees, and what the next rollover may cost your open positions. It runs on any chart and reads account data only. What it shows Four periods with one click: today (from 00:00 server time), the last 7 days, the last 30 days and all history. For the period: the price result of closed trades, commission, swap, fees and charges, the net result, the number of closing deals and lots, and the cost per closed lot. T
FREE
AlgoTrade Loss Streak Guard helps you take a break after losing trades. It monitors your closed trades and pauses trading according to your rules. A trade opened during a pause is closed immediately or only reported, depending on your settings. The rules A wait after every losing trade (5 minutes by default). A longer pause after a specified number of losing trades in a row (3 losses and 1 hour by default). Each subsequent loss restarts the pause until a winning trade occurs. An optional stop fo
FREE
AlgoTrade Prop Guard watches the loss limits of your prop firm account in real time and shows them in one table: the limit, where you are now, a bar and the result. It warns you near a limit (70% by default). At the level you choose (90% by default) it closes all positions, deletes pending orders and keeps trading paused. What it checks Daily loss: from the balance at the daily reset, or from the higher of balance and equity. The limit is a % of the account size or of the start-of-day value. Max
AlgoTrade Drawdown Recovery Planner shows how far your account is below its high-water mark and the gain needed to recover. It runs on any chart and reads account data only. What it shows The high-water mark: the highest balance in the account history or the highest equity seen while the indicator runs, adjusted for deposits and withdrawals. You can also enter a custom value. Current equity, the drawdown in money and percentage, and the gain needed to return to the mark. A plan based on your inp
FREE
AlgoTrade Trading Hours Heatmap shows how your closed trades performed by the weekday and hour they were opened. It runs on any chart and reads account data only. What it shows A grid of weekdays and hours (broker server time). Saturday and Sunday rows appear when they have trades. Three measures with one click: net result, share of winning trades, and number of trades. All symbols or only the chart symbol, for the last 30 days, 90 days, 1 year or all history. The number of closed trades, the sh
FREE
AlgoTrade Account Statistics displays closed trade statistics on the chart. It runs on any chart and reads account data only. What it shows The net result of closed trades and the gain as a percentage of the starting balance. The number of closed trades, trades per week, the share of winning trades, and the profit factor. The average win, average loss, average trade, best trade, and worst trade. The longest runs of winning and losing trades. The deepest drop in closed-trade results, in money and
FREE
AlgoTrade Trade Journal records your trades automatically without manual typing. It runs on any chart and reads account data only. What it does Writes one row to a CSV file for every trade open, addition, partial close, close, and reversal. Each row includes the time, symbol, side, volume, price, stop loss, take profit, deal result, total trade result on close, magic number, reason (manual, Expert Advisor, stop loss, take profit), and comment. Takes a screenshot of the trade's symbol chart when
FREE
AlgoTrade Multi-Account Monitor shows all your MT5 accounts on one panel. Run it in each MetaTrader 5 terminal on the same computer: every copy shares its own account and shows all of them. It reads account data only. What it does Shows each account's equity and currency, floating result, margin level, today's closed result, and number of open positions. A headline at the top states "All accounts OK" or indicates how many accounts need attention. Warns when the margin level is below your limit,
FREE
AlgoTrade Weekly Trading Review displays a weekly summary of your closed trades directly on the chart, comparing the current or previous week to the preceding one alongside notes on notable patterns. It also saves each week as an HTML report. It reads account data only. What it does Displays the week's net result, number of closed trades, winning share, average win, average loss, profit factor, best day, and worst day, alongside the same metrics for the prior week. Provides notes based on your t
FREE
AlgoTrade Candle Timer displays the time remaining for the current candle next to the price, and on a card showing candles from M1 to monthly, the spread, server time, and when the symbol's market opens or closes. It reads data only. What it does Displays the time remaining for this chart's candle next to the latest candle in your chosen color and size. Shows "closed" when the market is closed. A card displaying the time remaining for M1, M5, M15, M30, H1, H4, daily, weekly, and monthly candles,
FREE
AlgoTrade Correlation Matrix shows how the symbols of your list move together, as a colored matrix on a card, with the symbols that move most with and most against the chart symbol. It reads data only. What it does Up to 10 symbols from a comma separated list (by default EURUSD, GBPUSD, USDJPY, AUDUSD, USDCAD, USDCHF, NZDUSD, XAUUSD). The chart symbol is added when it is not in the list. Finds each symbol at your broker, with the chart symbol's prefix and suffix (for example EURUSD.pc). Tabs for
FREE
Filtrer:
Aucun avis
Répondre à l'avis