Session Edge Profiler

Session Edge Profiler

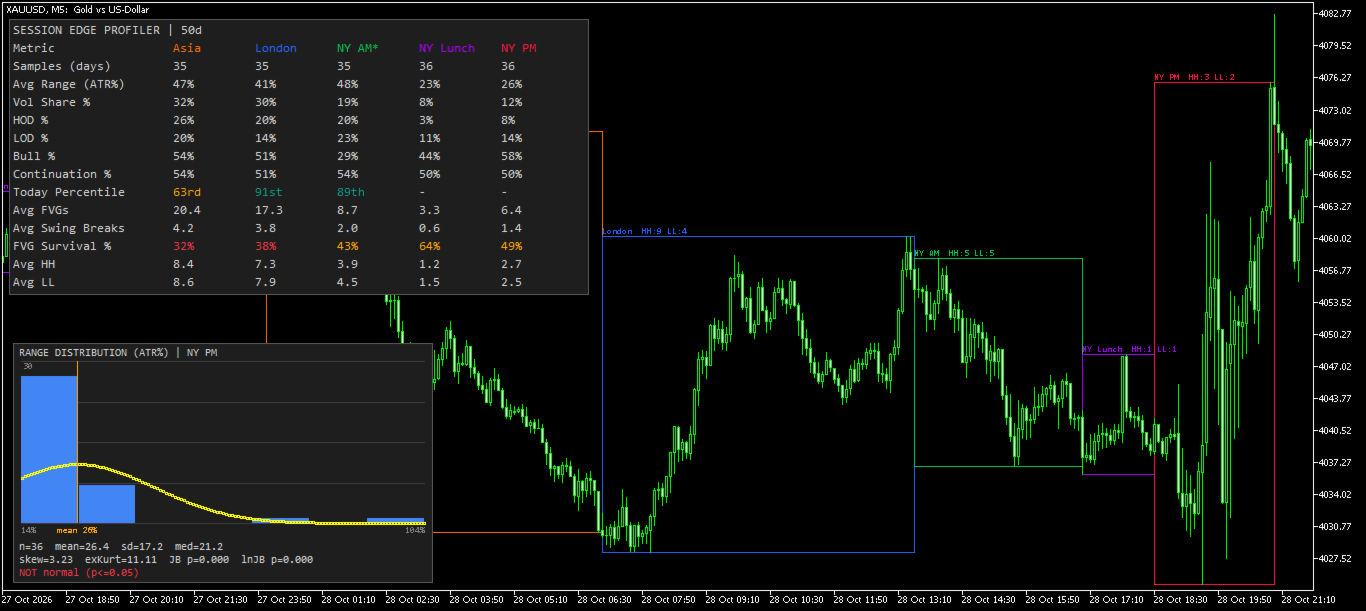
Session statistics for the Asia, London and New York sessions, drawn directly on your chart.

Session Edge Profiler works out how each trading session has actually behaved on your symbol over a lookback period you choose. It draws the session ranges on the chart and shows a dashboard of statistics for each session. It is a statistical profiling tool, not a signal generator: it gives you historical context on how large, how directional and how structured each session tends to be.

What it does

For each enabled session, the indicator:

  1. Finds every historical occurrence of that session within your lookback window.
  2. Measures the range, direction, structure and volume of each occurrence.
  3. Compares today's session with that history.
  4. Draws the session boxes on the chart and shows the aggregated statistics in a dashboard and a distribution histogram.

Sessions

Five sessions are supported. Each can be enabled or disabled, and each has its own start and end time input in New York time, in HH:MM format:

Session Default window (NY time)
Asia 17:00 – 00:00
London 00:00 – 06:30
NY AM 06:30 – 10:00
NY Lunch 10:00 – 11:30
NY PM 11:30 – 14:00
  • The end time is exclusive.
  • If the end time is earlier than the start time, the window wraps past midnight, as Asia does.
  • If start and end are equal, the session is never active.
  • Invalid time strings fall back to the default for that field, and a message is printed in the Experts log.
  • The defaults are tuned to a typical broker where server time is New York time plus 7 hours. Adjust the times and/or the server offset to match your broker.

Session boxes (on-chart)

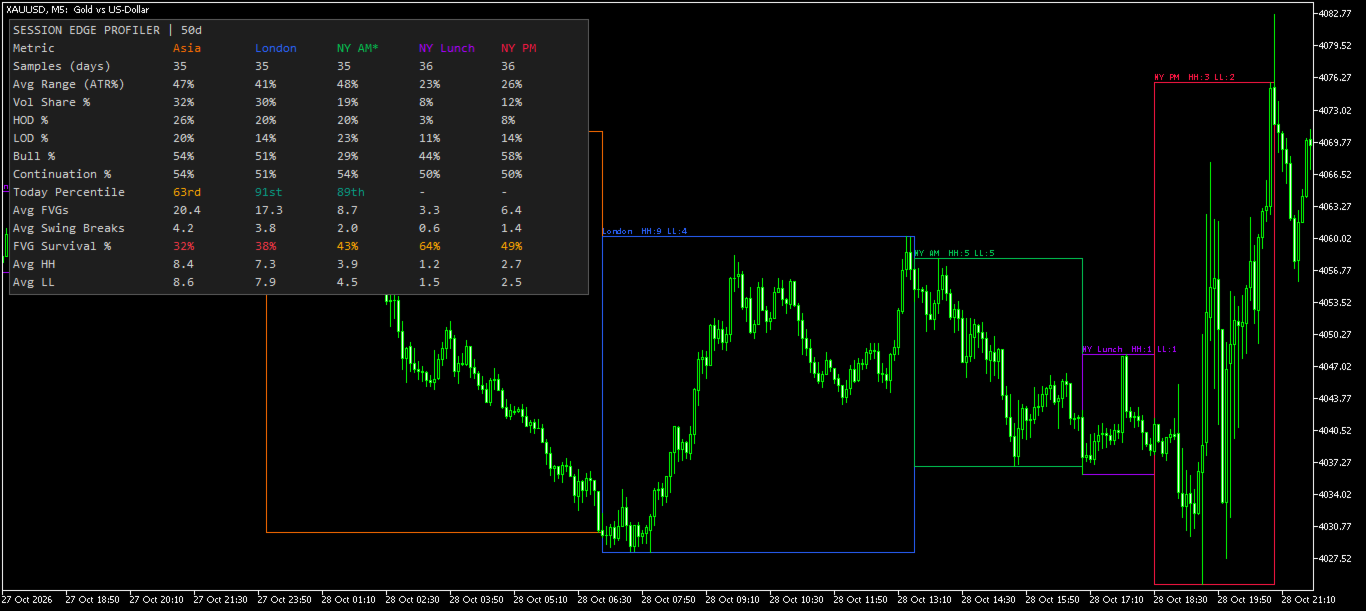
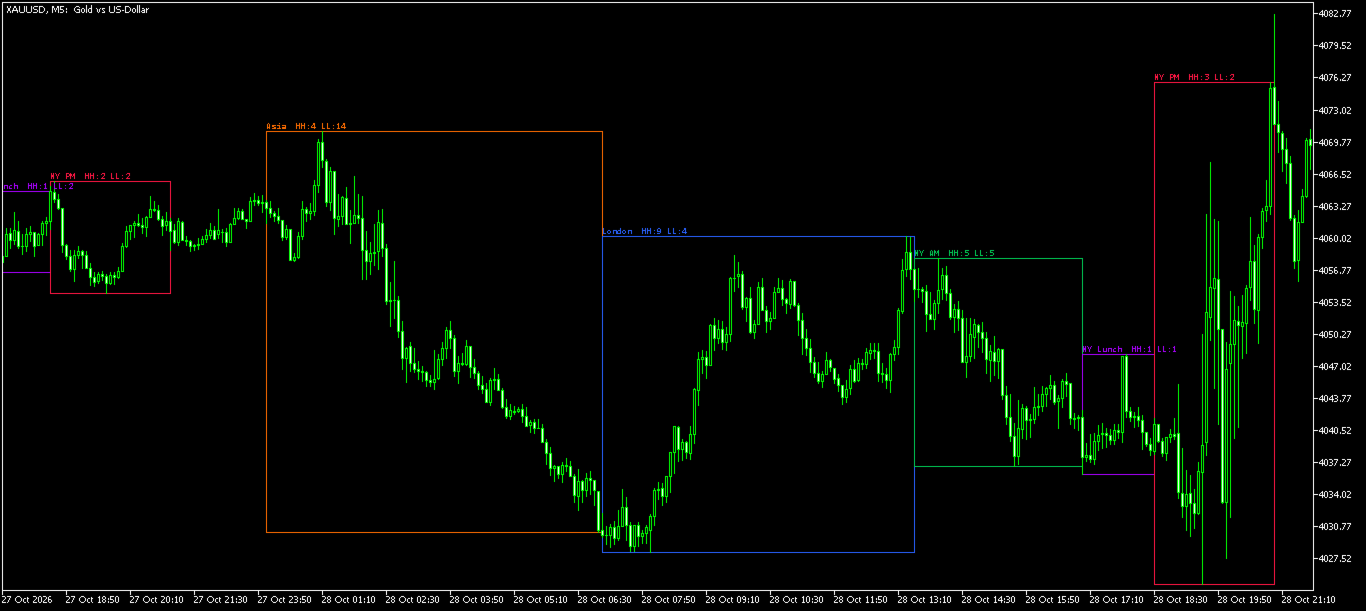
  • Every historical session in the lookback is drawn as a rectangle spanning its high to low.
  • The session still running is drawn with a dashed border and marked with an asterisk ( * ), and it updates as price develops.
  • Each session has its own colour.
  • Optional box labels show the session name plus the number of Higher Highs (HH) and Lower Lows (LL) formed inside that box.
  • Boxes can be filled or outline-only. Filled boxes are drawn behind the candles.

Dashboard statistics

The dashboard has one column per enabled session. The active session is marked with * .

Metric Meaning
Samples (days) Number of historical session instances used (after the weekday filter).
Avg Range (ATR%) Average session high-low range as a percentage of the previous day's D1 ATR. 100% means the session moves one full daily ATR on average.
Vol Share % Average share of the whole trading day's tick volume traded in this session.
HOD % How often this session printed the high of the trading day.
LOD % How often this session printed the low of the trading day.
Bull % Percentage of sessions that closed above their open.
Continuation % How often the session closed in the same direction as the previous occurrence of the same session.
Today Percentile Where the current (or latest) session's range ranks among historical sessions. Coloured green at 75th and above, red at 25th and below, orange in between.
Avg FVGs Average number of Fair Value Gaps (3-candle gaps) formed per session.
Avg Swing Breaks Average number of closes beyond the latest confirmed swing high or low per session.
FVG Survival % Percentage of Fair Value Gaps that were not invalidated by a close back through them within the same session. Green at 70% and above, orange at 40% and above, red below.
Avg HH Average Higher Highs per session (bullish structure). Optional row.
Avg LL Average Lower Lows per session (bearish structure). Optional row.

Range distribution histogram

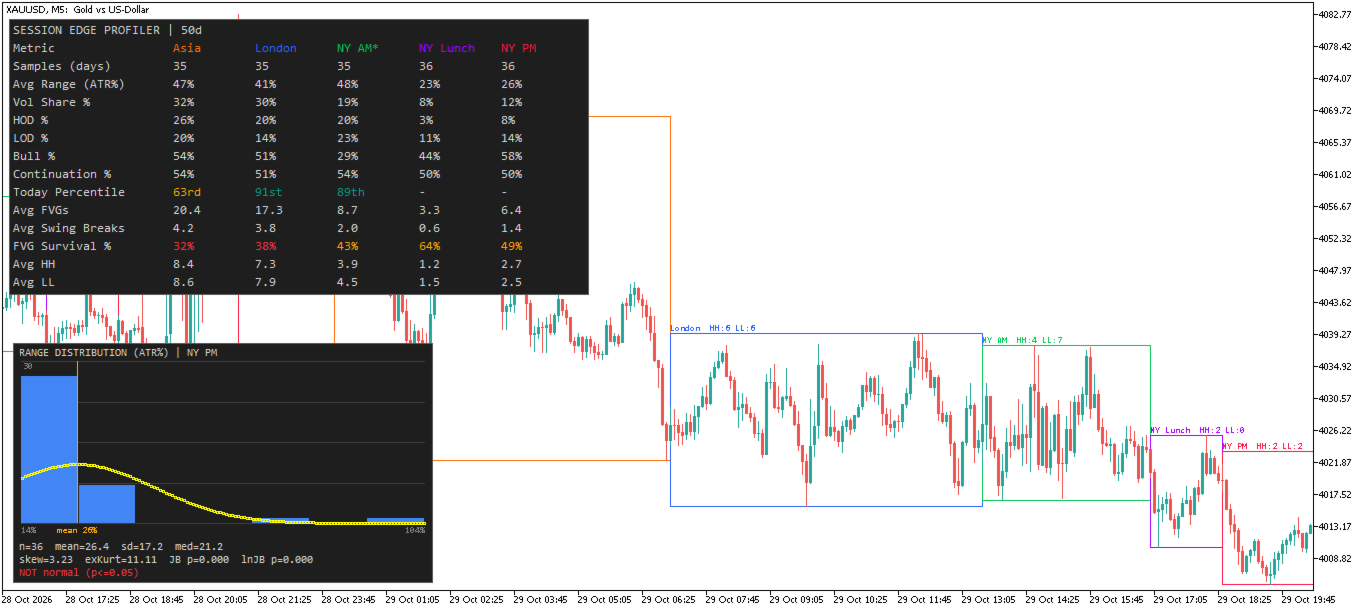
For each session, an optional panel plots a histogram of the historical session ranges (in ATR%) with a normal-curve overlay of the same mean and standard deviation. It also shows:

  • sample count, mean, standard deviation and median
  • skewness and excess kurtosis
  • Jarque-Bera normality test p-value on the raw ranges
  • the same test on the log of the ranges, to check for a log-normal shape
  • a plain-language verdict: consistent with normal, not normal but plausibly log-normal, or not normal

At least 8 samples are needed. With fewer than 30 samples the verdict is flagged [small n] , because the test has little power on small samples. Session ranges cannot go below zero, so they are often right-skewed rather than normal.

Settings

General

  • Timeframe – the timeframe the session bars are read from. The default is the current chart timeframe. Lower timeframes give more precise session boundaries.
  • Days back – calendar days of history to analyse. The default is 50.
  • Hours to ADD to server time to get NY time – a constant offset from broker server time to New York time. The default is -7.

Session times

  • Enable toggle, start time and end time for each of the five sessions, as described above.

Filters

  • Weekday toggles (Sun–Sat) – include or exclude trading days by weekday. The default is Monday to Friday. The weekday refers to the trading day, which rolls over at 18:00 NY, so the Asia session that starts in the evening belongs to the next calendar day's trading day.
  • Daily ATR length – period of the Wilder ATR on D1 used to normalise ranges. The default is 14. The ATR value used is that of the previous completed D1 bar.
  • Pivot strength – number of bars on each side required to confirm a swing high or low for Swing Breaks. The default is 5.

Session boxes

  • Draw session ranges – show or hide the boxes.
  • Fill boxes – filled or outline-only.
  • Label each box – show the session name, HH and LL counts.
  • Box label font size.

Stats

  • Show stats – master switch for the dashboard and histogram. Turn it off for a clean chart that shows only the session boxes.

Distribution

  • Show range distribution histogram.
  • Histogram bins – 0 for automatic (Sturges' rule, limited to 6–30 bins), or set your own.
  • Histogram X / Y – pixel position of the panel.

Dashboard

  • Show dashboard.
  • X / Y offset and font size.
  • Show Avg HH / Avg LL rows.

How the calculations work

  • Time zone: all session windows are defined in New York time. Broker server time is converted using the constant offset you set. Daylight saving time is not handled automatically. If your broker's offset to New York time changes during the year, update the input.
  • Trading day: New York time plus 6 hours, so the day rolls over at 18:00 NY and the Asia session stays within one trading day.
  • Volume: tick volume. Forex and CFD brokers rarely provide real volume, so Vol Share % reflects tick activity.
  • Percentages are on a 0–100 scale and are not rounded internally.
  • Fair Value Gap: a bullish gap is a candle low above the high two candles earlier. A bearish gap is a candle high below the low two candles earlier. A gap is invalidated when price closes back through its far edge.
  • Swing Break: a close beyond the most recent confirmed pivot high or low, counted once per pivot.
  • HH / LL: 3-candle pivot highs and lows that exceed the previous pivot of the same session.
  • Today Percentile: the percentage of historical sessions whose range was less than or equal to the current range.

Tips

  • Make sure your chart has enough history loaded for the lookback you choose, including D1 history for the ATR.
  • Use the box labels together with the Avg HH / Avg LL rows to compare a single session's structure with its typical behaviour.
  • A high Today Percentile on an active session means the session is already unusually wide relative to its history.
  • If boxes look misaligned with the sessions you expect, check the server-to-NY offset first, then the session times.
  • To reduce clutter on small charts, disable the histogram or lower the dashboard font size.

Notes

  • The indicator uses chart objects only. It has no plot buffers and does not place trades.
  • Statistics refresh on each new bar and at most every 30 seconds while the chart is live.
  • Results depend on your broker's data, server time offset and the history available.

Disclaimer

This indicator is an analysis tool that summarises past price behaviour. Past session statistics do not guarantee future results. It is provided free, for educational and analytical purposes, and is not financial advice. 
Produits recommandés
Blahtech VWAP MT5
Blahtech Limited
5 (1)
Blahtech VWAP - Volume Weighted Average Price (VWAP) is the ratio of price to total volume. It provides an average price over a specified time interval.  Links [  Install  |  Update  |  Documentation   ] Feature Highlights Configurable VWAP Line Sessions, intervals, anchored or continuous Previous day settlement line Standard Deviation bands Alerts at bar close or real time Automatic Broker or Tick volumes Significantly reduced CPU usage Input Parameters Expert Advisor Mode  - Reserved for iCu
FREE
Aperçu Découvrez une analyse de flux d'ordres (order flow) de niveau professionnelle avec l'Anchored Volume Profile, un indicateur de distribution de volume ultra-léger et performant conçu exclusivement pour MetaTrader 5. Développé à partir de zéro via des mécaniques de rendu Canvas directement en mémoire active, cet indicateur élimine la latence CPU excessive (CPU lag), le scintillement de l'interface et le gel des graphiques couramment associés aux profils standards basés sur des objets rect
FREE
Proton Candle Time MT5 OVERVIEW Proton Candle Time MT5 is an indicator for MetaTrader 5 that displays a real-time countdown timer showing the number of seconds remaining in the current candle. The indicator updates continuously as the candle develops and resets when a new candle opens. This tool is designed for traders who need precise timing information while analyzing price action. PRIMARY FUNCTION The indicator displays the active candle countdown timer directly on the chart. The timer show
FREE
Smart FVG Stats
- Md Rashidul Hasan
5 (1)
The  Smart FVG Statistics Indicator  is a powerful MetaTrader 5 tool designed to automatically identify, track, and analyze Fair Value Gaps (FVGs) on your charts. Love it? Hate it? Let me know in a review! Feature requests and ideas for new tools are highly appreciated. :) Try "The AUDCAD Trader": https://www.mql5.com/en/market/product/151841 Key Features Advanced  Fair Value Gap  Detection Automatic Identification : Automatically scans for both bullish and bearish FVGs across specified histo
FREE
RM Volume Profile dessine un veritable Volume Profile et Market Profile (TPO) sur votre graphique — un profil par seance de trading — pour voir ou les transactions ont vraiment eu lieu et comment le POC (Point of Control) migre d'un jour a l'autre. Chaque seance affiche son POC et la Value Area (VAH/VAL), ainsi qu'un histogramme de volume optionnel. Affichez plusieurs seances precedentes a la fois pour suivre la migration du POC et reperer ou le marche a accepte ou rejete le prix. CARACTERIST
FREE
JT360 DNA Mini PnL Pointer V1.04 Public Компактно. Наглядно. Всегда перед глазами. JT360 DNA Mini PnL Pointer — это лёгкий индикатор для MetaTrader 5, который отображает суммарную текущую прибыль или убыток по всем открытым позициям текущего символа графика. Компактная индикация непосредственно на графике объединяет PnL относительно первоначального риска в формате R, тонкую мини-полоску и настраиваемую цветовую матрицу. Фирменные цвета JT360 — бирюзовый и пурпурный — выделяют крайние значения и
FREE
HTF Candles Nika superpose des bougies en taille réelle provenant de n'importe quelle période supérieure directement sur le graphique actuel dans MetaTrader 5. Il offre une vue multi-unités de temps claire sans quitter votre graphique. Fonctionnalites principales - Dessine les bougies de la période supérieure sous forme de rectangles remplis avec des mèches sur le graphique actuel - Prend en charge les modes d'affichage : bougies standard et Heiken Ashi - Minuterie de compte à rebours en direc
FREE
Mirror Chart MT5
Andrej Hermann
5 (1)
The Mirror Chart MT5 is a overlay indicator specifically designed to project a second financial instrument directly onto the main chart window. This tool is invaluable for traders who rely on correlation analysis, as it visualizes the price movements of two different instruments in real time. Unlike traditional overlays, this indicator utilizes intelligent, dynamic centering and scaling logic. It continuously analyzes the visible price range in the current window for both symbols and calculates
FREE
TrendVision AI
Murtadha Majid Jeyad Al-Khuzaie
TrendVision AI – Smart Trend Channels & Price Forecasting for MetaTrader 5 Discover market structure and explore potential future price direction with TrendVision AI, an advanced technical indicator for MetaTrader 5 that combines automatic trendline analysis with a machine-learning-based price forecasting model. How Does TrendVision AI Work? TrendVision AI analyzes historical candlestick data within a configurable lookback window. It automatically draws two trendlines directly on the chart:
FREE
High Low Open Close
Alexandre Borela
4.98 (46)
Si vous aimez ce projet, laissez un examen 5 étoiles. Cet indicateur tire les prix ouverts, élevés, bas et de fermeture pour les prix spécifiés période et il peut être ajusté pour un fuseau horaire spécifique. Il s ' agit là d ' un niveau important qui s ' intéresse à de nombreux domaines institutionnels et professionnels. traders et peut être utile pour vous de connaître les endroits où ils pourraient être plus active. Les périodes disponibles sont les suivantes : Jour précédent. Semaine pré
FREE
Donchian Breakout And Rsi
Mattia Impicciatore
4.33 (3)
Description générale Cet indicateur est une version améliorée du Canal Donchian classique, enrichie de fonctionnalités pratiques pour le trading réel. En plus des trois lignes standard (supérieure, inférieure et ligne médiane), le système détecte les cassures et les affiche visuellement avec des flèches sur le graphique, en montrant uniquement la ligne opposée à la direction actuelle de la tendance pour une lecture plus claire. L’indicateur comprend : Signaux visuels : flèches colorées lors des
FREE
Trading Sessions by Mahefa R est un indicateur pour MetaTrader 5 permettant d’identifier visuellement les quatre principales sessions de trading : New York, Londres, Tokyo et Sydney . Conçu pour offrir une lecture propre, intuitive et professionnelle du marché, il met en évidence les périodes les plus actives du Forex grâce à un affichage intelligent des plages horaires (ranges) , couleurs de bougies spécifiques , et séparateurs journaliers . Fonctionnalités principales : Détection automatique
FREE
Here   our more valuable tools SMC Trend Trading   ,  Easy SMC Trading  ,  Institutional SMC Architect Volume Analysis Tools  ,  Volume flow Profile  ,  Market volume profile  , FVG with Volume  , Liquidity Heatmap Profile  ,  Volume Spread Analysis A professional spike pattern indicator built for synthetic traders who scalp and swing Crash 500/300/1000 with precision.  This indicator: Detects powerful 3-candle spike formations (Spike → Pullback → Spike) Automatically draws a clean box a
FREE
Double Correlation indicator (free) plots two windowed correlations in a separate window.  the size of window is taken as input before the two symbols to correlate to. Two symbols are taken as an input parameters as well as period length. and the two correlations are computed with the currently shown symbol ex: input GBPJPY and AUDNZD.  current symbol EURUSD then the following will be computed corr(EURUSD,GBPJPY) and corr(EURUSD,AUDNZD) The indicator can be useful to run a multi-symbol pair trad
FREE
Value Chart Candlesticks
Flavio Javier Jarabeck
4.57 (14)
The idea of a Value Chart indicator was presented in the very good book I read back in 2020 , " Dynamic Trading Indicators: Winning with Value Charts and Price Action Profile ", from the authors Mark Helweg and David Stendahl. The idea is simple and the result is pure genius: Present candlestick Price analysis in a detrended way! HOW TO READ THIS INDICATOR Look for Overbought and Oversold levels. Of course, you will need to test the settings a lot to find the "correct" one for your approach. It
FREE
Session Profiles
Basharat Umar Khan
Short Description Draws rolling Time-Price-Opportunity (TPO) and footprint volume profiles for the Asia, London, and New York sessions with POC/VAH/VAL levels, delta volume bias, order flow overlays, liquidity heatmaps, developing rolling lines, Naked POC (NPOC) tracking, Initial Balance breakouts, multi-session confluence zones, and automatic broker GMT-offset detection. Full Description Plots separate market-profile and volume-profile style histograms for the three major trading sessions (Asi
FREE
Meridia Sessions
Marco Lorenzo Gerbino
Meridia Sessions est l'édition essentielle de Meridia Session Suite. Elle dessine les bougies H1 sur toute unité de temps inférieure, avec un compte à rebours jusqu'à la clôture de la bougie H1 en cours, ainsi que les sessions Asie, Londres et New York en rectangles avec leur plus haut et leur plus bas. Des sessions qui suivent chaque changement d'heure Chaque session a son propre fuseau horaire (Europe centrale, Londres, New York, Tokyo, Sydney, UTC ou heure du serveur) et l'heure d'été est app
FREE
Important Lines
Terence Gronowski
4.88 (24)
This indicator displays Pivot-Lines, preday high and low, preday close and the minimum and maximum of the previous hour. You just have to put this single indicator to the chart to have all these important lines, no need to setup many single indicators. Why certain lines are important Preday high and low : These are watched by traders who trade in a daily chart. Very often, if price climbs over or falls under a preday low/high there is an acceleration in buying/selling. It is a breakout out of a
FREE
Haven Volume Profile
Maksim Tarutin
4.64 (14)
Haven Volume Profile est un indicateur multifonctionnel pour l'analyse du profil de volume qui aide à identifier les niveaux de prix clés basés sur la répartition du volume de négociation. Il a été conçu pour les traders professionnels qui souhaitent mieux comprendre le marché et identifier les points d'entrée et de sortie importants pour leurs transactions. Autres produits ->  ICI Fonctionnalités principales : Calcul du Point of Control (POC) - le niveau d'activité commerciale maximal, ce qui a
FREE
Rainbow Volume Profile A simple, lightweight volume profile indicator that visualizes price-range volume with color-coded POCs (Points of Control). Overview RainbowVolumeProfile04Simple.mq5 calculates and displays a price–by–volume (Volume Profile) over a user-specified number of bars. The indicator automatically detects the top 5 volume concentration levels (POCs) and draws a colorful horizontal histogram at the right side of the chart. The computation is lightweight and updates in real time. K
FREE
This indicator will mirror the assets in use in another metatrader, being able to choose the timeframe and a template. This is the Metatrader 5 Client, it needs the Metatrader 4 or 5 Server versions: Metatrader 4 Mirror Chart Server:   https://www.mql5.com/en/market/product/88644 Metatrader 5 Mirror Chart Server: https://www.mql5.com/en/market/product/88652 Details of how it works in the video.
FREE
Neon Profile
Manuel Fernandez Barranco
XBK Neon Profile MT5 Developed by XBK Systems. XBK Neon Profile is an advanced technical indicator for MetaTrader 5 that combines smoothed trend analysis and a dynamic volume profile within a single chart window. The indicator is designed to provide a clear view of market structure and significant volume levels without cluttering the screen. Key Features Smoothed Trend Bands (Neon Trend Bands) Identifies the current trend direction using a custom smoothing algorithm designed to filter out market
FREE
MACD Colored ZeroLag
Farzin Sadeghi Bonjar
4.73 (11)
It is the MQL5 version of zero lag MACD that was available for MT4 here: https://www.mql5.com/en/code/9993 Also there was a colored version of it here but it had some problems: https://www.mql5.com/en/code/8703 I fixed the MT4 version which has 95 lines of code. It took me 5 days to write the MT5 version.(reading the logs and testing multiple times and finding out the difference of MT5 and MT4!) My first MQL5 version of this indicator had 400 lines of code but I optimized my own code again and n
FREE
VWAP_PC_MQL5 — petit indicateur “fait maison” type VWAP affichant le prix moyen pondéré par le volume en temps réel sur MT5. TF : Fonctionne sur tous les timeframes. Paire : Compatible avec tous les marchés : Forex, indices, matières premières, actions. Paramètres : AppliedPrice – type de prix utilisé pour le calcul (Clôture, Typique, Pondéré, etc.) LineColor / Width / Style – personnalisation de la ligne VWAP SessionReset – remise à zéro quotidienne ou mode continu Fonctionnement (principe du
FREE
Dual Scale Candles
Mohamed Amr Mohamed Osama Abdelwahab
Dual Scale Candles superpose les vraies bougies d'un second symbole directement sur votre graphique, avec sa propre échelle de prix indépendante sur l'axe gauche. Comparez l'or à une devise, le pétrole à un indice, ou deux instruments quelconques sur un même graphique - chacun conserve ses prix réels. Les deux séries sont alignées au point de votre choix : la première barre du jour actuel affichée sur le graphique, la première barre de la semaine actuelle ou la plus ancienne barre affichée - su
FREE
RiskCockpit - conseiller de risque en temps réel pour comptes de prop-firm et comptes financés (FundedNext, FTMO, E8, The5ers, MyFundedFX) et comptes personnels/démo. C'est un INDICATEUR (un conseiller) : il affiche et propose ; il n'ouvre, ne modifie et ne ferme jamais un trade. LE PROBLÈME QU'IL RÉSOUT Un compte financé se perd rarement à cause d'une mauvaise stratégie - il se perd sur un seul clic d'inattention : un lot trop gros, un stop-loss oublié, un trade dans une fenêtre de news, une l
FREE
Show Pips for MT5
Roman Podpora
4.5 (32)
Cet indicateur d'information sera utile pour ceux qui veulent toujours être au courant de la situation actuelle du compte. VERSION MT 4 -   More useful indicators L'indicateur affiche des données telles que le profit en points, en pourcentage et en devise, ainsi que le spread pour la paire actuelle et le temps jusqu'à la fermeture de la barre sur la période actuelle. Il existe plusieurs options pour placer la ligne d'information sur le graphique : À droite du prix (passe derrière le prix) ; En c
FREE
Girassol Sunflower MT5 Indicator
Saullo De Oliveira Pacheco
3.86 (7)
This is the famous Sunflower indicator for Metatrader5. This indicator marks possible tops and bottoms on price charts. The indicator identifies tops and bottoms in the asset's price history, keep in mind that the current sunflower of the last candle repaints, as it is not possible to identify a top until the market reverses and it is also not possible to identify a bottom without the market stop falling and start rising. If you are looking for a professional programmer for Metatrader5, please
FREE
Stochastic   +   RSI   Multi-Timeframe   Dashboard   with   Momentum   Strength Need Trade Assistant? Trade Panel Pro MT 5 Please leave a review, if you like this.   OVERVIEW A   professional   multi-timeframe   dashboard   indicator   that   displays   Stochastic   Oscillator   and   RSI   (Relative   Strength   Index)   values   from   7   different   timeframes   simultaneously   on   a   single   compact   panel.   Perfect   for   scalpers   and   day   traders   who   need   quick   m
FREE
TradeVision Pro
Ian Nganga Comba
TradeVisonPro Forex Analyzer Pro Tableau de bord d’analyse et de suivi des comptes de trading MT5 TradeVisonPro Forex Analyzer Pro est une solution d’analyse du trading et de suivi des comptes conçue pour les utilisateurs de MetaTrader 5. Le produit organise les données de trading MT5 dans un tableau de bord web structuré, permettant aux traders de consulter les informations du compte, de surveiller les positions ouvertes, d’analyser l’historique des transactions, de suivre les stratégies, de te
FREE
Les acheteurs de ce produit ont également acheté
Trend Sniper X
Sarvarbek Abduvoxobov
4.86 (43)
Trend Sniper X est un indicateur de suivi de tendance multi-unités de temps pour MetaTrader 5 qui aide les traders à identifier la direction de la tendance et les points d'inversion potentiels avec clarté et précision. pour MT4: https://www.mql5.com/en/market/product/193245 Informations sur le prix : Le prix actuel est un prix promotionnel et est susceptible de changer lors des prochaines mises à jour et nouvelles fonctionnalités. Offre bonus : Pour obtenir GRATUITEMENT l'Auto-Trade Assistant E
Smart Trend Trading System — MetaTrader 5 Après votre achat, envoyez-moi un message sur MQL5 pour recevoir GRATUITEMENT Smart Universal Expert Advisor, ainsi que le cours en ligne, le manuel PDF et l’accès au groupe privé. STTS réunit la direction de la tendance, les signaux d’entrée et de sortie, les zones de retournement et les niveaux de prix importants directement sur votre graphique. Suivez le système manuellement ou connectez un EA compatible distinct pour une exécution automatique selon l
Un nouveau Roi en ville - Indicateur + Gestion des ordres (TP1 + TP2 + TP3) + Envoi optionnel de signaux Telegram INCLUS (GRATUIT) (SYSTÈME COMPLET DE TRADING et DE SIGNAUX) Notre meilleur EA pour l’Or : Gold Slayer Cet indicateur inclut une stratégie avancée, un système de trading avec gestion des ordres personnalisable ainsi qu’un système de retour à la moyenne combinant des extensions d’enveloppes, soutenu par plusieurs filtres intelligents de confirmation comme le RSI afin de détecter des en
Zoryk Gold
Reda El Koutbane
4.78 (18)
ZORYK — Système avancé de signaux XAUUSD pour MetaTrader 5 Vous connaissez certainement cette sensation. Vous passez du temps à analyser l’or. Vous attendez le bon point d’entrée. Vous ouvrez enfin la position, puis le prix commence immédiatement à évoluer contre vous. Vous fermez trop tôt, déplacez le Stop Loss ou hésitez pendant quelques secondes. Ensuite, le marché atteint exactement l’objectif que vous aviez initialement prévu, mais sans vous dans la position. Le problème n’était pas toujour
Ultra Indicator
Ihor Otkydach
5 (1)
ULTRA est un indicateur technique « tout-en-un » : il analyse le marché de manière autonome, génère des signaux de trading, affiche les niveaux permettant de définir des ordres stop-loss et suggère le moment opportun pour clôturer les positions afin de sécuriser les bénéfices ou de minimiser les pertes. En d'autres termes, peu importe que vous ne sachiez pas analyser le marché, déterminer les niveaux (où placer votre stop-loss) ou que vous ayez du mal à gérer votre capital. ULTRA s'occupera de t
Gardez votre avantage de trading dans votre ligne de mire ! M5 Sniper est un nouvel indicateur de MeanFX. Il combine des signaux de trading précis avec des niveaux de TP/SL adaptatifs — créant ainsi les meilleures opportunités de trading statistiques possibles ! Le prix augmente tous les 5 achats, le prochain prix est de 69$ Envoyez-moi un message après l’achat pour recevoir des conseils/un guide et un EA bonus Qu’est-ce qui le distingue ? Performance statistique éprouvée sur Gold XAUUSD ( fonct
En 2019, j'ai montré au monde entier ce dont cet indicateur est capable. J'ai tradé ses signaux manuellement, sur un compte réel, en toute transparence — le compte était suivi sur Myfxbook, et je relatais cette expérience en détail sur Facebook. Résultat : en quatre mois, 10 000 dollars sont devenus 941 411. Le risque était délibérément extrême — le drawdown allait jusqu'à 54 %, car dans notre métier, le profit et le risque vont toujours de pair. La capture d'écran de Myfxbook est la première im
SuperScalp Pro
Van Minh Nguyen
4.54 (37)
SuperScalp Pro - Professional Multi-Layer Confluence Scalping System SuperScalp Pro est un indicateur de scalping avancé qui améliore le Supertrend classique grâce à plusieurs filtres intelligents de confirmation. Il vous aide à identifier des opportunités de trading Buy/Sell présentant une probabilité de réussite plus élevée, tout en réduisant considérablement les faux signaux. Des flèches Buy et Sell bien visibles apparaissent directement sur le graphique, avec des niveaux de Stop Loss et de T
Gann Made Easy   est un système de trading Forex professionnel et facile à utiliser qui est basé sur les meilleurs principes de trading en utilisant la théorie de mr. WD Gann. L'indicateur fournit des signaux d'ACHAT et de VENTE précis, y compris les niveaux Stop Loss et Take Profit. Vous pouvez échanger même en déplacement en utilisant les notifications PUSH. VEUILLEZ ME CONTACTER APRÈS L'ACHAT POUR RECEVOIR GRATUITEMENT DES INSTRUCTIONS DE TRADING ET D'EXCELLENTS INDICATEURS SUPPLÉMENTAIRES! V
SMC Intraday Formula
VividMind Digital Solutions
5 (26)
Commençons par être honnêtes. Aucun indicateur ne vous rendra rentable à lui seul. Si quelqu’un vous dit le contraire, il vous vend un rêve. Tout indicateur qui affiche des flèches parfaites d’achat/vente peut être rendu impeccable — il suffit de zoomer sur la bonne partie de l’historique et de capturer uniquement les trades gagnants. Nous ne faisons pas cela.  SMC Intraday Formula est un outil. Il lit la structure du marché pour vous, identifie les zones de prix à la probabilité la plus élevée
M1 Sniper MT5
Oleg Rodin
5 (7)
M1 SNIPER   est un système d'indicateurs de trading facile à utiliser. Il s'agit d'un indicateur à flèche conçu pour l'unité de temps M1. Cet indicateur peut être utilisé seul pour le scalping sur l'unité de temps M1 ou intégré à votre système de trading existant. Bien que conçu spécifiquement pour le trading sur l'unité de temps M1, ce système peut également être utilisé avec d'autres unités de temps. Initialement, j'avais conçu cette méthode pour le trading du XAUUSD et du BTCUSD. Cependant, j
GoldenX Entry MT5
VividMind Digital Solutions
5 (17)
GoldenX Entry est un indicateur MT5 doté d’un algorithme adaptatif Smart Entry Trend, d’un système de scoring des signaux, d’un détecteur de régime de marché et d’un filtre de volatilité. Chaque signal inclut un niveau d’entrée calculé, trois niveaux de Take-Profit (TP1, TP2, TP3) ainsi qu’un niveau de Stop-Loss. Il est construit sur plusieurs couches analytiques conçues pour s’adapter à différentes conditions de marché, combinant un système analytique multicouche avec un optimiseur intégré et u
Gold Entry Sniper
Tahir Mehmood
5 (21)
Gold Entry Sniper – Tableau de Bord ATR Multi-Unités de Temps pour Scalping et Swing Trading sur l'Or Gold Entry Sniper est un indicateur avancé pour MetaTrader 5 qui fournit des signaux d'achat/vente précis sur XAUUSD et autres actifs, basé sur la logique de Trailing Stop ATR et l' analyse multi-unités de temps . Caractéristiques et Avantages Clés Analyse Multi-Unités de Temps – Affiche les tendances en M1, M5, M15 sur un seul tableau. Trailing Stop Basé sur l'ATR – Ajuste automatiquement selon
Gold Trend Coach MT5
Cristhian Alexander Gaibor Cuasquer
5 (4)
Gold Trend Coach est un indicateur de tendance pour l'or (XAUUSD) sur MetaTrader 5 avec des signaux d'achat et de vente, un stop loss et trois take profit confirmés à la clôture de la bougie (sans repaint), un coach qui vous guide de l'entrée jusqu'au TP3, un tableau multi-timeframe et des alertes sur votre téléphone et sur Telegram. Conçu pour le scalping en M1 et M5 et l'intraday en M15 pendant les sessions de Londres et de New York. BONUS : EA d'auto-trading GRATUIT pour Gold Trend Coach. Écr
Prochaine mise à jour — Version 2.52 bientôt disponible ! [NOUVEAU] Préparez-vous à découvrir 4 nouvelles fonctionnalités majeures conçues pour améliorer votre analyse du marché et votre flux de travail de trading Nous faisons passer l’analyse du marché au niveau supérieur avec 4 nouvelles fonctionnalités conçues pour répondre à vos besoins en trading. Découvrez : 1. TRADE OVERVIEW DASHBOARD 2. CONFLUENCE AT ZONE 3. STRONG & WEAK HIGH/LOW 4. OTE 1. TRADE OVERVIEW DASHBOARD Un tableau de bord qu
Atomic Analyst MT5
Issam Kassas
4.5 (64)
Atomic Analyst — MetaTrader 5 Après votre achat, envoyez-moi un message sur MQL5 pour recevoir GRATUITEMENT Smart Universal Expert Advisor, ainsi que le cours en ligne, le manuel PDF et l’accès au groupe privé. Atomic Analyst réunit l’action des prix, la direction de la tendance, les signaux d’entrée et de sortie, le Stop Loss et plusieurs niveaux de Take Profit directement sur votre graphique. REPÉREZ LE SIGNAL. COMPRENEZ LA CONFIGURATION. Atomic Analyst présente son analyse sous forme d’inform
Adaptive Price Action Engine Achetez un indicateur, obtenez l'EA gratuitement Analyse auto-optimisée des tendances et des figures de chandeliers Multi-Timeframe Les marchés évoluent constamment, et tous les modèles de Price Action n’ont pas la même valeur dans toutes les conditions de marché. Adaptive Price Action Engine a été conçu pour s’adapter aux changements du marché en combinant structure de tendance, analyse Multi-Timeframe, figures de chandeliers et optimisation statistique au sein d’un
ARICoins
Temirlan Kdyrkhan
ARICoin is a powerful trading companion designed to generate high-probability entry signals with dynamic TP/SL/DP levels based on volatility. Built-in performance tracking shows win/loss stats, PP1/PP2 hits, and success rates all updated live. Key Features: Buy/Sell signals with adaptive volatility bands Real-time TP/SL/DP levels based on ATR Built-in MA Filter with optional ATR/StdDev volatility Performance stats panel (Success, Profit/Loss, PP1/PP2) Alerts via popup, sound, push, or email Cust
Boba Analysis Suite
Trade Ready Solutions LLC
5 (2)
Boba Analysis Suite Boba Analysis Suite est un indicateur d’analyse pour MetaTrader 5. Il réunit la structure du marché, les zones de prix pertinentes et le contexte général du marché dans une même vue graphique. Développé à partir de l’expérience pratique d’un trader et formateur en trading, il accompagne une démarche d’analyse structurée : évaluer la direction du marché, identifier les niveaux importants et analyser plusieurs unités de temps conjointement. Une analyse en contexte La significat
ScalpPoint
Temirlan Kdyrkhan
ScalpPoint is a powerful trading companion designed to generate high-probability entry signals with dynamic TP/SL/DP levels based on volatility. Built-in performance tracking shows win/loss stats, PP1/PP2 hits, and success rates — all updated live. Key Features: Buy/Sell signals with adaptive volatility bands Real-time TP/SL/DP levels based on ATR Built-in MA Filter with optional ATR/StdDev volatility Performance stats panel (Success, Profit/Loss, PP1/PP2) Alerts via popup, sound, push, or emai
Auto Optimized SpeedAngle est un système de vectorisation du momentum de niveau institutionnel qui élimine l'ajustement de courbe ( curve-fitting ) grâce à une optimisation continue par avancement ( Walk-Forward Optimization , WFO). Plutôt que de s'appuyer sur des entrées statiques qui se dégradent lorsque les régimes de marché changent, l'indicateur recalibre dynamiquement ses paramètres en utilisant une validation hors échantillon ( Out-of-Sample , OOS), garantissant ainsi que les signaux affi
Zain Gold Scalping
Ahmed Gamal Abdel Nasser Mohamed
A complete price-action analysis tool built around dual independent entry logic, each confirmed against a volatility band, combined with a configurable set of nine optional confirmation filters that let you shape exactly how conservative or aggressive the tool's signals behave. Core Strategy Two independent entry setups, each triggering only when price moves outside a dynamic volatility band — giving two distinct ways to spot potential reversal points, which can be used together or separately.
Tokyo mt5 Indicator
Vasiliy Strukov
5 (14)
Le Tokyo Indicator offre une vue d'ensemble visuelle et claire de l'orientation de la tendance, des signaux de trading potentiels et des conditions du marché. Sa ligne de tendance en escalier, codée par couleur, distingue les phases haussières (en bleu) des phases baissières (en magenta). Des flèches directionnelles associées mettent en évidence les opportunités d'achat et de vente potentielles lors des changements de tendance. Un tableau de bord intégré regroupe le signal actuel, l'orientation
Azimuth Pro
Ottaviano De Cicco
5 (7)
Azimuth Pro V2: Synthetic Fractal Structure and Confirmed Entries for MT5 Overview Azimuth Pro is a multi-level swing structure indicator by Merkava Labs . Four nested swing layers, swing-anchored VWAP, ABC pattern detection, three-timeframe structural filtering, and closed-bar confirmed entries — one chart, one workflow from micro-swings to macro-cycles. This is not a blind signal product. It is a structure-first workflow for traders who care about location, context, and timing. Halloween P
Superhero
Ihor Otkydach
5 (3)
L'indicateur SUPERHERO est un système de trading multidevises conçu selon un principe « tout compris ». Cet indicateur analyse le marché de manière autonome et fournit des signaux indiquant quand ouvrir et clôturer des positions. Il utilise des ordres Stop Loss et Take Profit. Le rapport R:R est de 1:1. Ce système peut envoyer des notifications push sur votre smartphone, ce qui vous permet de passer des ordres « où que vous soyez », sans avoir à rester devant un ordinateur. C'est la solution idé
Indicateur de force et de momentum multi-devises MT5 Dynamic Forex28 Navigator est l'évolution de nos indicateurs populaires de longue date et réunit la puissance de trois outils en un : Advanced Currency Strength28 Indicator (700 avis) Advanced Currency IMPULSE with ALERT (530 avis) CS28 Combo Signals (bonus actuel) Les deux indicateurs précédents totalisent plus de 1 200 avis sur le MQL5 Market et font partie des outils incontournables de la communauté MT4 depuis 2016. Dynamic Forex28 Navigato
Volatility Master for MetaTrader is a real-time dashboard tool that scans up to  50 symbols  to identify high-volatility , trending markets instantly. With bullish/bearish signals, customizable alerts, and a user-friendly interface, it helps you avoid range-bound conditions and focus on high-probability trades. Clarity leads to confidence. Trade confidently and protect your capital effectively with this powerful dashboard. We don't offer free or bonus indicators in exchange of reviews from you.
Apex Patterns PRO Achetez l'indicateur - Obtenez GRATUITEMENT l'Expert Advisor basé sur celui-ci. Intelligence auto-optimisée des figures chartistes et des cassures Les scanners de figures traditionnels s'appuient sur des paramètres fixes, sous-performant souvent lorsque la volatilité et les structures du marché changent. Apex Patterns PRO est conçu pour s'adapter aux conditions changeantes du marché en combinant la reconnaissance des figures chartistes structurelles, le filtrage du momentum et
Neuro Poseidon MT5
Daria Rezueva
4.68 (53)
Neuro Poseidon is a new indicator by Daria Rezueva. It combines precise trading signals with adaptive TP/SL levels - creating best possible trades as a result! Message me and get  Neuro Poseidon Assistant  as a gift to automize your trading process! What makes it stand out? 1. Proven profitability on all assets and timeframes 2. Only confirmed BUY and SELL signals present on the chart 3. Adaptive TP & SL levels generated by the software for each trade 4. Easy to understand - suitable for al
Break and Retest Hunter is a powerful MetaTrader 5 indicator designed to automatically identify support and resistance levels, breakout structures, and potential retest opportunities in real time. Bonus Indicator: After purchasing Break and Retest Hunter , contact me to receive Trade Indicator Assistant EA completely free as a bonus utility. $65 for the next 10 copies . Next price is $120.  Combining adaptive market analysis, clear BUY/SELL signals, Fibonacci-based profit targets, and a premiu
Plus de l'auteur
Rudy Bank
Brian Mwangi Ngugi
Volumetric Order Blocks + Market Structure Smart Money order block detection, volume-weighted confirmation, full BOS/CHoCH market structure. Version 1.33: Added  Fair Value Gaps, Premium/Discount/Equilibrium zones, multi-timeframe highs & lows, and Accumulation/Distribution zones. Overview Rudy Bank finds and draws institutional order blocks directly on your chart, then backs every one of them up with real market data: volume, internal buy/sell activity, and precise market-structure context, so
Session Highs and Lows Essential market levels. Clear. Simple. Powerful. Daily & Weekly Levels is a lightweight and fully customizable MetaTrader 5 indicator that automatically plots important reference levels directly on your chart. No complicated calculations or unnecessary clutter, just the levels you need to quickly understand the previous day's and week's price range. Key Levels The indicator can display: Daily Open Previous Day High Previous Day Low Previous Week High Previous Week Low
FREE
Iron Entry
Brian Mwangi Ngugi
Iron Entry — Real-Time Signal Engine with Trend Filter & Momentum Candles Why You Should Choose This Indicator Most signal tools redraw their arrows after the fact, by the time you notice a "signal," it's already changed or vanished. Iron Entry doesn't do that. This indicator locks in its pivots and signals the moment they close, and once printed, they never move, disappear, or repaint.  What you see live is exactly what stays on your chart tomorrow, next week, and next year. That means you c
SupplyDemand Edge
Brian Mwangi Ngugi
Supply and Demand + Market Structure Smart Money order block detection, volume-weighted confirmation, and full BOS/CHoCH market structure Check out Rudy Bank for more features: https: // www.mql5.com/en/market/product/193059 Check out Iron Entry for zone entry confirmations: https: // www.mql5.com/en/market/product/193937 Overview SupplyDemand Edge finds and draws institutional supply and demand order blocks directly on your chart, then backs every one of them up with real market data — volume
Filtrer:
Aucun avis
Répondre à l'avis