DinexSpace Volume Profile

  • Indicateurs
  • Huu Tho Tran
    Huu Tho Tran
    DinexSpace - studio d'automatisation du trading pour MetaTrader 5.
    Nous validons votre idée de trading avec des coûts réels en deux étapes avant de la coder. Si l'idée échoue, nous arrêtons - vous ne payez pas le robot.
    Historique en réel
  • Version: 1.0

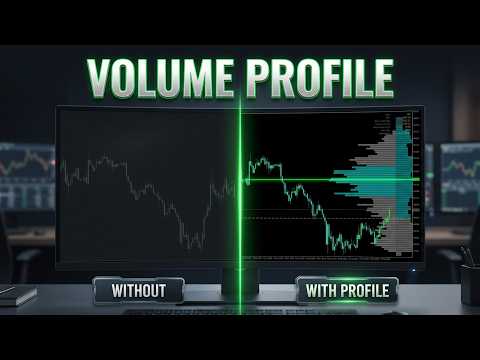
Volume Profile shows where volume has built up by price over the last N bars. It draws a horizontal histogram to the right of the last bar and marks three reference levels: the Point of Control, and the high and low of the Value Area.


How it works

- The price range of the last N bars (200 by default) is split into rows (40 by default).

- Each bar's volume is spread evenly over its high-low range and added to the rows it touches. You can use tick volume (always available in MT5) or real volume where the broker provides it.

- The POC (Point of Control) is the row with the most volume.

- The Value Area grows from the POC one row at a time toward the busier neighbour until it holds the chosen share of total volume (70% by default). Its edges are drawn as VAH and VAL.

- Value Area rows are drawn in a brighter colour. A panel lists the POC, VAH, VAL, the share actually covered and the row size.

- The profile is rebuilt once per new bar.


Inputs

- Profile: bars, rows, Value Area percent, volume source.

- Display: profile width and gap, colours, panel and its corner.


Limits

- The profile is an estimate built from chart bars, not from tick-by-tick data. A lower timeframe gives a finer profile of the same period.

- Tick volume counts price changes, not traded contracts. It is a common proxy on forex and CFDs, but it is not exchange volume.

- If real volume is selected and the broker does not provide it, the panel says so and nothing is drawn.


The indicator only draws levels and statistics. It does not trade or give signals.
Produits recommandés
Volume Profile FREE — Multi-Session Heatmap (POC · VAH · VAL) See where trading activity actually occurs—not just where price moves. This indicator builds a clear, color-coded Volume Profile Heatmap directly on your chart and highlights the market's most important price levels: the Point of Control (POC) and the Value Area (VAH/VAL) , where price is most likely to react.
FREE
Haven Volume Profile
Maksim Tarutin
4.64 (14)
Haven Volume Profile est un indicateur multifonctionnel pour l'analyse du profil de volume qui aide à identifier les niveaux de prix clés basés sur la répartition du volume de négociation. Il a été conçu pour les traders professionnels qui souhaitent mieux comprendre le marché et identifier les points d'entrée et de sortie importants pour leurs transactions. Autres produits ->  ICI Fonctionnalités principales : Calcul du Point of Control (POC) - le niveau d'activité commerciale maximal, ce qui a
FREE
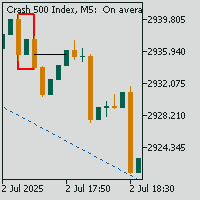
Here   our more valuable tools SMC Trend Trading   ,  Easy SMC Trading  ,  Institutional SMC Architect Volume Analysis Tools  ,  Volume flow Profile  ,  Market volume profile  , FVG with Volume  , Liquidity Heatmap Profile  ,  Volume Spread Analysis A professional spike pattern indicator built for synthetic traders who scalp and swing Crash 500/300/1000 with precision.  This indicator: Detects powerful 3-candle spike formations (Spike → Pullback → Spike) Automatically draws a clean box a
FREE
Session Profiles
Basharat Umar Khan
Short Description Draws rolling Time-Price-Opportunity (TPO) and footprint volume profiles for the Asia, London, and New York sessions with POC/VAH/VAL levels, delta volume bias, order flow overlays, liquidity heatmaps, developing rolling lines, Naked POC (NPOC) tracking, Initial Balance breakouts, multi-session confluence zones, and automatic broker GMT-offset detection. Full Description Plots separate market-profile and volume-profile style histograms for the three major trading sessions (Asi
FREE
The Horizontal Ray Tool is a lightweight, professional charting utility designed to streamline support and resistance mapping on MetaTrader 5. It brings rapid, one-click horizontal level placement directly to your live chart, eliminating the workspace clutter associated with infinite horizontal lines or manually drawn trendlines. Key Features: Interactive On-Screen Button: Spawns a clean, responsive "DRAW RAY" button docked directly on your chart canvas. A single click drops an independent hor
FREE
LM Volume Profile MT5 LM Volume Profile MT5 displays the distribution of calculated volume across price levels directly on the MetaTrader 5 chart. The indicator divides the selected price range into configurable price rows and displays the volume distribution as a horizontal histogram. It also calculates the Point of Control, Value Area High, Value Area Low, average profile price, and optional VWAP reference. Four profile modes are available: - Visible Range - Fixed Range - Session - Daily
FREE
BoxInside MT5
Evgeny Shevtsov
5 (4)
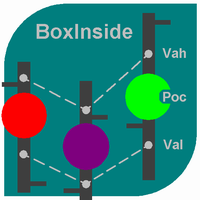
This indicator calculates the volume profile and places labels that correspond to the VAH, VAL and POC levels, for each candle individually. Indicator operation features The indicator works on the timeframes from M3 to MN, but it uses the history data of smaller periods: M1 - for periods from M3 to H1, M5 - for periods from H2 to H12, M30 - for the D1 period, H4 - for the W1 period, D1 - for the MN period. The color and location of the VAL, VAH and POC labels on the current candle are considere
FREE
Gold Max pro
Israr Hussain Shah
4 (1)
Here   our more valuable tools SMC Trend Trading   ,  Easy SMC Trading  ,  Institutional SMC Architect Volume Analysis Tools  ,  Volume flow Profile  ,  Market volume profile  , FVG with Volume  , Liquidity Heatmap Profile  ,  Volume Spread Analysis Automatic Professional Theme:   Instantly applies a high-contrast "Color on White" theme with DeepSkyBlue bull candles and Black bear candles for maximum clarity. Interactive Timeframe Panel:   21 vertical buttons on the left side allow for one-clic
FREE
Mirror Chart MT5
Andrej Hermann
5 (1)
The Mirror Chart MT5 is a overlay indicator specifically designed to project a second financial instrument directly onto the main chart window. This tool is invaluable for traders who rely on correlation analysis, as it visualizes the price movements of two different instruments in real time. Unlike traditional overlays, this indicator utilizes intelligent, dynamic centering and scaling logic. It continuously analyzes the visible price range in the current window for both symbols and calculates
FREE
Rolling vwap atr market panel
Florian Alain Bernard Jean-paul Pierre Cuiset
Rolling VWAP + Panel Rolling VWAP + Panel est un indicateur professionnel pour MetaTrader 5 conçu pour analyser la structure du marché à l’aide d’une VWAP roulante (Volume Weighted Average Price) combinée à des bandes de volatilité basées sur l’ATR , un panneau d’analyse du marché en temps réel , ainsi qu’un timer intégré indiquant le temps restant sur la bougie . Cet indicateur fournit une vision claire et structurée du comportement du prix par rapport à sa valeur moyenne pondérée, tout en off
FREE
Market Profile 3 ForexArby com
Hussien Abdeltwab Hussien Ryad
4 (15)
Market Profile 3 MetaTrader 5 indicator  version 4.70— is a classic Market Profile implementation that can show the price density over time, outlining the most important price levels, value area, and control value of a given trading session. This indicator can be attached to timeframes between M1 and D1 and will show the Market Profile for daily, weekly, monthly, or even intraday sessions. Lower timeframes offer higher precision. Higher timeframes are recommended for better visibility. It is als
FREE
Overview Market Volume Profile Modes is a powerful MT5 volume distribution indicator that integrates multiple Volume Profile variants. Users can switch between different analysis modes through a simple menu selection. This indicator helps traders identify key price levels, support and resistance zones, and market volume distribution. Core Concepts • POC (Point of Control): The price level with the highest volume concentration, representing the market's accepted "fair value" area • VAH (Value A
FREE
======================================================== GOLD WAVE LEVELS (ELLIOTT-ALIGNED) - MQL5/MT5 MARKET DESCRIPTION (formatting: **bold** = Bold button; lines with • = bullet list; UPPERCASE = heading) ======================================================== OVERVIEW ------------------------------------------------------- **Gold Wave Levels** draws a tested wave backbone for gold and validates signals against **Elliott theory hard-rules**, with higher-timeframe context and per-timeframe
FREE
Enhanced Volume Profile: The Ultimate Order Flow & Liquidity Analysis Tool Overview Enhanced Volume Profile is an indicator for MetaTrader 5 that displays the traded volume at specific price levels over a defined period. It separates the total volume into buy and sell components, presenting them as a side-by-side histogram on the chart. This allows users to observe the volume distribution and the proportion of buy and sell volumes at each price level. Graphics Rendering The indicator uses the
FREE
RM Volume Profile dessine un veritable Volume Profile et Market Profile (TPO) sur votre graphique — un profil par seance de trading — pour voir ou les transactions ont vraiment eu lieu et comment le POC (Point of Control) migre d'un jour a l'autre. Chaque seance affiche son POC et la Value Area (VAH/VAL), ainsi qu'un histogramme de volume optionnel. Affichez plusieurs seances precedentes a la fois pour suivre la migration du POC et reperer ou le marche a accepte ou rejete le prix. CARACTERIST
FREE
MicroScalper Timer
Gustavo Adolfo Ramirez
MicroScalper Timer is a premium, institutional-grade candle countdown utility designed for scalpers, day traders, and Prop Firm funded traders who demand absolute precision. Unlike standard timers that freeze when market volatility drops, this indicator is entirely independent of market ticks . Powered by an advanced OnTimer() engine, it updates flawlessly every real second, ensuring you know exactly when the next candle opens. What makes it truly unique is its built-in catalog of 10 Boutique Wa
AvgVolumes
Marco Montemari
5 (1)
This indicator is based on Volumes standard indicator, calculates the average of Volumes based on the last N bars set by users, and if the value of the volume is bigger then a set % respect the average a different color will be used. The indicator is shown in a separate indicator window. This version has now a limitation in setting the % about the threshold. If you are interested to set threshold consider to buy the PRO version ( https://www.mql5.com/en/market/product/35925 ) If you want to use
FREE
Alpine Volume Profile See where the real volume traded — not just where price moved. Alpine Volume Profile is an MQL5 indicator that transforms raw tick or exchange volume into a clean, readable horizontal histogram directly on your chart. Instead of a single volume bar at the bottom of the screen, you get a full breakdown of which price levels attracted the most trading activity, session by session. What It Does For every day, week, or fixed block of bars you choose, Alpine Volume Profile build
FREE
Deriv Synthetic HTF Candle Projection GMT2 Higher Timeframe Candle Projection & Previous Levels Tool for Deriv Synthetic Indices (MT5) Overview Deriv Synthetic HTF Candle Projection GMT2 is a professional MetaTrader 5 indicator built specifically for Deriv Synthetic indices . It projects the current forming Higher Timeframe (HTF) candle onto the chart and automatically draws key reference levels from previous candles. This indicator is designed to help traders maintain higher timeframe context
FREE
Ospe POC Volume Profile
Nur Azureen Binti Ab Aziz
A volume-at-price heatmap with POC, value area, estimated buy/sell pressure, confirmed signals and alerts. POC Volume Profile Heatmap is a MetaTrader 5 indicator that organizes historical volume across price levels. It identifies the Point of Control, displays the selected value area, and estimates buying and selling pressure at the POC. The indicator is intended for traders who use volume-at-price structure to study acceptance, rejection and interaction around high-activity price levels. It c

FREE
Cumulative Delta MT5
Evgeny Shevtsov
4.53 (62)
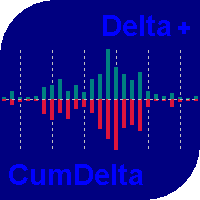
The indicator analyzes the volume scale and splits it into two components - seller volumes and buyer volumes, and also calculates the delta and cumulative delta. The indicator does not flicker or redraw, its calculation and plotting are performed fairly quickly, while using the data from the smaller (relative to the current) periods. The indicator operation modes can be switched using the Mode input variable: Buy - display only the buyer volumes. Sell - display only the seller volumes. BuySell -
FREE
Volume profile CVD Frato
Francisco Felipe Alves Da Silva Rocha
5 (2)
Frato Volume Profile Pro v7.5 Développé par Frato Academy Cet indicateur affiche le profil prix-volume pour MetaTrader 5. Il calcule la distribution du volume échangé par niveau de prix sur une période configurable et présente les résultats directement sur le graphique principal. Fonctionnalités : Profil de volume avec dégradé de couleurs L'indicateur divise la plage de prix en niveaux et attribue un volume correspondant à chaque niveau. La couleur de chaque niveau varie selon un dégradé c
FREE
Aggression Volume Profile
Edson Cavalca Junior
4.55 (11)
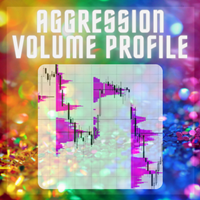
This indicator plots the volume profile by Price on the chart There are 5 ways to view it: By Total Volume Traded (Premium Version); Volume Ticks(Forex) Separated by Buyers and Sellers (Premium Version); Buyers Only (Premium Version); Sellers Only (Premium Version); Business balance (Buyers - Sellers) (Premium Version); . It is possible to select how many days the profiles will be calculated.( Premium Version) On the current day it recalculates the histogram data for each new candlestick.
FREE
Bookmap pro
Ahmed Mohammed Bakr Bakr
FREE Bookmap Volume Heatmap Indicator Overview The   Bookmap Volume Heatmap   is a custom MetaTrader 5 (MQL5) indicator that creates a visual heatmap of trading volume distribution across price levels, similar to professional trading platforms like Bookmap. It provides traders with a clear visualization of where significant trading activity has occurred within a specified price range. Key Features 1.   Volume Distribution Visualization Creates color-coded rectangles on the chart representing vol
FREE
Volume Profile Indicator – User Guide  Description: The Volume Profile Indicator is a powerful tool designed for MetaTrader 5. It visualizes market activity using volume distribution across price levels, showing: Histogram of volume at each price bin POC (Point of Control) – the price with the highest traded volume Value Area – the range covering a configurable percentage of volume (e.g. 70%) Support levels: Min, Max, and Pivot Average tick size for BUY and SELL movements  Inputs and Parameters:
FREE
Core Purpose ​ A permanent crosshair indicator designed exclusively for MetaTrader 5 (MT5). It addresses key limitations of MT5's default crosshair, including the need for manual activation, automatic disappearance on click, and solid lines obscuring price bars. This indicator optimizes chart analysis by delivering a smooth, professional-grade crosshair experience on MT5. ​ Key Features ​ Automatic activation: Enabled immediately after loading, replacing the default Ctrl+F function. The crossha
FREE
Volume de ticks de chaque barre divisé par sa moyenne sur l'historique. Les barres au-dessus du niveau de pic sont mises en évidence, montrant une activité inhabituelle. Caractéristiques principales Calculé sur les barres clôturées, les valeurs ne se redessinent pas Fonctionne sur tous les symboles et toutes les unités de temps Toutes les périodes, tous les niveaux et toutes les couleurs peuvent être modifiés dans les paramètres Léger en ressources grâce à un réglage du nombre maximal de barres
FREE
VP hidden
Emr Aljnaby
4.33 (12)
The indicator works to convert normal volume into levels and determine financial liquidity control points. It is very similar in function to Fixed Volume Profile. But it is considered more accurate and easier to use than the one found on Trading View because it calculates the full trading volumes in each candle and in all the brokers present in MetaTrade, unlike what is found in Trading View, as it only measures the broker’s displayed prices. To follow us on social media platforms: telegram
FREE
This indicator will mirror the assets in use in another metatrader, being able to choose the timeframe and a template. This is the Metatrader 5 Client, it needs the Metatrader 4 or 5 Server versions: Metatrader 4 Mirror Chart Server:   https://www.mql5.com/en/market/product/88644 Metatrader 5 Mirror Chart Server: https://www.mql5.com/en/market/product/88652 Details of how it works in the video.
FREE
Volume-to-Price Movement Oscillator (VP Oscillator) for MT5 The VP Oscillator highlights the balance (or imbalance) between trading volume and price movement, helping traders spot hidden accumulation, distribution, or weakening trends. How It Works: Calculates each bar’s price range (High–Low) and tick volume. Normalizes both values over a set period (default: 14). Plots the absolute difference between them ×100 — showing how closely price action aligns with trading activity. Interpretation: Hig
FREE
Les acheteurs de ce produit ont également acheté
Trend Sniper X
Sarvarbek Abduvoxobov
4.86 (42)
Trend Sniper X est un indicateur de suivi de tendance multi-unités de temps pour MetaTrader 5 qui aide les traders à identifier la direction de la tendance et les points d'inversion potentiels avec clarté et précision. pour MT4: https://www.mql5.com/en/market/product/193245 Informations sur le prix : Le prix actuel est un prix promotionnel et est susceptible de changer lors des prochaines mises à jour et nouvelles fonctionnalités. Offre bonus : Pour obtenir GRATUITEMENT l'Auto-Trade Assistant E
Un nouveau Roi en ville - Indicateur + Gestion des ordres (TP1 + TP2 + TP3) + Envoi optionnel de signaux Telegram INCLUS (GRATUIT) (SYSTÈME COMPLET DE TRADING et DE SIGNAUX) Notre meilleur EA pour l’Or : Gold Slayer Cet indicateur inclut une stratégie avancée, un système de trading avec gestion des ordres personnalisable ainsi qu’un système de retour à la moyenne combinant des extensions d’enveloppes, soutenu par plusieurs filtres intelligents de confirmation comme le RSI afin de détecter des en
Smart Trend Trading System — MetaTrader 5 Après votre achat, envoyez-moi un message sur MQL5 pour recevoir GRATUITEMENT Smart Universal Expert Advisor, ainsi que le cours en ligne, le manuel PDF et l’accès au groupe privé. STTS réunit la direction de la tendance, les signaux d’entrée et de sortie, les zones de retournement et les niveaux de prix importants directement sur votre graphique. Suivez le système manuellement ou connectez un EA compatible distinct pour une exécution automatique selon l
Zoryk Gold
Reda El Koutbane
4.76 (17)
ZORYK — Système avancé de signaux XAUUSD pour MetaTrader 5 Vous connaissez certainement cette sensation. Vous passez du temps à analyser l’or. Vous attendez le bon point d’entrée. Vous ouvrez enfin la position, puis le prix commence immédiatement à évoluer contre vous. Vous fermez trop tôt, déplacez le Stop Loss ou hésitez pendant quelques secondes. Ensuite, le marché atteint exactement l’objectif que vous aviez initialement prévu, mais sans vous dans la position. Le problème n’était pas toujour
Gardez votre avantage de trading dans votre ligne de mire ! M5 Sniper est un nouvel indicateur de MeanFX. Il combine des signaux de trading précis avec des niveaux de TP/SL adaptatifs — créant ainsi les meilleures opportunités de trading statistiques possibles ! Le prix augmente tous les 5 achats, le prochain prix est de 69$ Envoyez-moi un message après l’achat pour recevoir des conseils/un guide et un EA bonus Qu’est-ce qui le distingue ? Performance statistique éprouvée sur Gold XAUUSD ( fonct
SuperScalp Pro
Van Minh Nguyen
4.54 (37)
SuperScalp Pro - Professional Multi-Layer Confluence Scalping System SuperScalp Pro est un indicateur de scalping avancé qui améliore le Supertrend classique grâce à plusieurs filtres intelligents de confirmation. Il vous aide à identifier des opportunités de trading Buy/Sell présentant une probabilité de réussite plus élevée, tout en réduisant considérablement les faux signaux. Des flèches Buy et Sell bien visibles apparaissent directement sur le graphique, avec des niveaux de Stop Loss et de T
SMC Intraday Formula
VividMind Digital Solutions
5 (26)
Commençons par être honnêtes. Aucun indicateur ne vous rendra rentable à lui seul. Si quelqu’un vous dit le contraire, il vous vend un rêve. Tout indicateur qui affiche des flèches parfaites d’achat/vente peut être rendu impeccable — il suffit de zoomer sur la bonne partie de l’historique et de capturer uniquement les trades gagnants. Nous ne faisons pas cela.  SMC Intraday Formula est un outil. Il lit la structure du marché pour vous, identifie les zones de prix à la probabilité la plus élevée
GoldenX Entry MT5
VividMind Digital Solutions
5 (17)
GoldenX Entry est un indicateur MT5 doté d’un algorithme adaptatif Smart Entry Trend, d’un système de scoring des signaux, d’un détecteur de régime de marché et d’un filtre de volatilité. Chaque signal inclut un niveau d’entrée calculé, trois niveaux de Take-Profit (TP1, TP2, TP3) ainsi qu’un niveau de Stop-Loss. Il est construit sur plusieurs couches analytiques conçues pour s’adapter à différentes conditions de marché, combinant un système analytique multicouche avec un optimiseur intégré et u
La légende est de retour : Entry Points Pro 10. La relance de l'indicateur légendaire qui s'est maintenu 3 ans dans le Top-3 du MQL5 Market. Plus de 600 avis sur les deux versions, des milliers de traders l'utilisent chaque jour, plus de 28 000 téléchargements de la démo   MT4+MT5 . J'ai lu chacun de vos avis publiés en cinq ans — et au lieu de promettre, j'ai intégré les réponses directement dans la version 10. Par un auteur présent sur les marchés depuis 1999, qui tient à l'honnêteté, à sa rép
Auto Optimized SpeedAngle est un système de vectorisation du momentum de niveau institutionnel qui élimine l'ajustement de courbe ( curve-fitting ) grâce à une optimisation continue par avancement ( Walk-Forward Optimization , WFO). Plutôt que de s'appuyer sur des entrées statiques qui se dégradent lorsque les régimes de marché changent, l'indicateur recalibre dynamiquement ses paramètres en utilisant une validation hors échantillon ( Out-of-Sample , OOS), garantissant ainsi que les signaux affi
Gann Made Easy   est un système de trading Forex professionnel et facile à utiliser qui est basé sur les meilleurs principes de trading en utilisant la théorie de mr. WD Gann. L'indicateur fournit des signaux d'ACHAT et de VENTE précis, y compris les niveaux Stop Loss et Take Profit. Vous pouvez échanger même en déplacement en utilisant les notifications PUSH. VEUILLEZ ME CONTACTER APRÈS L'ACHAT POUR RECEVOIR GRATUITEMENT DES INSTRUCTIONS DE TRADING ET D'EXCELLENTS INDICATEURS SUPPLÉMENTAIRES! V
ARIPoint
Temirlan Kdyrkhan
1 (4)
ARIPoint is a powerful trading companion designed to generate high-probability entry signals with dynamic TP/SL/DP levels based on volatility. Built-in performance tracking shows win/loss stats, PP1/PP2 hits, and success rates all updated live. Key Features: Buy/Sell signals with adaptive volatility bands Real-time TP/SL/DP levels based on ATR Built-in MA Filter with optional ATR/StdDev volatility Performance stats panel (Success, Profit/Loss, PP1/PP2) Alerts via popup, sound, push, or email Cu
Adaptive Price Action Engine Achetez un indicateur, obtenez l'EA gratuitement Analyse auto-optimisée des tendances et des figures de chandeliers Multi-Timeframe Les marchés évoluent constamment, et tous les modèles de Price Action n’ont pas la même valeur dans toutes les conditions de marché. Adaptive Price Action Engine a été conçu pour s’adapter aux changements du marché en combinant structure de tendance, analyse Multi-Timeframe, figures de chandeliers et optimisation statistique au sein d’un
M1 Sniper MT5
Oleg Rodin
5 (7)
M1 SNIPER   est un système d'indicateurs de trading facile à utiliser. Il s'agit d'un indicateur à flèche conçu pour l'unité de temps M1. Cet indicateur peut être utilisé seul pour le scalping sur l'unité de temps M1 ou intégré à votre système de trading existant. Bien que conçu spécifiquement pour le trading sur l'unité de temps M1, ce système peut également être utilisé avec d'autres unités de temps. Initialement, j'avais conçu cette méthode pour le trading du XAUUSD et du BTCUSD. Cependant, j
Tokyo mt5 Indicator
Vasiliy Strukov
5 (12)
Le Tokyo Indicator offre une vue d'ensemble visuelle et claire de l'orientation de la tendance, des signaux de trading potentiels et des conditions du marché. Sa ligne de tendance en escalier, codée par couleur, distingue les phases haussières (en bleu) des phases baissières (en magenta). Des flèches directionnelles associées mettent en évidence les opportunités d'achat et de vente potentielles lors des changements de tendance. Un tableau de bord intégré regroupe le signal actuel, l'orientation
Gold Entry Sniper
Tahir Mehmood
5 (21)
Gold Entry Sniper – Tableau de Bord ATR Multi-Unités de Temps pour Scalping et Swing Trading sur l'Or Gold Entry Sniper est un indicateur avancé pour MetaTrader 5 qui fournit des signaux d'achat/vente précis sur XAUUSD et autres actifs, basé sur la logique de Trailing Stop ATR et l' analyse multi-unités de temps . Caractéristiques et Avantages Clés Analyse Multi-Unités de Temps – Affiche les tendances en M1, M5, M15 sur un seul tableau. Trailing Stop Basé sur l'ATR – Ajuste automatiquement selon
Prochaine mise à jour — Version 2.52 bientôt disponible ! [NOUVEAU] Préparez-vous à découvrir 4 nouvelles fonctionnalités majeures conçues pour améliorer votre analyse du marché et votre flux de travail de trading Nous faisons passer l’analyse du marché au niveau supérieur avec 4 nouvelles fonctionnalités conçues pour répondre à vos besoins en trading. Découvrez : 1. TRADE OVERVIEW DASHBOARD 2. CONFLUENCE AT ZONE 3. STRONG & WEAK HIGH/LOW 4. OTE 1. TRADE OVERVIEW DASHBOARD Un tableau de bord qu
Boba Analysis Suite
Trade Ready Solutions LLC
5 (2)
Boba Analysis Suite Boba Analysis Suite est un indicateur d’analyse pour MetaTrader 5. Il réunit la structure du marché, les zones de prix pertinentes et le contexte général du marché dans une même vue graphique. Développé à partir de l’expérience pratique d’un trader et formateur en trading, il accompagne une démarche d’analyse structurée : évaluer la direction du marché, identifier les niveaux importants et analyser plusieurs unités de temps conjointement. Une analyse en contexte La significat
FiboSniper Pro
Van Minh Nguyen
5 (4)
FiboSniper Pro – Multi-Filter Fibonacci System with Auto SL/TP and Control Panel FiboSniper Pro est un indicateur technique qui combine des Fibonacci Envelopes dynamiques avec plusieurs filtres de confirmation afin de générer des signaux Buy et Sell sélectionnés. Les niveaux de Fibonacci sont calculés à partir de Moving Average et ATR, puis filtrés par ADX, EMA, RSI, ATR, Volume, Time et la structure des bougies. L’indicateur affiche directement sur le graphique les niveaux automatiques de Stop
Break and Retest Hunter
Mohamed Hassan
3.67 (3)
Break and Retest Hunter is a powerful MetaTrader 5 indicator designed to automatically identify support and resistance levels, breakout structures, and potential retest opportunities in real time. Bonus Indicator: After purchasing Break and Retest Hunter , contact me to receive Trade Indicator Assistant EA completely free as a bonus utility. $65 for the next 10 copies . Next price is $120.  Combining adaptive market analysis, clear BUY/SELL signals, Fibonacci-based profit targets, and a premiu
Trend Catcher ind mt5
Ramil Minniakhmetov
5 (18)
INDICATEUR DE DÉTECTEUR DE TENDANCE L'indicateur de détecteur de tendance analyse les mouvements de prix du marché grâce à une combinaison d'indicateurs d'analyse de tendance adaptatifs, propriétaires et personnalisés. Il identifie la véritable direction du marché en filtrant les fluctuations à court terme et en se concentrant sur la force de la dynamique sous-jacente, l'expansion de la volatilité et la structure des prix. Il utilise également une combinaison d'indicateurs personnalisés de lis
Power Candles MT5
Daniel Stein
4.58 (12)
Power Candles V3 - Indicateur de force à optimisation automatique Power Candles V3 transforme la force des devises et des instruments en un plan de trading exploitable sur chaque graphique auquel il est associé. Au lieu de se contenter de colorer les bougies, il effectue une optimisation automatique en temps réel en arrière-plan et vous fournit les meilleurs niveaux de Stop Loss, Take Profit et seuils de signal pour le symbole que vous avez sous les yeux. Un simple clic suffit pour l'adopter en
Gold Trend Coach MT5
Cristhian Alexander Gaibor Cuasquer
5 (2)
Gold Trend Coach est un indicateur de tendance pour l'or (XAUUSD) sur MetaTrader 5 avec des signaux d'achat et de vente, un stop loss et trois objectifs de take profit, confirmés à la clôture de la bougie, un tableau de bord coach multi-unités de temps et des alertes sur votre téléphone et sur Telegram. Conçu pour le scalping en M5 et l'intraday en M15 pendant les sessions de Londres et de New York. Gold Trend Coach : signaux de tendance sur l'or XAUUSD avec entrée, stop et trois objectifs. Prix
Neuro Poseidon MT5
Daria Rezueva
4.75 (52)
Neuro Poseidon is a new indicator by Daria Rezueva. It combines precise trading signals with adaptive TP/SL levels - creating best possible trades as a result! Message me and get  Neuro Poseidon Assistant  as a gift to automize your trading process! What makes it stand out? 1. Proven profitability on all assets and timeframes 2. Only confirmed BUY and SELL signals present on the chart 3. Adaptive TP & SL levels generated by the software for each trade 4. Easy to understand - suitable for al
Unix Scalper
Issam Kassas
4 (4)
Unix Scalper — MetaTrader 5 Après votre achat, envoyez-moi un message sur MQL5 pour recevoir GRATUITEMENT Smart Universal Expert Advisor, ainsi que le cours en ligne, le manuel PDF et l’accès au groupe privé. Repérez la configuration. Consultez le plan. Choisissez comment intervenir. UNIX Scalper réunit l’analyse du marché, les décisions BUY/SELL/WAIT et les niveaux Entry, Stop Loss, TP1 et TP2 dans un panneau organisé. VISUALISEZ LE SIGNAL ET LE PLAN • Des décisions claires : BUY, SELL ou WAIT.
Présentation       Quantum Breakout PRO   , l'indicateur révolutionnaire MQL5 qui transforme la façon dont vous négociez les zones d'évasion ! Développé par une équipe de traders expérimentés avec une expérience commerciale de plus de 13 ans,       Évasion quantique PRO       est conçu pour propulser votre parcours commercial vers de nouveaux sommets grâce à sa stratégie de zone de discussion innovante et dynamique. Quantum Breakout Indicator vous donnera des flèches de signalisation sur les z
FX Trend MT5 NG
Daniel Stein
5 (6)
FX Trend NG : La Nouvelle Génération d’Intelligence de Tendance Multi-Marchés Vue d’ensemble FX Trend NG est un outil professionnel d’analyse de tendance multi-timeframe et de surveillance des marchés. Il vous permet de comprendre la structure complète du marché en quelques secondes. Au lieu de naviguer entre de nombreux graphiques, vous identifiez immédiatement quels instruments sont en tendance, où le momentum s’affaiblit et où plusieurs unités de temps sont alignées. Offre de Lancement – Ob
Indicateur de force et de momentum multi-devises MT5 Dynamic Forex28 Navigator est l'évolution de nos indicateurs populaires de longue date et réunit la puissance de trois outils en un : Advanced Currency Strength28 Indicator (700 avis) Advanced Currency IMPULSE with ALERT (530 avis) CS28 Combo Signals (bonus actuel) Les deux indicateurs précédents totalisent plus de 1 200 avis sur le MQL5 Market et font partie des outils incontournables de la communauté MT4 depuis 2016. Dynamic Forex28 Navigato
Scalper Vault est un système de trading puissant et complet, conçu pour les traders en quête de régularité dans le cadre du trading intrajournalier. Cet indicateur de haute précision constitue un système de trading autonome et exhaustif, offrant des analyses de qualité institutionnelle, aussi bien pour le Forex que pour les options binaires. VEUILLEZ ME CONTACTER APRÈS VOTRE ACHAT POUR OBTENIR MES CONSEILS DE TRADING AINSI QU'UN EXCELLENT BONUS ! En éliminant les incertitudes et les analyses man
Volatility Master for MetaTrader is a real-time dashboard tool that scans up to  50 symbols  to identify high-volatility , trending markets instantly. With bullish/bearish signals, customizable alerts, and a user-friendly interface, it helps you avoid range-bound conditions and focus on high-probability trades. Clarity leads to confidence. Trade confidently and protect your capital effectively with this powerful dashboard. We don't offer free or bonus indicators in exchange of reviews from you.
Plus de l'auteur
Swing High Low Levels marks confirmed swing highs and lows and extends each one to the right as a horizontal level until price breaks it. At a glance you can see which recent swings are still intact and which have already been taken out. How it works - A swing high is a bar whose high is above the highs of the bars on its left and not exceeded by the bars on its right (10 left and 5 right by default). A swing low works the same way with lows. - A swing is confirmed only after the bars on its ri
FREE
ATR Stop Levels draws price levels a chosen number of ATRs below and above the current price. It shows at a glance where a volatility-based stop would sit for a long or a short position, without measuring by hand. How it works - ATR (Average True Range) measures the typical bar range. You can smooth it with RMA (Wilder's original method), SMA or EMA. - Up to three multipliers (1.5, 2 and 3 by default). Each draws a dashed level below price and one above, with a label showing the price and the d
FREE
Daily and Previous Day Levels draws the reference levels intraday traders check every morning: the previous day's high, low and close, today's open, today's running high and low, and the previous week's high and low. How it works - Values come straight from the symbol's own D1 and W1 bars, so the day follows your broker's server day. - Each day gets its own line segment, from the day's first bar to its last. Past days stay readable and old lines never shift. You choose how many days to keep (5
FREE
Fibonacci Auto Levels draws Fibonacci retracement levels automatically, so you do not have to drag the Fibonacci tool by hand every time the chart moves. How it works - The indicator looks at the last N bars (100 by default) and finds the highest high and the lowest low. - The direction follows which extreme came last. - Low after the high: the last swing was down. Level 0 sits at the low and level 1 at the high, so the levels show how far price has bounced back up. - High after the low: the la
FREE
Heikin Ashi Smoothed draws a cleaner version of Heikin Ashi candles. Regular Heikin Ashi already averages prices to reduce noise; this version smooths twice, before and after the Heikin Ashi step, so small swings disappear and longer moves stand out. How it works 1. The bar's open, high, low and close are smoothed with an exponential moving average (length 10 by default). 2. Heikin Ashi candles are built from those smoothed prices: close = average of the four prices, open = midpoint of the prev
FREE
Round Number Levels draws horizontal lines at round prices around the current price, for example every 50 dollars on gold, every 100 pips on EURUSD or every 1,000 on Bitcoin. Many traders watch these "psychological" prices, so it is useful to have them on the chart without drawing them by hand. How it works - With the automatic step, the minor step is about one hundredth of the price, rounded to 1, 2 or 5 times a power of ten. Gold near 4,000 gives 50, EURUSD near 1.10 gives 0.01, and Bitcoin n
FREE
Average Daily Range (ADR) Panel shows how far a symbol usually travels in a day and how much of that typical range today has already covered. It is a quick way to judge whether today is quiet, normal or unusually active. How it works - The daily range is the D1 bar's high minus its low. ADR is the average of that range over the last 5, 10 and 20 completed days; today's unfinished day is not included. - Today's range is the current D1 bar's high minus its low so far. - "Used of ADR" is today's r
FREE
Pivot Points draws the classic floor-trader levels from the previous day, week or month: a central pivot plus resistance (R) levels above and support (S) levels below. Three common formulas are included. Formulas (H, L, C = previous period's high, low, close; P = (H + L + C) / 3; range = H - L) - Classic: R1 = 2P - L, S1 = 2P - H, R2/S2 = P ± range, R3 = H + 2(P - L), S3 = L - 2(H - P). - Fibonacci: P ± 0.382, 0.618 and 1.000 × range. - Camarilla: C ± range × 1.1/12, 1.1/6, 1.1/4 and 1.1/2 (R1-
FREE
Currency Strength Meter ranks the eight major currencies (USD, EUR, GBP, JPY, CHF, CAD, AUD, NZD) from strongest to weakest over a recent period. It uses all 28 pairs they form, so it shows whether a move belongs to one currency or to the other side of the pair. How it works - For each pair the indicator takes the percent change between the last closed bar and the bar N bars before it on the chosen timeframe (24 H1 bars by default). - A currency gains that change when it is the base of a pair a
FREE
Session Boxes draws the Asia (Tokyo), Europe (London) and US (New York) trading sessions as rectangles on an intraday chart. Each box spans the session's high and low, so you can see where each market traded, how wide the range was and where sessions overlap. How it works - Session hours are entered in each market's local time (Tokyo 09:00-18:00, London 08:00-17:00 and New York 08:00-17:00 by default). - UK and US daylight saving are applied automatically, so the boxes stay on the right bars al
FREE
Risk to Lot Calculator turns "how much am I willing to lose on this trade" into a lot size. It takes your contract data straight from the broker, so it works the same on forex, gold, indices and crypto CFDs. How it works - Risk per trade is a percent of your balance (or equity, or a manual amount) or a fixed amount in the account currency. - The stop loss can be a price, a distance in points or a multiple of ATR. - The loss for 1.00 lot at the stop is the stop distance divided by the tick size,
FREE
ATR Trailing Stop Line draws where a volatility-based trailing stop would sit. For a long position the line stays a fixed number of ATRs below the highest point reached. For a short position it stays above the lowest point. The line only moves in the position's favour and never moves back. How it works - ATR (Average True Range, Wilder's smoothing) measures the typical bar range. The line sits a chosen multiple of it (3 by default) away from price. - On each bar the line is pulled up (long side
FREE
Inside/Outside Bar Highlighter colours two common candle patterns so they are easy to spot on any chart: - Inside bar: the bar's high is below the previous high and its low is above the previous low. The range has contracted inside the previous bar. - Outside bar: the bar's high is above the previous high and its low is below the previous low. The range has expanded beyond the previous bar on both sides. How it works - The indicator draws a coloured candle on top of each matching bar. Inside ba
FREE
Opening Range Levels marks the high, low and middle of the opening range, the first minutes of a session you choose, and carries those levels through the rest of the day. How it works - You set the window and its time zone: New York (default 09:30-10:00), London, Tokyo or your broker's server time. - US and UK daylight saving are applied automatically. Your broker's server offset is detected from the terminal; most brokers shift their clock with US daylight saving, which is the default, and a f
FREE
Previous Session High Low Alerts marks the high and low of the last completed trading session and alerts you when price comes back to them. Many traders watch where the previous Asian, London or New York session topped and bottomed. This indicator draws those levels and notifies you when they are touched. How it works - You set one session by its start and end in server time (default 10:00-19:00, which matches London hours on many brokers whose servers run at GMT+2/+3). Sessions may run past mi
FREE
Session and Anchored VWAP plots the volume-weighted average price (VWAP), the average price paid in a period weighted by volume. Two versions are included: one that resets every day, week or month, and one anchored at a moment you choose. How it works - Periodic VWAP: starts fresh at the beginning of each day (broker server time), each week (Monday) or each month, and accumulates price × volume from there. - Up to two bands at a chosen number of standard deviations show how far price has moved
FREE
Drawdown Monitor keeps an eye on your account and tells you how deep the current drawdown is. Its alerts fire before a bad day turns into a worse one. How it works - DD from peak: how far equity is below its highest value. The peak is stored in a terminal global variable per account, so it survives restarts. It can be reset with an input. - Floating DD: how far equity is below balance, which is the loss on open positions. - Today DD: how far equity is below the equity at the start of the server
FREE
Multi-Timeframe Trend Panel shows, in one small panel, what a moving average is doing on four timeframes at once (M15, H1, H4 and D1 by default). You can see whether the timeframes agree without switching charts. How it works - For each timeframe the indicator reads the moving average (EMA 50 by default) on the last closed bar and on the bar a few bars before it (5 by default). - The change between the two is compared with ATR(14) of the same timeframe: - rising when the average went up by more
FREE
ATR Volatility Percentile answers a simple question: is the market quiet or busy compared with its own recent past? Raw ATR values are hard to compare across symbols and periods. A percentile puts them on one 0-100 scale. How it works - ATR (Average True Range, Wilder's smoothing, length 14 by default) measures the typical bar range. - The indicator compares the current ATR with the previous N values (250 bars by default). The percentile is the share of those values that were lower than or equa
FREE
Correlation Matrix shows how closely up to six symbols have moved together. It helps to avoid holding several positions that are really the same bet, and to see when a usual relationship between markets breaks down. How it works - The reference bars are the last N closed bars (60 by default) of the chosen timeframe (D1 by default) on the chart symbol. - For each symbol the indicator finds the bar at the same time with iBarShift and takes its return, so symbols with different trading hours are c
FREE
Watchlist Scanner puts the key numbers of up to 20 symbols in one panel on any chart, so you can compare markets without opening a chart for each. Columns - Last: current bid. - Chg %: change since the previous daily close, green when up and aqua when down. - Spread: current spread in points. - ATR D1 (%): the daily Average True Range over the last 14 completed days, in price and as a percent of price. It shows how much each symbol typically moves in a day, on a comparable scale. - Range/ATR: t
FREE
Day and Week Separators draws vertical lines at the start of each day, week and month on intraday charts, with an optional day-of-week label at each line. It is a small visual aid that makes it easier to see where one trading day ends and the next begins. How it works - Day, week and month separators each have their own switch, colour and line style. - When several periods start on the same bar, only the strongest line is drawn: month over week, week over day. - The trading day can start at the
FREE
Spread Monitor and Logger keeps a record of your broker's spread on the current symbol. It shows when spreads widen (rollover, news, quiet hours) and keeps a simple log you can open in a spreadsheet. How it works - Every second the indicator reads the current spread in points. A sample is only counted while the symbol is quoting (a new tick in the last minute), so closed hours do not pull the statistics down. - The panel shows the current spread, the average, minimum and maximum of the current
FREE
Market Sessions Clock is a small panel that shows, at a glance, which markets are open right now and when the next one opens or closes. How it works - Four sessions: Sydney, Tokyo, London and New York. Each has its own on/off switch and hours. - Hours are entered in each market's local time (for example 08:00-17:00 London), and daylight saving is applied automatically for Sydney, London and New York. - For every session the panel shows Open or Closed, the time left until it closes or until it n
FREE
Account Info Panel puts the numbers you check most often into one small panel on the chart, so you do not have to switch to the Trade tab. What it shows - Balance and equity. - Floating P/L of open positions. - Closed today: profit, swap, commission and fees of deals closed since the start of the server day. Deposits and withdrawals are excluded. - Margin used and free margin. - Margin level, highlighted when it falls below 200%. - Today's drawdown: how far equity is below its level at the star
FREE
Economic Calendar Marker shows when economic news is released, directly on your chart. Each event time gets a vertical line coloured by importance, so you can see at a glance which candles were moved by news and what is coming next. How it works - Events come from the economic calendar built into MetaTrader 5 (the Calendar tab of the terminal). The indicator uses the standard Calendar functions. - By default it shows the currencies of the chart symbol (for example EUR and USD on EURUSD, or USD
FREE
News Countdown Panel keeps the next important economic release in view. A small panel shows how long is left until the next event of the chart's currencies, so a news spike does not catch you by surprise. How it works - Events come from the economic calendar built into MetaTrader 5, through the standard Calendar functions. - By default it uses the currencies of the chart symbol (for example EUR and USD on EURUSD, or USD on gold). You can type your own list, such as "USD,GBP". - You choose the i
FREE
Spread and Swap Info shows the trading costs and timing details of the current symbol in a small panel, so beginners can check them without opening the symbol specification. What it shows - Spread in points, with "(fixed)" when the broker quotes a fixed spread. - Swap long / short with the right unit for the symbol's swap mode: points, a currency (base, margin or account currency), percent per year, or "reopen". When swaps are disabled or both are zero it shows "Swap: none". - Triple swap day,
FREE
Lot Size Script answers one question before a trade: how many lots can I open so that hitting my stop loss costs exactly the risk I chose? Drop it on a chart, fill in two numbers and read the answer. How it works - Risk is a percent of balance, a percent of equity, or a fixed amount in the account currency. - The stop loss is a distance in points or a stop-loss price. A price on the wrong side of the entry is rejected with a clear message. - The entry is the current ask (buy) or bid (sell) of t
FREE
Trade History Exporter is a script that saves your account's trading history to CSV files, so you can study your own results in Excel, Google Sheets or Python. It only reads history. What it writes (in MQL5\Files\DinexHistory\, via File → Open Data Folder) - Deals file, one row per deal: ticket, time, symbol, type (buy, sell, balance, commission …), entry (in, out, reverse, close by), volume, price, commission, swap, fee, profit, magic number, position ID and comment. - Positions file (optional
FREE
Filtrer:
Aucun avis
Répondre à l'avis