Forex Panda Dashboard MT5 Indicator

5
FOREXPANDA Performance Dashboard

A complete visual overview of your trading account — directly on your MetaTrader 5 chart.

Turn your account statistics into a clean, professional dashboard. FOREXPANDA Performance Dashboard helps you monitor trading results, drawdown, floating profit and loss, profitability metrics, daily performance, and account balance history in one convenient place.

Designed for traders who value clarity and efficient account monitoring, the dashboard brings essential performance information together in an attractive, customizable interface.

Also check out: forexpanda.net

KEY FEATURES 

1. Real-Time Account Overview

Monitor your account performance at a glance with dedicated panels displaying:

  • Results Today — today's performance using your selected calculation method.

  • Drawdown Today — today's drawdown percentage and monetary value.

  • Floating P/L — the current unrealized profit or loss of open positions.

  • Maximum Drawdown — the maximum drawdown percentage tracked by the dashboard.

  • Total Result — cumulative trading profit or loss.

  • Profit Factor — gross profit divided by gross loss.

  • Total Balance — your current account balance.

  • Total Deposits — deposits recorded in the available account history.

Green and red highlights make positive and negative results easy to distinguish, while visual gauges and percentage badges help you interpret performance quickly.

2. Daily Performance Table

Review your trading performance day by day in a dedicated calendar-style table.

The table displays daily drawdown, monetary results, and percentage results, making it easier to identify profitable days, losing days, and periods of inactivity.

Choose how many daily rows to display to suit your preferred layout.

3. Historical Performance Chart

Visualize your account performance over time with a configurable chart covering 7 to 90 days.

Choose between two chart modes:

  • Balance Curve — displays historical account balance development.

  • Cumulative Profit — displays cumulative trading profit with deposits excluded.

The chart helps you see periods of growth, flat performance, and changes in your account's historical results.

FULLY CUSTOMIZABLE DASHBOARD

Adapt the interface to your trading environment:

  • Three independent sections: Basic Info, Calendar Performance, and 30 Days Performance.

  • Light and Dark themes to match your preference.

  • Modern and Professional styles for different visual preferences.

  • Custom dashboard title and currency symbol.

  • Adjustable canvas width, height, position, and font sizes.

  • Configurable daily reset hour and performance calculation method.

  • Adjustable drawdown warning thresholds.

  • Optional chart styling to customize the appearance of the MT5 chart.

MULTIPLE DASHBOARDS ON ONE CHART

Want to monitor different account setups or compare performance displays?

You can attach multiple instances of FOREXPANDA Performance Dashboard to the same chart. Each instance automatically selects a unique dashboard object name, allowing several dashboards to coexist without using the same canvas name.

DESIGNED FOR MT5

FOREXPANDA Performance Dashboard is a chart-window indicator for MetaTrader 5. It focuses on presenting account-performance information in a convenient visual format.

It does not generate trading signals or automatically open and close trades. It is a monitoring tool designed to help you understand your account statistics more easily.

WHO IS IT FOR?

  • Traders who want a clear overview of account performance.

  • EA users who want to monitor their trading account visually.

  • Manual traders who want quick access to performance statistics.

  • Traders who appreciate historical balance and daily-result tracking.

  • Users who prefer a customizable dashboard over constantly checking account-history reports.

IMPORTANT INFORMATION

The dashboard displays account statistics calculated from the available trading history and current account data. Results depend on the selected calculation method, broker account data, trading history, and account activity.

Historical performance does not guarantee future results. This indicator is a monitoring and visualization tool, not financial advice or a guarantee of profitability.

FOREXPANDA Performance Dashboard — Your trading performance. Clearly visualized.

------------------------------------------------------------------------------------------------------------------------------------------------------------------------------------------------------------


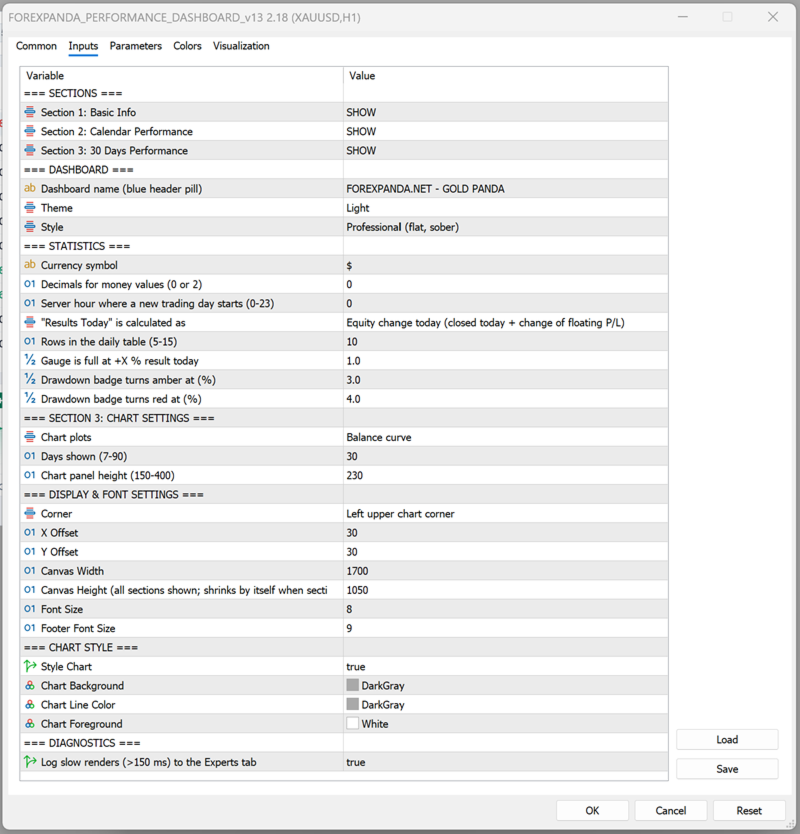
FOREXPANDA Performance Dashboard — Input Settings Guide

The indicator's inputs are organized into groups so you can customize the dashboard's content, calculations, appearance, and historical chart.

A. SECTIONS

Control which of the three dashboard sections are visible.

Input Description
Section 1: Basic Info Shows or hides the main performance statistics and account overview.
Section 2: Calendar Performance Shows or hides the daily performance table.
Section 3: 30 Days Performance Shows or hides the historical performance chart.

Available values: SHOW / HIDE.

You can disable sections you do not need. The dashboard automatically adjusts its height when sections are hidden.

B. DASHBOARD

Customize the dashboard's identity and visual appearance.

Input Description
Dashboard name Text displayed in the dashboard's header pill. For example, FOREXPANDA.NET - GOLD PANDA.
Theme Select Light or Dark.
Style Select Modern or Professional.

Theme options

  • Light: A light background with blue accents and contrasting text.

  • Dark: A dark interface with contrasting text and colored performance indicators.

Style options

  • Modern: Uses visual effects such as gradients, shadows, highlights, and rounded surfaces.

  • Professional: Uses a flatter, more restrained design with fewer decorative effects.

These options affect the dashboard's appearance, not the underlying trading performance.

C. STATISTICS

Configure how monetary values and daily performance are displayed and calculated.

Input Default Description
Currency symbol $ Text displayed before monetary amounts. Change it to match your preferred display currency. This changes the label, not the account's actual currency or converted values.
Decimals for money values 0 Choose 0 or 2 decimal places for displayed monetary values.
Server hour where a new trading day starts 0 Sets the server-time hour used to define a new trading day. Values range from 0 to 23.
Results Today calculation Equity change Select how today's result is calculated.
Rows in the daily table 10 Controls the number of daily rows displayed. Supported range: 5–15.
Gauge is full at +X% result today 1.0 Sets the positive daily result percentage at which the results gauge reaches its full scale.
Drawdown badge turns amber at (%) 3.0 Sets the drawdown threshold at which the badge changes to amber.
Drawdown badge turns red at (%) 4.0 Sets the drawdown threshold at which the badge changes to red.

Results Today calculation modes

Equity change today — default

Measures today's equity change, accounting for closed trading results and the change in floating profit or loss relative to the start of the day.

This is useful when you want today's result to reflect both realized and unrealized performance.

Closed trades only

Calculates today's result using closed trades only. Floating profit or loss from open positions is not included in this result calculation.

Closed trades + all floating P/L

Uses the alternative calculation method that combines today's closed results with all current floating profit or loss. Because existing open-position profit or loss can be included, this value may not represent only the change that occurred today.

Daily reset hour

The daily reset hour determines where the dashboard draws the boundary between trading days, using broker server time.

For example, setting the hour to 0 starts a new reporting day at server midnight. Setting it to 1 shifts the reporting boundary to 01:00 server time.

Choose a reset hour that matches your preferred reporting schedule.

Drawdown thresholds

The amber and red thresholds help you recognize increasing drawdown.

With the default settings:

  • Below 3%: normal badge color.

  • From 3% to below 4%: amber warning.

  • At 4% or above: red warning.

These thresholds are visual alerts, not automatic risk controls. The indicator does not close trades when a threshold is reached.

D. SECTION 3: CHART SETTINGS

Configure the historical chart displayed in the third dashboard section.

Input Default Description
Chart plots Balance curve Select the type of historical performance series to display.
Days shown 30 Sets the historical chart period. Supported range: 7–90 days.
Chart panel height 230 Controls the chart panel's height. Supported range: 150–400.

Chart plots

Balance curve

Displays the historical development of account balance.

Cumulative profit

Displays cumulative trading profit with deposits excluded. This helps distinguish trading performance from account growth caused by deposits.

Days shown

Use a shorter period for a more compact view of recent performance or a longer period to examine a broader historical trend.

Chart panel height

Increase the height when you want a larger chart, or reduce it to save space on your MT5 chart.

E. DISPLAY & FONT SETTINGS

Control the dashboard's placement, dimensions, and text size.

Input Default Description
Corner Left upper chart corner Selects the chart corner used as the positioning reference.
X Offset 30 Sets the horizontal distance from the selected corner.
Y Offset 30 Sets the vertical distance from the selected corner.
Canvas Width 1700 Sets the dashboard's design width.
Canvas Height 1050 Sets the dashboard's design height when all sections are shown.
Font Size 8 Controls the main dashboard font scaling.
Footer Font Size 9 Controls the footer text size.

Position and offsets

Choose the corner that best suits your chart layout. Adjust the X and Y offsets to move the dashboard away from candles, price labels, or other chart elements.

Canvas width and height

The canvas dimensions control the dashboard's overall layout. Adjust the width to fit your monitor and the height to accommodate your selected sections.

When sections are hidden, the dashboard automatically reduces its height as needed.

Font sizes

Increase the font sizes for better readability on high-resolution displays or larger monitors. Reduce them when you need a more compact layout.

The dashboard uses Arial for its text.

F. CHART STYLE

These inputs control the appearance of the underlying MetaTrader 5 chart.

Input Default Description
Style Chart true Enables or disables the indicator's chart styling.
Chart Background DarkGray Sets the chart background color when styling is enabled.
Chart Line Color DarkGray Sets the chart line color when styling is enabled.
Chart Foreground White Sets the chart foreground color when styling is enabled.

If you prefer to preserve your existing chart colors, disable Style Chart.

These settings concern the MT5 chart itself and are separate from the dashboard's Light/Dark theme.

G. DIAGNOSTICS

Input Default Description
Log slow renders (>150 ms) to the Experts tab false Enables diagnostic logging for slow dashboard rendering operations.

Enable this option when investigating performance or rendering delays. Slow renders exceeding the configured 150 ms threshold are logged in the MT5 Experts tab.

For normal use, you can leave this option disabled.

RECOMMENDED STARTING CONFIGURATION

For a clean, general-purpose dashboard:

  • Sections 1, 2, and 3: SHOW.

  • Theme: Light or Dark, according to preference.

  • Style: Professional for a restrained appearance, or Modern for a more visual interface.

  • Results Today: Equity change today.

  • Daily table rows: 10.

  • Chart period: 30 days.

  • Chart height: 230.

  • Position: Upper-left corner, with offsets adjusted to your chart.

  • Slow-render logging: Disabled unless troubleshooting.

These are suggested starting values, not performance or profitability recommendations.

IMPORTANT NOTES

  • The currency symbol is a display setting; it does not convert monetary amounts.

  • The daily reset hour uses broker server time.

  • Historical statistics depend on the available account history and data.

  • Drawdown thresholds provide visual warnings only.

  • The dashboard monitors account performance; it does not place trades or manage risk automatically.

  • Multiple indicator instances can be attached to the same chart, each with its own dashboard canvas name. Arrange their positions and dimensions to avoid overlap.


Also visit us at: forexpanda


Avis 2
GerwinW1973
35
GerwinW1973 2026.10.20 09:16 

Great work, Martin! FOREXPANDA Performance Dashboard brings essential account statistics together in a clear, professional layout directly on the MT5 chart. The daily performance calendar, drawdown tracking, and floating P/L overview are particularly useful features. The option to view cumulative profit with deposits excluded is a thoughtful touch, while the customizable themes and layouts add flexibility. A well-designed tool for keeping trading performance in focus!

Produits recommandés
Pin Bars MT5
Yury Emeliyanov
Main purpose:   "Pin Bars"   is designed to automatically detect pin bars on financial market charts. A pin bar is a candle with a characteristic body and a long tail, which can signal a trend reversal or correction. How it works:   The indicator analyzes each candle on the chart, determining the size of the body, tail and nose of the candle. When a pin bar corresponding to predefined parameters is detected, the indicator marks it on the chart with an up or down arrow, depending on the directi
FREE
Ninja Trend Matrix MT5 Ninja Trend Matrix MT5 est un indicateur pour MetaTrader 5 qui réunit dans un seul tableau de bord la direction de tendance sur plusieurs unités de temps, la force relative et la volatilité basée sur l’ATR. Il aide à examiner l’environnement actuel avant une décision discrétionnaire ou l’utilisation d’un autre système de trading. L’indicateur n’ouvre, ne modifie et ne ferme aucune position. Il n’affiche pas de flèches d’entrée, de niveaux TP/SL, de taux de réussite ni de p
FREE
This Mt5 Indicator Signals when there is two opposite direction bars engulfed by current bar.  has a recent Exponential Moving Average Cross and past bar was oversold/bought Expert Advisor Available in Comments  Free Version Here : https://www.mql5.com/en/market/product/110114?source=Site&nbsp ; Full Alerts for mt5 terminal , phone , email, print to file, print to journal  Buy Signal ( blue line ) Past ema cross ( set at 30 bars back ) Past bar rsi is oversold ( level 40  ) Engulfing bar closes
FREE
Trade Behavior Mirror lit uniquement l'historique des transactions déjà clôturées de votre propre compte et compte un seul phénomène précis : l'ouverture d'une nouvelle position peu après une perte réalisée, avec un lot plus important que votre volume habituel. L'outil ne prédit rien et ne conseille rien. Chaque chiffre du panneau correspond à quelque chose qui s'est déjà produit sur ce compte. Comment les chiffres sont construits : l'outil lit jusqu'à 31 jours de transactions clôturées, tous s
FREE
Automatic Trendlines
Pasi Hakamaki
4.69 (51)
The indicator draws trendlines on chart. This indicator has six inputs. User can specify alternative labels for both lines. If multiple instances of the indicator are used, the labels must differ. User can set width and color of the lines and depth which specifies what significant peaks should be used. For example, Depth=10 sets trendlines using the current peaks and valleys that have at least 10 bars to the right and to the left and that have highs/lows less/greater than the peak's high/low. In
FREE
Sierra Capital Session Sweep Scanner maps out the Asian, London, and New York trading sessions directly on your chart, then watches for a specific price-action pattern: a candle that spikes through the Asian session's high or low and closes back inside it — a classic liquidity sweep. What it shows: Colour-coded boxes marking the Asian, London, and NY session ranges, with the Asian high/low projected forward as reference lines Arrows marking each qualifying sweep-and-reject candle, with projected
FREE
Show Pips for MT5
Roman Podpora
4.5 (32)
Cet indicateur d'information sera utile pour ceux qui veulent toujours être au courant de la situation actuelle du compte. VERSION MT 4 -   More useful indicators L'indicateur affiche des données telles que le profit en points, en pourcentage et en devise, ainsi que le spread pour la paire actuelle et le temps jusqu'à la fermeture de la barre sur la période actuelle. Il existe plusieurs options pour placer la ligne d'information sur le graphique : À droite du prix (passe derrière le prix) ; En c
FREE
Multi Currency Strength Dashboard Mini (FREE) – Currency Strength Meter for MetaTrader 5 Multi Currency Strength Dashboard Mini est un indicateur gratuit pour MetaTrader 5 qui affiche en temps réel la force relative des 8 devises majeures (USD, EUR, GBP, JPY, CHF, CAD, AUD, NZD) sous forme de tableau de bord clair et rapide à lire. Objectif : repérer en quelques secondes les devises fortes et faibles afin d'orienter votre watchlist (par exemple, sélectionner des paires où une devise forte fait f
FREE
Smart Trend Suite Pro – Advanced Trend Indicator with Dashboard & Alerts Overview: Smart Trend Suite Pro is a powerful trend-detection indicator that offers traders a complete set of tools for accurate trend analysis and actionable insights. Designed for versatility and precision, Smart Trend Suite Pro adapts seamlessly to multiple timeframes and market conditions, making it suitable for various trading styles, including scalping and swing trading. Key Features: Real-Time Trend Detection: Identi
FREE
FullInfo MTX Levels is the free indicator version of FullInfo MTX Pro. The full version is available in the MQL5 Market. It puts the levels traders watch, a few pieces of market analysis and the numbers of your account on the M5 chart. It does not send, change or close orders, and it does not touch your positions. On the chart (M5) • Previous day, week and month high/low, daily and weekly open, New York midnight open, and the highs/lows of the Asia, London and New York sessions. Labels sit at
FREE
Rainbow MT5
Jamal El Alama
4 (1)
Description : Rainbow MT5 is a technical indicator based on Moving Average with period 34 and very easy to use. When price crosses above MA and MA changes color to green, then this is a signal to buy. When price crosses below MA and MA changes color to red, then this is a signal to sell. The Expert advisor ( Rainbow EA MT5 ) based on Rainbow MT5 indicator is now available here . MT4 version is available here .
FREE
MSX SuperTrend Visual Indicator Overview MSX SuperTrend Visual Indicator is a MetaTrader 5 indicator designed to display trend direction and market structure using a SuperTrend-based calculation with optional filtering components. The indicator combines trend visualization, volatility measurement and optional EMA-based filtering to provide a clear graphical representation of market conditions. Features • SuperTrend-based trend visualization • ATR-based volatility calculation • Optional Heikin A
FREE
Girassol Sunflower MT5 Indicator
Saullo De Oliveira Pacheco
3.86 (7)
This is the famous Sunflower indicator for Metatrader5. This indicator marks possible tops and bottoms on price charts. The indicator identifies tops and bottoms in the asset's price history, keep in mind that the current sunflower of the last candle repaints, as it is not possible to identify a top until the market reverses and it is also not possible to identify a bottom without the market stop falling and start rising. If you are looking for a professional programmer for Metatrader5, please
FREE
Rating Meter : une évaluation consolidée de 26 indicateurs Rating Meter calcule pour vous les signaux de 26 indicateurs populaires et les regroupe en une évaluation simple « vendre / neutre / acheter ». Inutile d'ouvrir les fenêtres de chaque indicateur et de comparer les valeurs à la main. Un seul coup d'œil au panneau montre vers quel côté le marché penche sur l'unité de temps sélectionnée. Our products: https://www.mql5.com/en/users/trendhunter/seller Ce qu'affiche le panneau Jauge Oscillator
FREE
APICT Smart Trendline and Pattern Tool APICT Trendline + Pattern Indicator is a powerful all-in-one technical analysis tool designed to automatically identify market structure, draw dynamic support and resistance trendlines, and detect high-probability chart patterns in real time. Smart Trendline Detection The indicator automatically draws major and minor trendlines , clearly marking key support and resistance levels based on market structure. Separate controls for major and minor trends Adju
FREE
Dsc Oscillator
Diogo Sawitzki Cansi
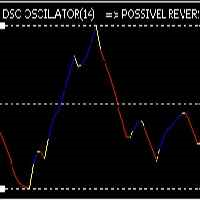
Recomended broker: https://tinyurl.com/5ftaha7c Indicator used to monitor price fluctuations in the market and discover possible reversals through reversal points or divergences in the indicator. All assets and all timeframes.   SEE OUR RESULTS ON INSTAGRAM:  https://www.instagram.com/diogo.cansi/   TELEGRAM GROUP =  https://t.me/robosdsc More information by email dscinvestimentos@gmail.com or by Whatsapp 55-991372299
FREE
PZ Three Drives MT5
PZ TRADING SLU
2.83 (6)
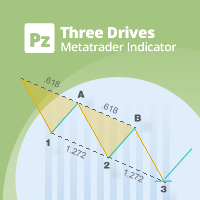
This indicator finds Three Drives patterns. The Three Drives pattern is a 6-point reversal pattern characterised by a series of higher highs or lower lows that complete at a 127% or 161.8% Fibonacci extension. It signals that the market is exhausted and a reversal can happen. [ Installation Guide | Update Guide | Troubleshooting | FAQ | All Products  |  Get Help ] Customizable pattern sizes Customizable colors and sizes Customizable breakout periods Customizable 1-2-3 and 0-A-B ratios It impl
FREE
Shadow Flare MT5
Kestutis Balciunas
L’indicateur Shadow Flare est un outil de tendance et de liquidité non re‑dessinant pour MetaTrader 5. Il calcule une ligne de base configurable à partir d’une moyenne mobile (HMA, EMA, SMA ou RMA), l’entoure d’un canal basé sur l’Average True Range et produit un état de tendance « collant » qui ne change que lorsque le cours de clôture franchit la borne supérieure ou inférieure. Le même moteur de tendance alimente un module automatique de zones d’offre et de demande qui détecte les sommets et c
FREE
Auto Triangle Patterns Overview Auto Triangle Patterns is a chart indicator for MetaTrader 5. It scans the price history of the current chart and looks for three classical triangle formations: ascending, descending and symmetrical. When a formation is found, the indicator draws its two boundary lines, fills the area between them and adds a text label with the name of the formation. The pattern stays on the chart and is extended to the right with every new bar. When price leaves the formation in
FREE
Mini Charts MTF EMA Mini Charts MTF EMA is a MetaTrader 5 indicator that displays multiple mini charts from selected timeframes directly on the main chart. It helps traders monitor multi-timeframe price movement and EMA direction in one clean visual layout. Main Features Multiple mini charts on the main chart Custom timeframe selection for each mini chart Up to 4 EMA lines for every mini chart Custom EMA period, shift, method, applied price, color, style, and width Custom mini chart width, heigh
FREE
Visualiseur de structure des niveaux de référence Le « Reference Level Structure Visualizer » est un indicateur d'analyse technique pour MetaTrader 5. Il est conçu pour l'observation des graphiques en intraday et visualise directement sur le graphique les niveaux de la session précédente, les niveaux journaliers, les balayages de liquidité (sweeps), les reconquêtes ultérieures (reclaims) ainsi que la structure du marché basée sur l'unité de temps M1. L'indicateur n'ouvre pas de transactions, ne
FREE
Double Correlation indicator (free) plots two windowed correlations in a separate window.  the size of window is taken as input before the two symbols to correlate to. Two symbols are taken as an input parameters as well as period length. and the two correlations are computed with the currently shown symbol ex: input GBPJPY and AUDNZD.  current symbol EURUSD then the following will be computed corr(EURUSD,GBPJPY) and corr(EURUSD,AUDNZD) The indicator can be useful to run a multi-symbol pair trad
FREE
Key Market Zones and Levels — Zones et niveaux clés du marché Key Market Zones and Levels est un indicateur pour MetaTrader 5 qui identifie automatiquement les zones de support et de résistance et aide à analyser la structure du marché, la qualité des zones, les réactions passées du prix et les conditions actuelles du marché. L’indicateur ne se contente pas de tracer des lignes horizontales sur le graphique. Il analyse les zones de marché, évalue leur qualité, affiche des statistiques sur les ré
FREE
Smart RR Pro
Simon Draxler
5 (2)
DRX Smart Risk - Visual Trade Planner Utility DRX Smart Risk est un outil de superposition graphique pour MetaTrader 5 conçu pour aider les traders dans la gestion des risques et le calcul de la taille des positions. Contrairement aux lignes standard, cet utilitaire crée une interface interactive qui permet aux utilisateurs de planifier visuellement les niveaux d'Entrée, de Stop Loss et de Take Profit tout en calculant automatiquement les métriques financières. Note Importante Ce produit est un
FREE
VolumeBasedColorsBars
Henrique Magalhaes Lopes
VolumeBasedColorsBars — Free Powerful Volume Analysis for All Traders Unlock the hidden story behind every price bar! VolumeBasedColorsBars is a professional-grade, 100% FREE indicator that colorizes your chart candles based on real, adaptive volume analysis. Instantly spot surges in market activity, identify exhaustion, and catch the moves that matter. This indicator gives you:    • Dynamic color-coded bars for instant volume context    • Adaptive thresholds based on historical, session-awar
FREE
HCS SessionPulse
HADDEN CAPITAL SOLUTIONS LLC
HCS SessionPulse is a free, read-only global trading session monitor for MetaTrader 5. A compact on-chart panel shows the current status of the Sydney, Tokyo, London, and New York trading sessions and continuously counts down to upcoming session transitions. SessionPulse displays: • Sydney session OPEN/CLOSED status • Tokyo session OPEN/CLOSED status • London session OPEN/CLOSED status • New York session OPEN/CLOSED status • Time remaining until each session's next open or close • Currently
FREE
Fimathe PCM Indicador
Cristiano Rodrigo Olegini
5 (3)
Velas Forex FIMATHE PCM Indicator (GRATUIT) Le Velas Forex FIMATHE PCM Indicator est un indicateur gratuit conçu pour aider les traders à analyser les marchés de manière simple, rapide et efficace. Son objectif est de faciliter l'identification des conditions du marché grâce à des signaux visuels clairs, permettant ainsi aux traders de prendre des décisions de trading avec davantage de confiance. Meilleur résultat pour XAUUSD : Unité de temps : 5M Heure du serveur MT5 : 02:00 Gestion des risque
FREE
Value Chart Candlesticks
Flavio Javier Jarabeck
4.57 (14)
The idea of a Value Chart indicator was presented in the very good book I read back in 2020 , " Dynamic Trading Indicators: Winning with Value Charts and Price Action Profile ", from the authors Mark Helweg and David Stendahl. The idea is simple and the result is pure genius: Present candlestick Price analysis in a detrended way! HOW TO READ THIS INDICATOR Look for Overbought and Oversold levels. Of course, you will need to test the settings a lot to find the "correct" one for your approach. It
FREE
MACD Enhanced
Nikita Berdnikov
4 (4)
Introducing the MACD  Enhanced – an advanced MACD (Moving Average Convergence Divergence) indicator that provides traders with extended capabilities for trend and momentum analysis in financial markets. The indicator uses the difference between the fast and slow exponential moving averages to determine momentum, direction, and strength of the trend, creating clear visual signals for potential entry and exit points. Attention! To achieve the best results, it is recommended to adapt the indicator
FREE
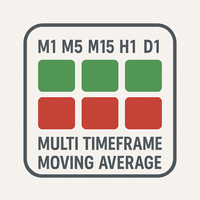
The   "MultiTF Moving Average Panel"   indicator is more of a helping tool than an indicator, it serves to help know the trend direction for the current currency pair of all timeframes in one place. It is best used with other indicators and signals, to help filter the signals according the trend based on multiple timeframes. Indicator inputs : - Moving Average period   : Default is set to 34. - Moving Average method   : The method of calculation of the Moving Average. Default is set to Exponent
FREE
Les acheteurs de ce produit ont également acheté
Trend Sniper X
Sarvarbek Abduvoxobov
4.86 (42)
Trend Sniper X est un indicateur de suivi de tendance multi-unités de temps pour MetaTrader 5 qui aide les traders à identifier la direction de la tendance et les points d'inversion potentiels avec clarté et précision. pour MT4: https://www.mql5.com/en/market/product/193245 Informations sur le prix : Le prix actuel est un prix promotionnel et est susceptible de changer lors des prochaines mises à jour et nouvelles fonctionnalités. Offre bonus : Pour obtenir GRATUITEMENT l'Auto-Trade Assistant E
Smart Trend Trading System — MetaTrader 5 Après votre achat, envoyez-moi un message sur MQL5 pour recevoir GRATUITEMENT Smart Universal Expert Advisor, ainsi que le cours en ligne, le manuel PDF et l’accès au groupe privé. STTS réunit la direction de la tendance, les signaux d’entrée et de sortie, les zones de retournement et les niveaux de prix importants directement sur votre graphique. Suivez le système manuellement ou connectez un EA compatible distinct pour une exécution automatique selon l
Zoryk Gold
Reda El Koutbane
4.76 (17)
ZORYK — Système avancé de signaux XAUUSD pour MetaTrader 5 Vous connaissez certainement cette sensation. Vous passez du temps à analyser l’or. Vous attendez le bon point d’entrée. Vous ouvrez enfin la position, puis le prix commence immédiatement à évoluer contre vous. Vous fermez trop tôt, déplacez le Stop Loss ou hésitez pendant quelques secondes. Ensuite, le marché atteint exactement l’objectif que vous aviez initialement prévu, mais sans vous dans la position. Le problème n’était pas toujour
SMC Intraday Formula
VividMind Digital Solutions
5 (26)
Commençons par être honnêtes. Aucun indicateur ne vous rendra rentable à lui seul. Si quelqu’un vous dit le contraire, il vous vend un rêve. Tout indicateur qui affiche des flèches parfaites d’achat/vente peut être rendu impeccable — il suffit de zoomer sur la bonne partie de l’historique et de capturer uniquement les trades gagnants. Nous ne faisons pas cela.  SMC Intraday Formula est un outil. Il lit la structure du marché pour vous, identifie les zones de prix à la probabilité la plus élevée
SuperScalp Pro
Van Minh Nguyen
4.56 (36)
SuperScalp Pro - Professional Multi-Layer Confluence Scalping System SuperScalp Pro est un indicateur avancé de scalping qui améliore le Supertrend classique grâce à plusieurs filtres intelligents de confirmation. Il aide à identifier des opportunités de Buy/Sell présentant une probabilité plus élevée, tout en réduisant considérablement les faux signaux. Des flèches Buy et Sell claires apparaissent directement sur le graphique, tandis que les niveaux de Stop Loss et Take Profit basés sur l’ATR s
Un nouveau Roi en ville - Indicateur + Gestion des ordres (TP1 + TP2 + TP3) + Envoi optionnel de signaux Telegram INCLUS (GRATUIT) (SYSTÈME COMPLET DE TRADING et DE SIGNAUX) Notre meilleur EA pour l’Or : Gold Slayer Cet indicateur inclut une stratégie avancée, un système de trading avec gestion des ordres personnalisable ainsi qu’un système de retour à la moyenne combinant des extensions d’enveloppes, soutenu par plusieurs filtres intelligents de confirmation comme le RSI afin de détecter des en
Gardez votre avantage de trading dans votre ligne de mire ! M5 Sniper est un nouvel indicateur de MeanFX. Il combine des signaux de trading précis avec des niveaux de TP/SL adaptatifs — créant ainsi les meilleures opportunités de trading statistiques possibles ! Le prix augmente tous les 5 achats, le prochain prix est de 69$ Envoyez-moi un message après l’achat pour recevoir des conseils/un guide et un EA bonus Qu’est-ce qui le distingue ? Performance statistique éprouvée sur Gold XAUUSD ( fonct
GoldenX Entry MT5
VividMind Digital Solutions
5 (17)
GoldenX Entry est un indicateur MT5 doté d’un algorithme adaptatif Smart Entry Trend, d’un système de scoring des signaux, d’un détecteur de régime de marché et d’un filtre de volatilité. Chaque signal inclut un niveau d’entrée calculé, trois niveaux de Take-Profit (TP1, TP2, TP3) ainsi qu’un niveau de Stop-Loss. Il est construit sur plusieurs couches analytiques conçues pour s’adapter à différentes conditions de marché, combinant un système analytique multicouche avec un optimiseur intégré et u
Boba Analysis Suite
Trade Ready Solutions LLC
5 (1)
Boba Analysis Suite Boba Analysis Suite est un indicateur d’analyse pour MetaTrader 5. Il réunit la structure du marché, les zones de prix pertinentes et le contexte général du marché dans une même vue graphique. Développé à partir de l’expérience pratique d’un trader et formateur en trading, il accompagne une démarche d’analyse structurée : évaluer la direction du marché, identifier les niveaux importants et analyser plusieurs unités de temps conjointement. Une analyse en contexte La significat
La légende est de retour : Entry Points Pro 10. La relance de l'indicateur légendaire qui s'est maintenu 3 ans dans le Top-3 du MQL5 Market. Des centaines d'avis enthousiastes (589 sur les deux versions), des milliers de traders l'utilisent chaque jour, 31 000+ téléchargements de la démo   MT4+MT5 . J'ai lu chacun de vos avis publiés en cinq ans — et au lieu de promettre, j'ai intégré les réponses directement dans la version 10. Par un auteur présent sur les marchés depuis 1999, qui tient à l'ho
M1 Sniper MT5
Oleg Rodin
5 (7)
M1 SNIPER   est un système d'indicateurs de trading facile à utiliser. Il s'agit d'un indicateur à flèche conçu pour l'unité de temps M1. Cet indicateur peut être utilisé seul pour le scalping sur l'unité de temps M1 ou intégré à votre système de trading existant. Bien que conçu spécifiquement pour le trading sur l'unité de temps M1, ce système peut également être utilisé avec d'autres unités de temps. Initialement, j'avais conçu cette méthode pour le trading du XAUUSD et du BTCUSD. Cependant, j
Auto Optimized SpeedAngle est un système de vectorisation du momentum de niveau institutionnel qui élimine l'ajustement de courbe ( curve-fitting ) grâce à une optimisation continue par avancement ( Walk-Forward Optimization , WFO). Plutôt que de s'appuyer sur des entrées statiques qui se dégradent lorsque les régimes de marché changent, l'indicateur recalibre dynamiquement ses paramètres en utilisant une validation hors échantillon ( Out-of-Sample , OOS), garantissant ainsi que les signaux affi
Neuro Poseidon MT5
Daria Rezueva
4.75 (52)
Neuro Poseidon is a new indicator by Daria Rezueva. It combines precise trading signals with adaptive TP/SL levels - creating best possible trades as a result! Message me and get  Neuro Poseidon Assistant  as a gift to automize your trading process! What makes it stand out? 1. Proven profitability on all assets and timeframes 2. Only confirmed BUY and SELL signals present on the chart 3. Adaptive TP & SL levels generated by the software for each trade 4. Easy to understand - suitable for al
Adaptive Price Action Engine Achetez un indicateur, obtenez l'EA gratuitement Analyse auto-optimisée des tendances et des figures de chandeliers Multi-Timeframe Les marchés évoluent constamment, et tous les modèles de Price Action n’ont pas la même valeur dans toutes les conditions de marché. Adaptive Price Action Engine a été conçu pour s’adapter aux changements du marché en combinant structure de tendance, analyse Multi-Timeframe, figures de chandeliers et optimisation statistique au sein d’un
ARIPoint
Temirlan Kdyrkhan
1 (4)
ARIPoint is a powerful trading companion designed to generate high-probability entry signals with dynamic TP/SL/DP levels based on volatility. Built-in performance tracking shows win/loss stats, PP1/PP2 hits, and success rates all updated live. Key Features: Buy/Sell signals with adaptive volatility bands Real-time TP/SL/DP levels based on ATR Built-in MA Filter with optional ATR/StdDev volatility Performance stats panel (Success, Profit/Loss, PP1/PP2) Alerts via popup, sound, push, or email Cu
Break and Retest Hunter
Mohamed Hassan
3.67 (3)
Break and Retest Hunter is a powerful MetaTrader 5 indicator designed to automatically identify support and resistance levels, breakout structures, and potential retest opportunities in real time. Bonus Indicator: After purchasing Break and Retest Hunter , contact me to receive Trade Indicator Assistant EA completely free as a bonus utility. $65 for the next 10 copies . Next price is $120.  Combining adaptive market analysis, clear BUY/SELL signals, Fibonacci-based profit targets, and a premiu
Gann Made Easy   est un système de trading Forex professionnel et facile à utiliser qui est basé sur les meilleurs principes de trading en utilisant la théorie de mr. WD Gann. L'indicateur fournit des signaux d'ACHAT et de VENTE précis, y compris les niveaux Stop Loss et Take Profit. Vous pouvez échanger même en déplacement en utilisant les notifications PUSH. VEUILLEZ ME CONTACTER APRÈS L'ACHAT POUR RECEVOIR GRATUITEMENT DES INSTRUCTIONS DE TRADING ET D'EXCELLENTS INDICATEURS SUPPLÉMENTAIRES! V
Gold Trend Coach MT5
Cristhian Alexander Gaibor Cuasquer
5 (2)
Gold Trend Coach est un indicateur de tendance pour l'or (XAUUSD) sur MetaTrader 5 avec des signaux d'achat et de vente, un stop loss et trois objectifs de take profit, confirmés à la clôture de la bougie, un tableau de bord coach multi-unités de temps et des alertes sur votre téléphone et sur Telegram. Conçu pour le scalping en M5 et l'intraday en M15 pendant les sessions de Londres et de New York. Gold Trend Coach : signaux de tendance sur l'or XAUUSD avec entrée, stop et trois objectifs. Prix
Gold Entry Sniper
Tahir Mehmood
5 (21)
Gold Entry Sniper – Tableau de Bord ATR Multi-Unités de Temps pour Scalping et Swing Trading sur l'Or Gold Entry Sniper est un indicateur avancé pour MetaTrader 5 qui fournit des signaux d'achat/vente précis sur XAUUSD et autres actifs, basé sur la logique de Trailing Stop ATR et l' analyse multi-unités de temps . Caractéristiques et Avantages Clés Analyse Multi-Unités de Temps – Affiche les tendances en M1, M5, M15 sur un seul tableau. Trailing Stop Basé sur l'ATR – Ajuste automatiquement selon
FiboSniper Pro
Van Minh Nguyen
5 (4)
FiboSniper Pro – Multi-Filter Fibonacci System with Auto SL/TP and Control Panel FiboSniper Pro est un indicateur technique qui combine des Fibonacci Envelopes dynamiques avec plusieurs filtres de confirmation afin de générer des signaux Buy et Sell sélectionnés. Les niveaux de Fibonacci sont calculés à partir de Moving Average et ATR, puis filtrés par ADX, EMA, RSI, ATR, Volume, Time et la structure des bougies. L’indicateur affiche directement sur le graphique les niveaux automatiques de Stop
Tokyo mt5 Indicator
Vasiliy Strukov
5 (10)
Le Tokyo Indicator offre une vue d'ensemble visuelle et claire de l'orientation de la tendance, des signaux de trading potentiels et des conditions du marché. Sa ligne de tendance en escalier, codée par couleur, distingue les phases haussières (en bleu) des phases baissières (en magenta). Des flèches directionnelles associées mettent en évidence les opportunités d'achat et de vente potentielles lors des changements de tendance. Un tableau de bord intégré regroupe le signal actuel, l'orientation
Trend Catcher ind mt5
Ramil Minniakhmetov
5 (18)
INDICATEUR DE DÉTECTEUR DE TENDANCE L'indicateur de détecteur de tendance analyse les mouvements de prix du marché grâce à une combinaison d'indicateurs d'analyse de tendance adaptatifs, propriétaires et personnalisés. Il identifie la véritable direction du marché en filtrant les fluctuations à court terme et en se concentrant sur la force de la dynamique sous-jacente, l'expansion de la volatilité et la structure des prix. Il utilise également une combinaison d'indicateurs personnalisés de lis
Entry In The Zone and SMC Multi Timeframe is a real-time market analysis tool based on Smart Money Concepts (SMC), designed to analyze market structure, price direction, and key trading zones. It supports both Single-Timeframe and Multi-Timeframe Analysis, providing a clearer view of overall market structure across multiple timeframes, with real-time BUY / SELL signals designed with a strict focus on No-Repaint principles. The signals are designed to help filter unclear setups and evaluate tradi
Unix Scalper
Issam Kassas
4 (4)
Unix Scalper — MetaTrader 5 Après votre achat, envoyez-moi un message sur MQL5 pour recevoir GRATUITEMENT Smart Universal Expert Advisor, ainsi que le cours en ligne, le manuel PDF et l’accès au groupe privé. Repérez la configuration. Consultez le plan. Choisissez comment intervenir. UNIX Scalper réunit l’analyse du marché, les décisions BUY/SELL/WAIT et les niveaux Entry, Stop Loss, TP1 et TP2 dans un panneau organisé. VISUALISEZ LE SIGNAL ET LE PLAN • Des décisions claires : BUY, SELL ou WAIT.
Apex Patterns PRO Achetez l'indicateur - Obtenez GRATUITEMENT l'Expert Advisor basé sur celui-ci. Intelligence auto-optimisée des figures chartistes et des cassures Les scanners de figures traditionnels s'appuient sur des paramètres fixes, sous-performant souvent lorsque la volatilité et les structures du marché changent. Apex Patterns PRO est conçu pour s'adapter aux conditions changeantes du marché en combinant la reconnaissance des figures chartistes structurelles, le filtrage du momentum et
Scalper Vault est un système de trading puissant et complet, conçu pour les traders en quête de régularité dans le cadre du trading intrajournalier. Cet indicateur de haute précision constitue un système de trading autonome et exhaustif, offrant des analyses de qualité institutionnelle, aussi bien pour le Forex que pour les options binaires. VEUILLEZ ME CONTACTER APRÈS VOTRE ACHAT POUR OBTENIR MES CONSEILS DE TRADING AINSI QU'UN EXCELLENT BONUS ! En éliminant les incertitudes et les analyses man
FX Trend MT5 NG
Daniel Stein
5 (6)
FX Trend NG : La Nouvelle Génération d’Intelligence de Tendance Multi-Marchés Vue d’ensemble FX Trend NG est un outil professionnel d’analyse de tendance multi-timeframe et de surveillance des marchés. Il vous permet de comprendre la structure complète du marché en quelques secondes. Au lieu de naviguer entre de nombreux graphiques, vous identifiez immédiatement quels instruments sont en tendance, où le momentum s’affaiblit et où plusieurs unités de temps sont alignées. Offre de Lancement – Ob
Atomic Analyst MT5
Issam Kassas
4.48 (62)
Atomic Analyst — MetaTrader 5 Après votre achat, envoyez-moi un message sur MQL5 pour recevoir GRATUITEMENT Smart Universal Expert Advisor, ainsi que le cours en ligne, le manuel PDF et l’accès au groupe privé. Atomic Analyst réunit l’action des prix, la direction de la tendance, les signaux d’entrée et de sortie, le Stop Loss et plusieurs niveaux de Take Profit directement sur votre graphique. REPÉREZ LE SIGNAL. COMPRENEZ LA CONFIGURATION. Atomic Analyst présente son analyse sous forme d’inform
Market Structure Order Block Dashboard MT5 est un indicateur MT5 conçu pour les traders qui veulent lire la structure de marché et les principales zones de réaction du prix directement sur le graphique. Il combine BOS, ChoCH, Order Blocks, Fair Value Gaps (FVG), Liquidité, Kill Zones, Volume Profile, et un dashboard compact pour une analyse rapide. Cet indicateur s'adresse aux traders qui utilisent la structure de marché, les concepts ICT et Smart Money comme cadre de décision. Il peut aider à r
Smart Price Action Concepts — MetaTrader 5 Après votre achat, envoyez-moi un message sur MQL5 pour recevoir GRATUITEMENT Smart Universal Expert Advisor, ainsi que le cours en ligne, le manuel PDF et l’accès au groupe privé. Observez la structure. Identifiez les zones. Construisez votre plan de trading. Réunissez Smart Money Concepts (SMC), analyse de style ICT et action des prix sur un graphique organisé. Identifiez la structure du marché, les blocs d’ordres, les niveaux de référence de liquidit
Filtrer:
tom forex pan
19
tom forex pan 2026.10.20 13:09 

L'utilisateur n'a laissé aucun commentaire sur la note

Martin Strachota
436
Réponse du développeur Martin Strachota 2026.10.20 16:37
Thank you. BTW check out the new version v2.22. Its even better on the chart.
GerwinW1973
35
GerwinW1973 2026.10.20 09:16 

Great work, Martin! FOREXPANDA Performance Dashboard brings essential account statistics together in a clear, professional layout directly on the MT5 chart. The daily performance calendar, drawdown tracking, and floating P/L overview are particularly useful features. The option to view cumulative profit with deposits excluded is a thoughtful touch, while the customizable themes and layouts add flexibility. A well-designed tool for keeping trading performance in focus!

Martin Strachota
436
Réponse du développeur Martin Strachota 2026.10.20 16:37
Thank you. BTW check out the new version v2.22. Its even better on the chart.
Répondre à l'avis