Key Liquidity levels and Confirmation

5
Key Liquidity Levels and Confirmation shows where liquidity is resting on the chart and marks the moment it is taken. It combines three steps of one trading idea in a single tool: the key level, the sweep of that level, and the confirmation that follows.

KEY LEVELS
- Asia, London and New York session highs and lows
- Previous day high and low (PDH / PDL)
- Previous week high and low (PWH / PWL)
- Previous month high and low
- All-time high and all-time low
Levels that share the same price are merged into one line with a combined name. A broken level stops at the bar where it was broken and turns dotted, so only untouched liquidity stays highlighted.

LIQUIDITY SWEEPS
A sweep is marked when price pushes beyond a level and closes back inside within a few bars. Each sweep is shown in the color of the level it took. Marker styles: Box, Wick, Candle or None.

CONFIRMATION
- FVG / IFVG: shows the first fair value gap in the reversal direction after a sweep, or all gaps on the chart. The gap can be detected on the chart timeframe or on a higher one.
- CISD / MSS: shows the first structure break in the reversal direction after a sweep, or every change in price delivery. Confirmation by candle body (CISD) or by wick (MSS).

ALERTS
- Key liquidity sweep
- First FVG after sweep
- First IFVG after sweep
- CISD / MSS after sweep
Alerts can be sent as a popup in the terminal and as a push notification to the mobile app.

HOW TO USE
1. Wait for price to reach a key level.
2. Watch for a sweep: a push beyond the level followed by a close back inside.
3. Use the first FVG, IFVG or CISD / MSS after the sweep as confirmation of the reversal.

MAIN INPUTS
- Timezone of the session windows and the session times
- Broker server time: detected automatically, can be set manually
- Show or hide each level and choose its color
- Line hierarchy, label position and label size
- Sweep marker style
- FVG / IFVG display mode, timeframe and colors
- CISD / MSS mode, swing sensitivity and line style
- Alert settings

NOTES
- All signals are confirmed on bar close and are not redrawn afterwards.
- Session levels are shown on H4 and lower timeframes, previous day levels on timeframes below D1.
- Colors adapt automatically to a light or dark chart background.
- The indicator does not open trades. It is an analysis tool.
Avis 1
CodeFaceCrunch
641
CodeFaceCrunch 2026.11.07 08:43 

Very useful.

Produits recommandés
Weekly Fibonacci extension levels projected from the open of each week, based on the range of the previous week.   TrendSync Weekly Fibo draws Fibonacci extension levels for each week on the chart. The open of the week is the zero level. The distance between the high and the low of the previous week is the 100 percent level. The other levels are multiples of that range, drawn above and below the open.   The levels are drawn automatically for the current week and for the number of past weeks you
FREE
Auto Fibonacci Retracement Indicator — Flexible and Reliable This isn’t just another Auto Fibonacci Retracement indicator. It’s one of the most flexible and dependable tools available . If you find it useful, please consider leaving a review or comment — your feedback means a lot! Check out my other helpful tools below: Telegram to MT5 using AI   - AI-Powered Signal Copier Bot Smart Alert Manager   - Set up advanced alerts and send them to Mobile, Telegram, Discord, Webhook... Timeframes Trend
FREE
Candlestick Patterns Context labels well-known candle patterns. It also lets you hide the small or out-of-context ones that make most pattern tools noisy. Patterns (each can be switched on or off) - Bullish and bearish engulfing - Hammer and shooting star - Bullish and bearish harami - Piercing line and dark cloud cover - Morning star and evening star - Three white soldiers and three black crows (off by default) - Doji (off by default; labelled with no direction) Filters - Minimum size: the sign
FREE
-- Simple mais efficace. Indicateur d'inversion - Qu'est-ce que c'est ? Un indicateur superposé qui suit les tendances et combine la logique SuperTrend avec la technologie des courbes exponentielles. Il détecte la direction de la tendance, trace un canal dynamique sur le graphique et envoie des alertes en temps réel lorsque la tendance s'inverse. Comment fonctionne-t-il ? L'indicateur calcule une ligne de base exponentielle à l'aide de l'ATR et d'un facteur SuperTrend. Lorsque le prix clôture
FREE
Développement de la version précédente de l'indicateur ZigZag WaveSize MT4 ZigZag WaveSize - indicateur standard ZigZag modifié avec ajout d'informations sur la longueur d'onde en points, niveaux et différentes logiques d'alertes Améliorations générales : Adaptation du code pour MetaTrader 5 Travail optimisé avec les objets graphiques Nouveautés : Niveaux horizontaux aux extrêmes Choix du type de niveaux : horizontal/rayons/segments Filtre de niveaux liquides (non percés par le prix) Tampon po
FREE
Cet indicateur vous permet d'afficher les étiquettes des niveaux de Fibonacci avec une grande taille de police . Il prend en charge jusqu'à 25 niveaux de Fibonacci - Dès que vous dessinez Fibonacci, il affiche les niveaux que vous avez ajoutés comme paramètre d'entrée avec une grande taille de police avec la couleur et la police que vous choisissez. Options personnalisables : 1. Police de texte Fibo 2. Taille du texte Fibo 3. Couleur du texte Fibo 3. Ajoutez une description à chaque nivea
FREE
The   DailyWeeklyMarkers   indicator helps traders visualize trading weeks by clearly marking the start of each day and week on the chart. It draws vertical separator lines for each day (including weekends if enabled) and highlights the beginning of new trading weeks with double lines for better clarity. This makes it easier to analyze price action within daily and weekly contexts. Who Is This Indicator For? Swing Traders   – Helps identify weekly opening gaps and key levels. Day Traders   – Vis
FREE
Hunttern ZigZag MT5
Hassan Gh Fakhraei
5 (1)
Hunt markets with Hunttern ZigZag . Easy to use with one parameter    You can use it for the following:       -Classic patterns       -Heads and shoulders       -Harmonic patterns       -Elliott Wave       -Support and resistance       -Supply and Demand Single parameter:      -Period (1-120) Features:        -Candle time        -Single parameter        -Light mode template This is version 1 of Hunttern ZigZag. We are very happy to receive feedback from you.
FREE
The jcoworld OTE EA is an automated trading bot for MetaTrader 5 built on Smart Money Concepts (SMC) . It accurately identifies market impulse moves and automatically enters trades within the Optimal Trade Entry (OTE) zone (61.8% – 79.0% Fibonacci) as soon as a confirmation candle closes. Optimized for: XAUEUR, XAUUSD, and Major Forex Pairs Features: Automatic risk management, dynamic lot sizing & automated Stop Loss/Take Profit. Try for free: This demo version is 100% free! Pricing Plans for Fu
FREE
Easy Support and Resistance
Danny Giovanni Romero Lozano
EASY SUPPORT AND RESISTANCE Visualize support and resistance levels across multiple timeframes with dynamic color-coded lines Overview This powerful MT5 indicator automatically identifies and highlights key price levels by drawing rectangles on the last closed candle and its first opposite-colored candle across six different timeframes (M15, M30, H1, H2, H4, D1). The lines dynamically change color based on price action confirmation, transforming into support or resistance levels when validated
FREE
FIBONACCI WITH AVG 250 — автоматические уровни Фибоначчи по экстремумам за 250 баров. Индикатор сам находит максимум и минимум за последние 250 баров и строит по ним полноценную сетку Фибоначчи с ценовыми метками: 0 / 23.6 / 38.2 / 50 / 61.8 / 78.6 / 100%. ЧТО ДЕЛАЕТ ИНДИКАТОР: • Автоматически определяет High/Low за период 250 баров и строит уровни Фибоначчи • Показывает цену каждого уровня прямо на линии • Определяет направление тренда текущего таймфрейма (Trend: Up/Down) • Выводит фильтр вола
FREE
AutoFibonacci draws Fibonacci retracement and extension levels automatically. It finds the significant swing high and low on the chart itself, so the levels appear without you drawing anything, and they update as new highs and lows form. Drawing Fibonacci by hand has a practical problem: you choose the swing. Two traders looking at the same chart pick different points and get different levels. This indicator removes that step. It works on any symbol and any timeframe. How the range is chosen Thr
FREE
CandlePro X
Murtadha Majid Jeyad Al-Khuzaie
CandlePro X — Free Professional Candle Visualizer for MetaTrader 5 CandlePro X is a free chart visualization indicator for MetaTrader 5, designed to make candlestick charts cleaner, sharper, and easier to read. If you find it difficult to quickly distinguish bullish and bearish candles, especially on busy charts, CandlePro X helps solve this problem by giving your candles stronger colors, clearer contrast, and a more professional appearance. CandlePro X does not generate trading signals, pred
FREE
Ict market structure signals
Botsalo Martin Letlhoagoje
5 (5)
SMC Signals  (BOS/CHoCH + ADR TP/SL Zones)  SMC Signals  is a free Smart Money Concepts (SMC) market structure indicator for MetaTrader 5 that automatically detects: BOS (Break of Structure) CHoCH (Change of Character) Swing High / Swing Low pivots Trade entry levels and projected targets The indicator also calculates ADR(10) (Average Daily Range) and automatically plots: Entry level Stop Loss (SL) Take Profit 1 (TP1) Take Profit 2 (TP2) A built-in dashboard displays live performance statistic
FREE
Free automatic Fibonacci is an indicator that automatically plots a Fibonacci retracement based on the number of bars you select on the BarsToScan setting in the indicator. The Fibonacci is automatically updated in real time as new highest and lowest values appears amongst the selected bars. You can select which level values to be displayed in the indicator settings. You can also select the color of the levels thus enabling the trader to be able to attach the indicator several times with differe
FREE
Necessary for traders: tools and indicators Waves automatically calculate indicators, channel trend trading Perfect trend-wave automatic calculation channel calculation , MT4 Perfect trend-wave automatic calculation channel calculation , MT5 Local Trading copying Easy And Fast Copy , MT4 Easy And Fast Copy , MT5 Local Trading copying For DEMO Easy And Fast Copy , MT4 DEMO Easy And Fast Copy , MT5 DEMO The homeopathic indicator is also called the CCI indicator. The CCI indicator was proposed
FREE
This is a buyer and seller aggression indicator that analyzes the shape of each candle and project this data in a histogram form. There are 4 histograms in one. On the front we have two: Upper - Buyer force. Lower - Seller force. At the background we also have two histogram, both with same color. They measure the combined strenght of buyers and sellers. This histograms can be turned off in Input Parameters. It is also possible to have the real or tick volume to help on this force measurement. IN
FREE
RelicusRoad Daily Pivots est un indicateur de points pivots journaliers pour MetaTrader 4 et MetaTrader 5 qui divise la plage du jour précédent en niveaux de Fibonacci et les prolonge au-dessus et en dessous, de moins 100 à plus 200 pour cent. Au lieu de pivots classiques de type floor, la plage précédente terminée est traitée comme une échelle où le plus bas vaut 0 % et le plus haut 100 %. Dix-neuf niveaux sont imprimés sous forme de petits repères colorés au bord droit du graphique, si bien qu
FREE
Pivots Lines
Abakou Nazaire Ayelenou
5 (1)
Dessinez des points pivots Traditionnels, Fibonacci, Woodie, Classic, Demark, Camarilla pour n'importe quelle période. Supporte tous les types de pivot : Traditionnel, Fibonacci, Woodie, Classic, Demark, Camarilla. Supporte tous les cadres temporels (M1...H1...D1...MN1...Annuel) Supporte l'heure d'été du serveur Support de la section quotidienne du forex de l'ouverture de Sydney à la fermeture des États-Unis Support Crypto trading Remplir l'écart entre le pivot et la tendance, très utile Les
FREE
PZ Penta O MT5
PZ TRADING SLU
3.8 (5)
The Penta-O is a 6-point retracement harmonacci pattern which usually precedes big market movements. Penta-O patterns can expand and repaint quite a bit. To make things easier this indicator implements a twist: it waits for a donchian breakout in the right direction before signaling the trade. The end result is an otherwise repainting indicator with a very reliable trading signal. The donchian breakout period is entered as an input. [ Installation Guide | Update Guide | Troubleshooting | FAQ | A
FREE
Value Chart Candlesticks
Flavio Javier Jarabeck
4.57 (14)
The idea of a Value Chart indicator was presented in the very good book I read back in 2020 , " Dynamic Trading Indicators: Winning with Value Charts and Price Action Profile ", from the authors Mark Helweg and David Stendahl. The idea is simple and the result is pure genius: Present candlestick Price analysis in a detrended way! HOW TO READ THIS INDICATOR Look for Overbought and Oversold levels. Of course, you will need to test the settings a lot to find the "correct" one for your approach. It
FREE
Pivot Points Standard Pro is a multi-timeframe pivot point indicator that automatically switches its calculation range based on the chart you're viewing, the near same auto-detection logic used by TradingView's Pivot Points Standard indicator once you've got your GMT + or - time zone with New York session start to end hours set, rebuilt natively for MetaTrader 5.  Input notes:  -Refer to the Baby Pips Market Hours website page for your GMT + or - time zone and New York session start to end time
FREE
Weis Waves est un indicateur technique développé par David Weis, inspiré des principes de Richard Wyckoff. Contrairement au volume traditionnel, affiché barre par barre, Weis Waves cumule le volume en “vagues” haussières ou baissières, redémarrant le comptage dès que la direction du prix change. Cette approche permet aux traders de visualiser clairement la véritable force des mouvements du marché , car chaque vague reflète l’intensité du volume derrière une série de bougies. Caractéristiques
FREE
AI Channels MT5
Duc Hoan Nguyen
5 (2)
Recevez GRATUITEMENT tous mes indicateurs MT4 et MT5 — Découvrez comment ici Les nouveaux outils   seront à   $30   pendant la   première semaine   ou pour les   3 premiers achats !  Chaîne Trading Tools sur MQL5 : Rejoignez ma chaîne MQL5 pour recevoir mes dernières actualités L’indicateur AI Channels utilise le clustering K-means mobile , une technique puissante d’apprentissage automatique en analyse de regroupement, pour fournir des informations en temps réel sur les tendances de prix sous-
FREE
Reversal Oscillator — Advanced Momentum Shift Detector Reversal Oscillator is a free indicator designed to highlight price zones that are statistically outside their normal movement patterns, helping traders anticipate potential turning points before they occur. Unlike traditional oscillators that react mainly to overbought/oversold conditions, this indicator applies third derivative analysis (the "acceleration of the acceleration" of price) calculated using two independent methods within a n
FREE
Spike Catch Pro
Amani Fungo
4.14 (7)
Spike Catch Pro 22:03 release updates Advanced engine for searching trade entries in all Boom and Crash pairs (300,500 and 1000) Programmed strategies improvements Mx_Spikes (to combine Mxd,Mxc and Mxe), Tx_Spikes,   RegularSpikes,   Litho_System,   Dx_System,   Md_System,   MaCross,   Omx_Entry(OP),  Atx1_Spikes(OP),   Oxc_Retracement (AT),M_PullBack(AT) we have added an arrow on strategy identification, this will help also in the visual manual backtesting of the included strategies and see ho
FREE
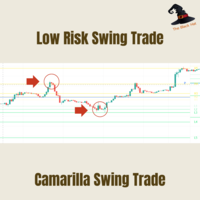
Camarilla Swing Trade Indicator is an Indicator. Support and resistance points are calculated from the High Low Close of the previous TF Week's price. What are Camarilla Pivot Points? 1.Camarilla Pivot Points is a modified version of the classic Pivot Point. 2.Camarilla Pivot Points was launched in 1989 by Nick Scott, a successful bond trader. 3.The basic idea behind Camarilla Pivot Points is that price tends to revert to its mean until it doesn't. 4.Camarilla Pivot Points is a mathematical pr
FREE
This indicator automatically detects harmonic price patterns on your chart, both bullish and bearish, and shows them as soon as they form, including potential patterns that are still developing. For every pattern it draws the Potential Reversal Zone (PRZ), and for completed patterns it also draws two take-profit and two stop-loss levels. Supported Patterns: Gartley, Bat, Butterfly, Crab, Deep Crab, Shark and Cypher. Each pattern can be switched on or off individually. Key Features: Completed
FREE
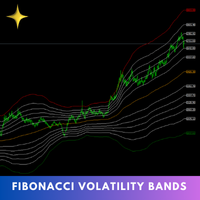
The Fibonacci Volatility Bands indicator is a refined tool designed to enhance your market analysis by integrating Fibonacci retracements with the Bollinger Bands concept. This indicator visually highlights potential areas of support and resistance, providing traders with a clearer understanding of price fluctuations and volatility. MT4 Version -  https://www.mql5.com/en/market/product/126421/ The core of the Fibonacci Volatility Bands is built around a Volume Weighted Moving Average (VWMA) that
FREE
GRATUIT — niveaux de support et résistance automatiques : haut/bas de la veille, haut/bas de la semaine précédente et niveaux ronds, tracés et maintenus à jour pour vous. 100% gratuit, sans limitations. Si cet outil gagne sa place sur vos graphiques, un court avis est ce qui nous aide le plus — cela prend 30 secondes et c'est ce qui permet aux autres traders de le trouver. Plateforme : MetaTrader 5 uniquement — il n'existe pas de version MetaTrader 4. Ce sont les niveaux que la plupart des tr
FREE
Les acheteurs de ce produit ont également acheté
Trend Sniper X
Sarvarbek Abduvoxobov
4.87 (46)
Trend Sniper X est un indicateur de suivi de tendance multi-unités de temps pour MetaTrader 5 qui aide les traders à identifier la direction de la tendance et les points d'inversion potentiels avec clarté et précision. pour MT4: https://www.mql5.com/en/market/product/193245 Informations sur le prix : Le prix actuel est un prix promotionnel et est susceptible de changer lors des prochaines mises à jour et nouvelles fonctionnalités. Offre bonus : Pour obtenir GRATUITEMENT l'Auto-Trade Assistant E
Un nouveau Roi en ville - Indicateur + Gestion des ordres (TP1 + TP2 + TP3) + Envoi optionnel de signaux Telegram INCLUS (GRATUIT) (SYSTÈME COMPLET DE TRADING et DE SIGNAUX) Notre meilleur EA pour l’Or : Gold Slayer Cet indicateur inclut une stratégie avancée, un système de trading avec gestion des ordres personnalisable ainsi qu’un système de retour à la moyenne combinant des extensions d’enveloppes, soutenu par plusieurs filtres intelligents de confirmation comme le RSI afin de détecter des en
Smart Trend Trading System — MetaTrader 5 Après votre achat, envoyez-moi un message sur MQL5 pour recevoir GRATUITEMENT Smart Universal Expert Advisor, ainsi que le cours en ligne, le manuel PDF et l’accès au groupe privé. STTS réunit la direction de la tendance, les signaux d’entrée et de sortie, les zones de retournement et les niveaux de prix importants directement sur votre graphique. Suivez le système manuellement ou connectez un EA compatible distinct pour une exécution automatique selon l
Entry Points Pro vous montre où entrer, où placer le stop et avec quel lot trader — avant que vous ne passiez l'ordre. PRIX Actuellement 199 USD : 4 exemplaires à ce prix, ensuite 249 USD. Le prix final est de 349 USD. Je gagne ma vie en tradant sur les marchés, et je le montre, donc je n'ai pas besoin de vendre cet indicateur à tout le monde. C'est un outil pour les traders qui réfléchissent par eux-mêmes, pas un bouton magique. Pas de cassure, pas de trade. Une flèche grise est un signal annu
Gardez votre avantage de trading dans votre ligne de mire ! M5 Sniper est un nouvel indicateur de MeanFX. Il combine des signaux de trading précis avec des niveaux de TP/SL adaptatifs — créant ainsi les meilleures opportunités de trading statistiques possibles ! Le prix augmente tous les 5 achats, le prochain prix est de 69$ Envoyez-moi un message après l’achat pour recevoir des conseils/un guide et un EA bonus Qu’est-ce qui le distingue ? Performance statistique éprouvée sur Gold XAUUSD ( fonct
Gann Made Easy   est un système de trading Forex professionnel et facile à utiliser qui est basé sur les meilleurs principes de trading en utilisant la théorie de mr. WD Gann. L'indicateur fournit des signaux d'ACHAT et de VENTE précis, y compris les niveaux Stop Loss et Take Profit. Vous pouvez échanger même en déplacement en utilisant les notifications PUSH. VEUILLEZ ME CONTACTER APRÈS L'ACHAT POUR RECEVOIR GRATUITEMENT DES INSTRUCTIONS DE TRADING ET D'EXCELLENTS INDICATEURS SUPPLÉMENTAIRES! V
Ultra Indicator
Ihor Otkydach
5 (1)
ULTRA est un indicateur technique « tout-en-un » : il analyse le marché de manière autonome, génère des signaux de trading, affiche les niveaux permettant de définir des ordres stop-loss et suggère le moment opportun pour clôturer les positions afin de sécuriser les bénéfices ou de minimiser les pertes. En d'autres termes, peu importe que vous ne sachiez pas analyser le marché, déterminer les niveaux (où placer votre stop-loss) ou que vous ayez du mal à gérer votre capital. ULTRA s'occupera de t
Zoryk Gold
Reda El Koutbane
4.65 (20)
ZORYK — Système avancé de signaux XAUUSD pour MetaTrader 5 Vous connaissez certainement cette sensation. Vous passez du temps à analyser l’or. Vous attendez le bon point d’entrée. Vous ouvrez enfin la position, puis le prix commence immédiatement à évoluer contre vous. Vous fermez trop tôt, déplacez le Stop Loss ou hésitez pendant quelques secondes. Ensuite, le marché atteint exactement l’objectif que vous aviez initialement prévu, mais sans vous dans la position. Le problème n’était pas toujour
SuperScalp Pro
Van Minh Nguyen
4.54 (37)
SuperScalp Pro - Professional Multi-Layer Confluence Scalping System SuperScalp Pro est un indicateur de scalping avancé qui améliore le Supertrend classique grâce à plusieurs filtres intelligents de confirmation. Il vous aide à identifier des opportunités de trading Buy/Sell présentant une probabilité de réussite plus élevée, tout en réduisant considérablement les faux signaux. Des flèches Buy et Sell bien visibles apparaissent directement sur le graphique, avec des niveaux de Stop Loss et de T
SMC Intraday Formula
VividMind Digital Solutions
5 (26)
Commençons par être honnêtes. Aucun indicateur ne vous rendra rentable à lui seul. Si quelqu’un vous dit le contraire, il vous vend un rêve. Tout indicateur qui affiche des flèches parfaites d’achat/vente peut être rendu impeccable — il suffit de zoomer sur la bonne partie de l’historique et de capturer uniquement les trades gagnants. Nous ne faisons pas cela.  SMC Intraday Formula est un outil. Il lit la structure du marché pour vous, identifie les zones de prix à la probabilité la plus élevée
GoldenX Entry MT5
VividMind Digital Solutions
5 (17)
GoldenX Entry est un indicateur MT5 doté d’un algorithme adaptatif Smart Entry Trend, d’un système de scoring des signaux, d’un détecteur de régime de marché et d’un filtre de volatilité. Chaque signal inclut un niveau d’entrée calculé, trois niveaux de Take-Profit (TP1, TP2, TP3) ainsi qu’un niveau de Stop-Loss. Il est construit sur plusieurs couches analytiques conçues pour s’adapter à différentes conditions de marché, combinant un système analytique multicouche avec un optimiseur intégré et u
Gold Trend Coach MT5
Cristhian Alexander Gaibor Cuasquer
4.27 (11)
Des signaux d'achat et de vente sans repaint pour l'or (XAUUSD) sur MetaTrader 5. Chaque signal arrive avec un stop loss et trois take profits. Un filtre Smart Money Concepts avec BOS et CHoCH, pour trader dans le sens de la structure, pas contre elle. Un Mentor en direct sur votre panneau qui vous guide à chaque étape, de l'entrée jusqu'au TP3. Et des alertes directement sur votre téléphone et sur votre propre canal Telegram. C'est ça, Gold Trend Coach. Ne tradez plus jamais seul. KIT ACHETEUR
Azimuth Pro
Ottaviano De Cicco
5 (7)
Azimuth Pro V2: Synthetic Fractal Structure and Confirmed Entries for MT5 Overview Azimuth Pro is a multi-level swing structure indicator by Merkava Labs . Four nested swing layers, swing-anchored VWAP, ABC pattern detection, three-timeframe structural filtering, and closed-bar confirmed entries — one chart, one workflow from micro-swings to macro-cycles. This is not a blind signal product. It is a structure-first workflow for traders who care about location, context, and timing. 1. What Change
FX Power MT5 NG
Daniel Stein
5 (33)
FX Power : Analysez la force des devises pour des décisions de trading plus intelligentes Aperçu FX Power est l'outil essentiel pour comprendre la force réelle des principales devises et de l'or, quelles que soient les conditions du marché. En identifiant les devises fortes à acheter et les faibles à vendre, FX Power simplifie vos décisions de trading et révèle des opportunités à forte probabilité. Que vous suiviez les tendances ou anticipiez les retournements à l'aide de valeurs extrêmes de D
FiboSniper Pro
Van Minh Nguyen
5 (4)
FiboSniper Pro – Multi-Filter Fibonacci System with Auto SL/TP and Control Panel FiboSniper Pro est un indicateur technique qui combine des Fibonacci Envelopes dynamiques avec plusieurs filtres de confirmation afin de générer des signaux Buy et Sell sélectionnés. Les niveaux de Fibonacci sont calculés à partir de Moving Average et ATR, puis filtrés par ADX, EMA, RSI, ATR, Volume, Time et la structure des bougies. L’indicateur affiche directement sur le graphique les niveaux automatiques de Stop
Power Candles MT5
Daniel Stein
4.58 (12)
Power Candles V3 - Indicateur de force à optimisation automatique Power Candles V3 transforme la force des devises et des instruments en un plan de trading exploitable sur chaque graphique auquel il est associé. Au lieu de se contenter de colorer les bougies, il effectue une optimisation automatique en temps réel en arrière-plan et vous fournit les meilleurs niveaux de Stop Loss, Take Profit et seuils de signal pour le symbole que vous avez sous les yeux. Un simple clic suffit pour l'adopter en
M1 Sniper MT5
Oleg Rodin
5 (7)
M1 SNIPER   est un système d'indicateurs de trading facile à utiliser. Il s'agit d'un indicateur à flèche conçu pour l'unité de temps M1. Cet indicateur peut être utilisé seul pour le scalping sur l'unité de temps M1 ou intégré à votre système de trading existant. Bien que conçu spécifiquement pour le trading sur l'unité de temps M1, ce système peut également être utilisé avec d'autres unités de temps. Initialement, j'avais conçu cette méthode pour le trading du XAUUSD et du BTCUSD. Cependant, j
Gold Entry Sniper
Tahir Mehmood
5 (23)
Gold Entry Sniper – Tableau de Bord ATR Multi-Unités de Temps pour Scalping et Swing Trading sur l'Or Gold Entry Sniper est un indicateur avancé pour MetaTrader 5 qui fournit des signaux d'achat/vente précis sur XAUUSD et autres actifs, basé sur la logique de Trailing Stop ATR et l' analyse multi-unités de temps . Caractéristiques et Avantages Clés Analyse Multi-Unités de Temps – Affiche les tendances en M1, M5, M15 sur un seul tableau. Trailing Stop Basé sur l'ATR – Ajuste automatiquement selon
Atomic Analyst MT5
Issam Kassas
4.51 (65)
Atomic Analyst — MetaTrader 5 Après votre achat, envoyez-moi un message sur MQL5 pour recevoir GRATUITEMENT Smart Universal Expert Advisor, ainsi que le cours en ligne, le manuel PDF et l’accès au groupe privé. Atomic Analyst réunit l’action des prix, la direction de la tendance, les signaux d’entrée et de sortie, le Stop Loss et plusieurs niveaux de Take Profit directement sur votre graphique. REPÉREZ LE SIGNAL. COMPRENEZ LA CONFIGURATION. Atomic Analyst présente son analyse sous forme d’inform
SQN Max indicator for MT5 by ITC
Renaud Herve Francois Candel
Sqn Max Indicator Sqn Max is an exclusive indicator to trade the market with high effectiveness. The indicator is based on price action, volatility and trend. This indicator is as simple as possible but not too simple. The indicator can generate alerts to ease the trading process. You don't have to stay all day in front of your screen. The indicator can be used with any class of assets and with any time frame. It is possible to achieve better results trading our list of selected assets. We achi
Auto Optimized SpeedAngle est un système de vectorisation du momentum de niveau institutionnel qui élimine l'ajustement de courbe ( curve-fitting ) grâce à une optimisation continue par avancement ( Walk-Forward Optimization , WFO). Plutôt que de s'appuyer sur des entrées statiques qui se dégradent lorsque les régimes de marché changent, l'indicateur recalibre dynamiquement ses paramètres en utilisant une validation hors échantillon ( Out-of-Sample , OOS), garantissant ainsi que les signaux affi
Apex Patterns PRO Achetez l'indicateur - Obtenez GRATUITEMENT l'Expert Advisor basé sur celui-ci. Intelligence auto-optimisée des figures chartistes et des cassures Les scanners de figures traditionnels s'appuient sur des paramètres fixes, sous-performant souvent lorsque la volatilité et les structures du marché changent. Apex Patterns PRO est conçu pour s'adapter aux conditions changeantes du marché en combinant la reconnaissance des figures chartistes structurelles, le filtrage du momentum et
Divergence Bomber
Ihor Otkydach
4.89 (94)
Chaque acheteur de cet indicateur reçoit également gratuitement : L’outil exclusif « Bomber Utility », qui accompagne automatiquement chaque opération de trading, fixe les niveaux de Stop Loss et de Take Profit, et clôture les positions selon les règles de la stratégie Des fichiers de configuration (set files) pour adapter l’indicateur à différents actifs Des set files pour configurer le Bomber Utility selon différents modes : « Risque Minimum », « Risque Équilibré » et « Stratégie d’Attente »
Prochaine mise à jour — Version 2.52 bientôt disponible ! [NOUVEAU] Préparez-vous à découvrir 4 nouvelles fonctionnalités majeures conçues pour améliorer votre analyse du marché et votre flux de travail de trading Nous faisons passer l’analyse du marché au niveau supérieur avec 4 nouvelles fonctionnalités conçues pour répondre à vos besoins en trading. Découvrez : 1. TRADE OVERVIEW DASHBOARD 2. CONFLUENCE AT ZONE 3. STRONG & WEAK HIGH/LOW 4. OTE 1. TRADE OVERVIEW DASHBOARD Un tableau de bord qu
Adaptive Price Action Engine Achetez un indicateur, obtenez l'EA gratuitement Analyse auto-optimisée des tendances et des figures de chandeliers Multi-Timeframe Les marchés évoluent constamment, et tous les modèles de Price Action n’ont pas la même valeur dans toutes les conditions de marché. Adaptive Price Action Engine a été conçu pour s’adapter aux changements du marché en combinant structure de tendance, analyse Multi-Timeframe, figures de chandeliers et optimisation statistique au sein d’un
Currency Strength Wizard   est un indicateur très puissant qui vous offre une solution tout-en-un pour un trading réussi. L'indicateur calcule la puissance de telle ou telle paire de devises en utilisant les données de toutes les devises sur plusieurs périodes. Ces données sont représentées sous la forme d'un indice de devise facile à utiliser et de lignes électriques de devise que vous pouvez utiliser pour voir la puissance de telle ou telle devise. Tout ce dont vous avez besoin est d'attacher
Naked Forex Tweezer Pro Indicator Tweezer Pro Indicator is a pattern recognition indicator for Forex, Stocks, Indices, Futures, Commodities and Cryptos. The standard Tweezer is a two bar pattern. Our enhanced version is a multi-bar pattern. We filter the patterns for you so that you only get the     best and most effective patterns   and ignore the noise. The Tweezer pattern is a simple and effective pattern to trade. The strategy that comes with the Tweezer is based on price action. The Twe
Unix Scalper
Issam Kassas
4 (4)
Unix Scalper — MetaTrader 5 Après votre achat, envoyez-moi un message sur MQL5 pour recevoir GRATUITEMENT Smart Universal Expert Advisor, ainsi que le cours en ligne, le manuel PDF et l’accès au groupe privé. Repérez la configuration. Consultez le plan. Choisissez comment intervenir. UNIX Scalper réunit l’analyse du marché, les décisions BUY/SELL/WAIT et les niveaux Entry, Stop Loss, TP1 et TP2 dans un panneau organisé. VISUALISEZ LE SIGNAL ET LE PLAN • Des décisions claires : BUY, SELL ou WAIT.
Fx Levels Premium Indicator Support and Resistance are important concepts in trading. Fx Levels Premium was created to easily draw important levels of support and resistance for the active trader. The indicator will give you all important levels (support/resistance) to watch for a wide range of assets. Trading without these levels on your chart is like driving a car for a long journey without a roadmap. You would be confused and blind. Support and resistance levels should be used as guideline
Smc Pro ToolKit
Talal N Z Aljarusha
5 (13)
SMC PRO TOOLKIT — SMART MONEY ANALYSIS & STRUCTURED TRADE PLANNING SMC Pro ToolKit is a professional Smart Money Concepts analysis workspace for MetaTrader 5. It combines market structure, multi-timeframe analysis, institutional price zones, setup evaluation, confirmation tools, volume context, alerts, and risk planning inside one organized chart environment. One workspace. Multiple layers of confirmation. One structured trading plan. OPEN COMPLETE USER GUIDE MULTI-CONDITION SETUP ENGINE At
Plus de l'auteur
CRT MTF is a multi-timeframe Candle Range Theory indicator for MetaTrader 5. It finds the CRT model on up to two higher timeframes, draws its range on the chart you trade and shows the higher-timeframe candles next to the price. 1. CRT Model A CRT model is built from two candles of the chosen timeframe. The first is the range candle. The second is the trap candle: it takes one side of the range candle and closes back inside the range. - Bearish CRT: the trap candle trades above the high of t
FREE
CRT + Daily Bias – Milana Trades A clean tool for Candle Range Theory (CRT). It marks the CRT range on your chart and shows the daily and weekly bias in one small table. WHAT IS CRT One candle sets a range: its high and its low. The next candle takes out one side of that range and closes back inside. This is the sweep. After the sweep, the opposite side of the range becomes the target. WHAT THE INDICATOR DRAWS - CRT H and CRT L – the high and low of the range candle. - 0.5 – the middle of th
FREE
CRT Pro is a complete Candle Range Theory toolkit for MetaTrader 5. It finds the CRT model on up to three timeframes and adds the tools needed to read it: higher-timeframe candles, structure shifts, fair value gaps, liquidity sweeps, a bias table and SSMT divergence. Every module can be switched on or off. 1. CRT Model A CRT model is built from two candles of the chosen CRT timeframe. C1 is the range candle. C2 is the sweep candle: it takes the high or the low of C1 and closes back inside the
MSNR is a Malaysian SNR indicator for MetaTrader 5. It finds support and resistance levels from candle bodies on D1, H4 and H1, shows which of them are fresh, and adds a dashboard with the current session and the storyline. 1. A and V Levels Levels are taken from candle bodies, the same points that form peaks and valleys on a line chart. - A shape (resistance): a bullish candle followed by a bearish one. The level is the higher of the first close and the second open. - V shape (support): a b
FREE
MSnR Pro Setups and Storyline MSnR Pro is an indicator for traders who use the Malaysian Support and Resistance method. It draws the levels of five timeframes, tracks how each level is used, follows the storyline of every timeframe and finds complete setups with a grade from C to A+. Levels The indicator builds levels from the closed candles of M, W, D, H4 and H1. Only candle bodies are used, wicks are ignored. A level: a bullish candle followed by a bearish one. Resistance. V level: a bearish c
Detects liquidity grabs (swing failure patterns) and rejection blocks. Marks the swept swing level, the structure-break confirmation level and the reaction zone, with alerts and a built-in dark/light theme. Full description Overview SFP Rejection Block is a chart-analysis indicator for MetaTrader 5. It automatically finds two price-action patterns and draws them on the chart: Liquidity grabs (swing failure patterns, SFP): a candle wicks beyond the latest swing high or low but closes back on the
FREE
SMT + PSP/PCP MTF compares your chart with correlated instruments and highlights where their behavior diverges What it shows SMT divergence. The indicator draws lines between swing highs or lows where one asset takes liquidity and the correlated asset does not. Bullish and bearish lines have separate colors, styles and widths. PSP / PCP signals. The indicator marks candles where the correlated assets diverge at swing points. You can use text labels, candle coloring (aqua for bullish, orange for
FREE
Swings · Milana Trades Swings shows the most recent swing highs and swing lows on your chart without clutter. Each swing gets a small dot at the extreme and a short dotted line to the right, so you can see key levels and the structure of the move at a glance. How to read it Blue dot and line: the swing is higher than the previous swing of its kind. A higher high or a higher low is a rising structure. Grey dot and line: the swing is lower than the previous swing of its kind. A lower high or a low
FREE
MSS Levels HTF
Milana Muslimova
MSS Levels HTF - Milana Trades Higher-timeframe Market Structure Shift levels that turn into Support / Resistance and Mirror levels as price interacts with them. THE IDEA When price breaks a swing high or swing low on a higher timeframe, that swing becomes an important reference level. The indicator marks it, then follows how price reacts to it: first touch, retest, and finally a flip to the other side. Everything is drawn on your current chart, so you can work on a lower timeframe, while the
FREE
Liquidity Grabs (Swing Failure Patterns) Fair Value Gaps (FVG) Market Structure Shifts / Break of Structure (MSS/BOS) Alerts It identifies potential bullish and bearish liquidity grabs, confirms them optionally using volume validation on a lower timeframe, and tracks subsequent price structure changes. The indicator visually marks key swing highs/lows, FVG zones, and BOS/MSS levels—allowing traders to observe how price reacts to liquidity and imbalance zones.  Features: Swing Failure
FREE
AR Projection
Milana Muslimova
Average Range Projection (ADR / AWR / AMR) – Milana Trades This indicator shows how far price can still move today, this week or this month, based on its average range. THE IDEA Every market has a normal size of a day. If the market usually moves 100 points a day and the low of the day is already in, the high of the day is likely to be about 100 points above that low. The indicator draws this for you. WHAT MAKES IT DIFFERENT Most ADR tools draw fixed levels from the open. This indicator uses
FREE
CRT + Volume Profile  Candle Range Theory levels on several timeframes, filtered by the previous session's volume profile, with lower-timeframe entries (CISD / MSS) and strips of higher-timeframe candles drawn right of price. One indicator for the whole CRT workflow: where the range is, whether the sweep happened at a level that matters, and where the entry shift is. HOW THE CRT MODEL IS DETECTED - C1 is the range candle. Its high and low become CRT H and CRT L, with the 0.5 level between the
Filtrer:
CodeFaceCrunch
641
CodeFaceCrunch 2026.11.07 08:43 

Very useful.

Répondre à l'avis