YuRaLytics Trade Analyzer
- Utilitaires
- Version: 1.0

YuRaLytics Trade Analyzer reads the trade history of your account and breaks it down. You see which Expert Advisors and symbols make or lose money and how much commission and swap take out of the result. It also tests whether the average trade is large enough to tell apart from luck. The panel only reads history and never opens, changes or closes a trade, so you can run it next to live Expert Advisors.
What it shows
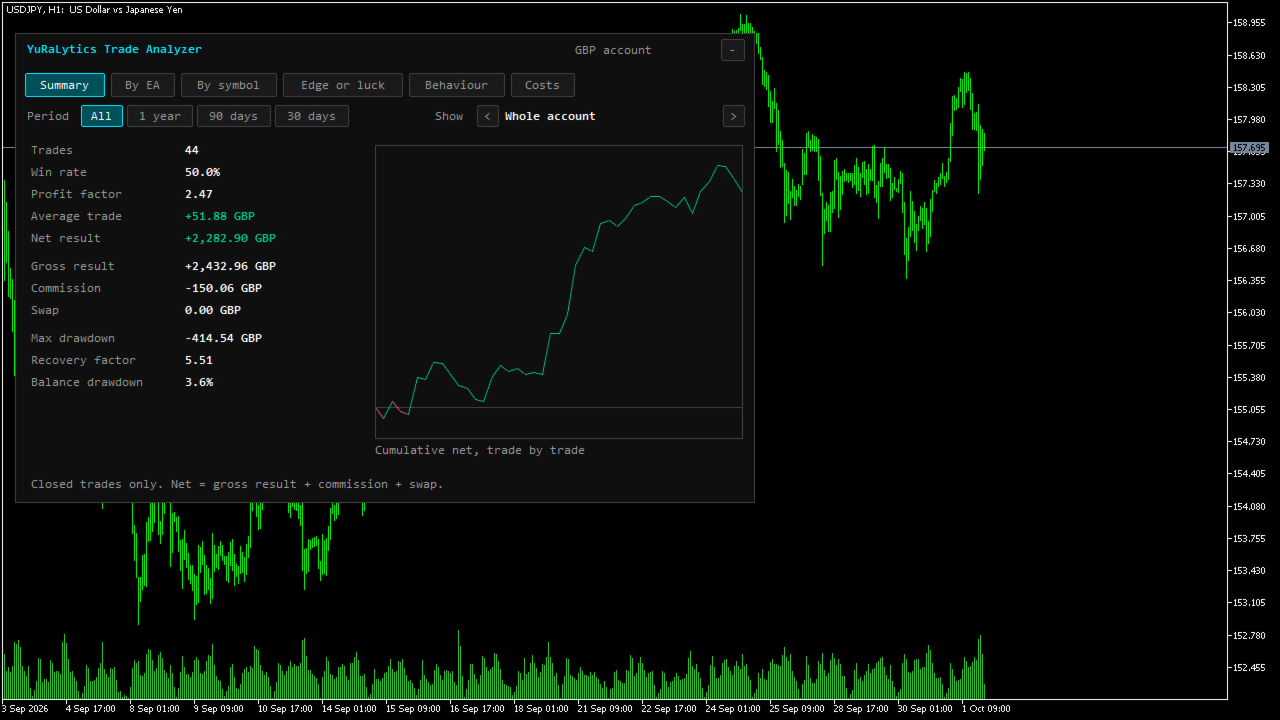
- Summary: trades, win rate, profit factor, average trade, net result, gross result, commission, swap, maximum drawdown, recovery factor and balance drawdown in percent. The equity curve is drawn alongside, trade by trade.
- By Expert Advisor and by symbol: the same figures for each magic number and each symbol, sorted by net result.
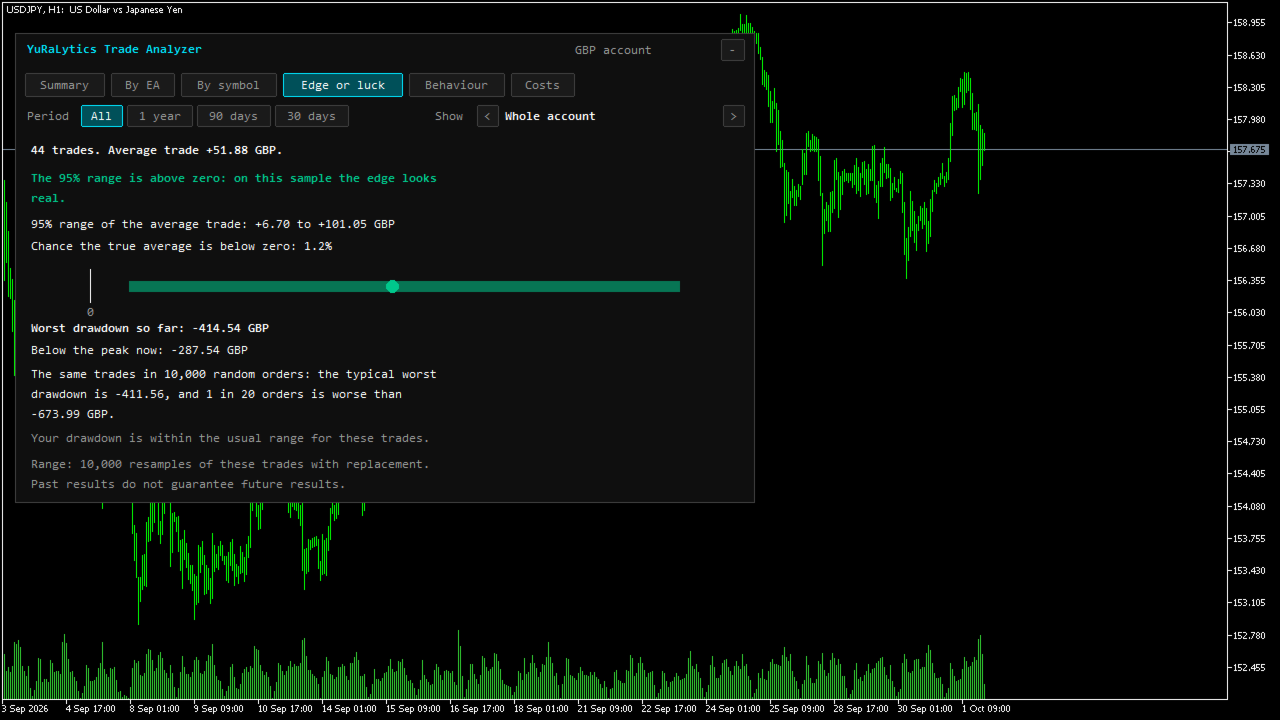
- Edge or luck: your trades are resampled 10,000 times to find a 95% range for the average trade. If the whole range sits above zero, the edge looks real on this sample. If it includes zero, the result could still be luck. The panel also gives the chance that the true average is below zero, and compares your worst drawdown with the worst drawdown of the same trades in 10,000 random orders.
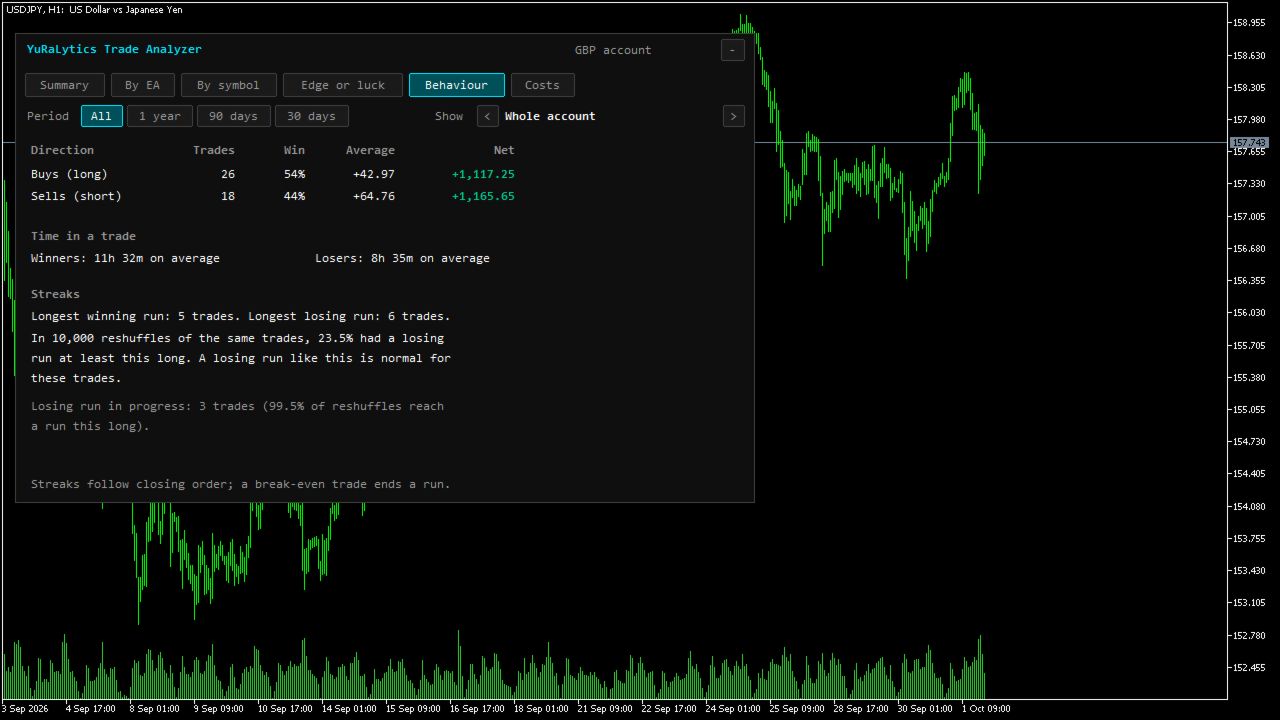
- Behaviour: buys against sells, the average time spent in winning and losing trades, and the longest winning and losing runs. For the losing run it shows how often a run that long turns up when the same trades are reshuffled, which tells you whether a bad streak is normal for the strategy. If a losing run is still going, the panel shows how common a run of that length is too.
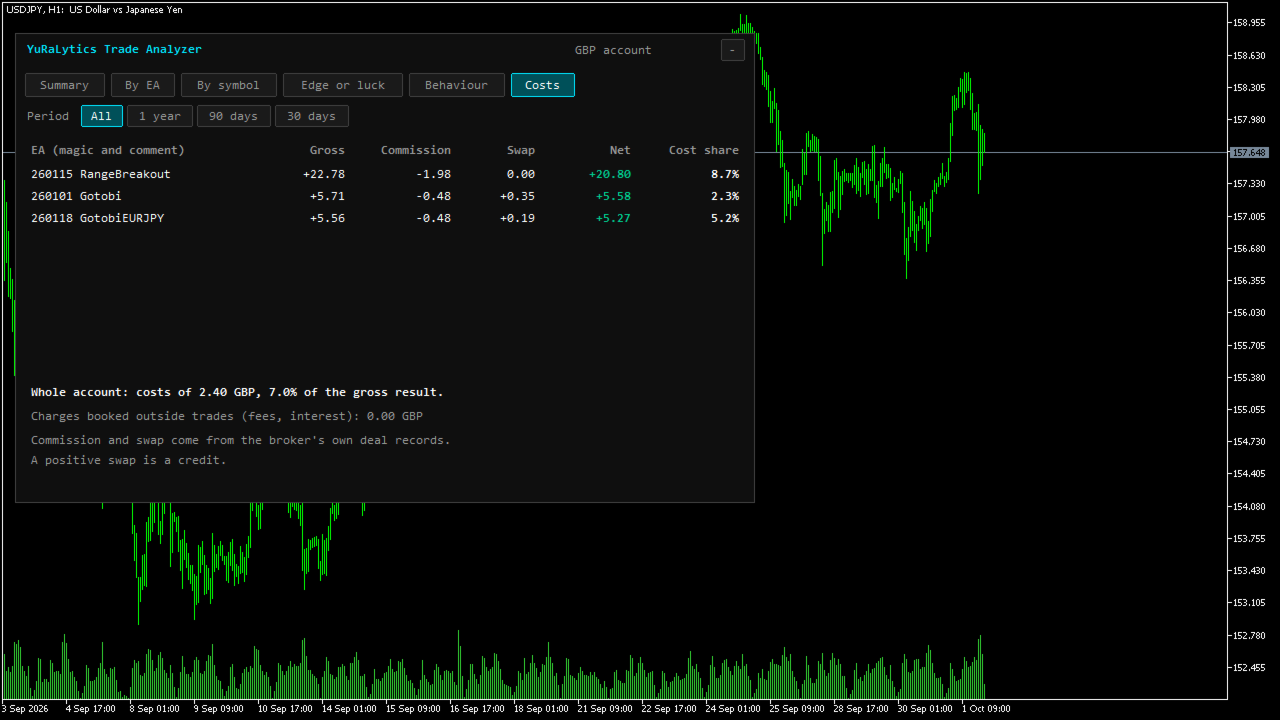
- Costs: gross result, commission, swap and net result for each Expert Advisor, and the share of the gross result that went on costs. The figures come from your broker's own deal records, so they match what you were charged. Charges booked outside trades, such as fees or interest, are shown separately.
- Alerts, optional: a pop-up or push notification when an Expert Advisor falls further below its peak than the worst drawdown in 19 of 20 reshuffles of its own trades. You can also be told when its losing run in progress has become unusual, meaning fewer than 1 in 20 reshuffles of its own trades contain a run that long.
You can switch between the whole history, the last year, 90 days or 30 days, and between the whole account and one Expert Advisor.
How trades are counted
A trade is every deal of one position, counted once the position is closed. Net result is the gross result plus commission and swap. On netting accounts, a position that is reversed counts as one trade. Open positions appear once they close.
Parameters
Panel
- Panel distance from the left and from the top, in pixels
- Font size
Analysis
- Monte Carlo reshuffles: 1,000 to 100,000 (default 10,000)
- Fewest trades for an edge-or-luck verdict (default 30)
- Include manual trades, made without an Expert Advisor (on by default)
Alerts
- Alert when an Expert Advisor falls deeper than 19 in 20 reshuffles (off by default)
- Alert when an Expert Advisor's losing run is rarer than 1 in 20 reshuffles (off by default)
- Also send a push notification to the MetaTrader app (off by default)
Notes
- The panel only reads the account's history and never trades.
- The figures describe past trades. Past results do not guarantee future results.
- With fewer than 30 trades the edge-or-luck test says the sample is too small to judge.
Made by YuRa Trading. We test trading strategies on real tick data and publish every result: https://yuratrading.com