Hilo Flow
- Indicateurs
- Version: 1.4

🚀 Master Market Trends with the Hilo Flow Indicator
Stop trying to predict the market and let the colors guide your decisions.
Hilo Flow is the visual evolution of the classic HiLo Activator. Designed for traders who seek extreme clarity, it eliminates chart clutter and translates market flow strength directly into candle colors.
Forget confusing lines and hesitation when aking decisions. With Hilo Flow, you can clearly identify potential moments to enter, hold a position, or exit a trade.
How Does the Magic Work?
-
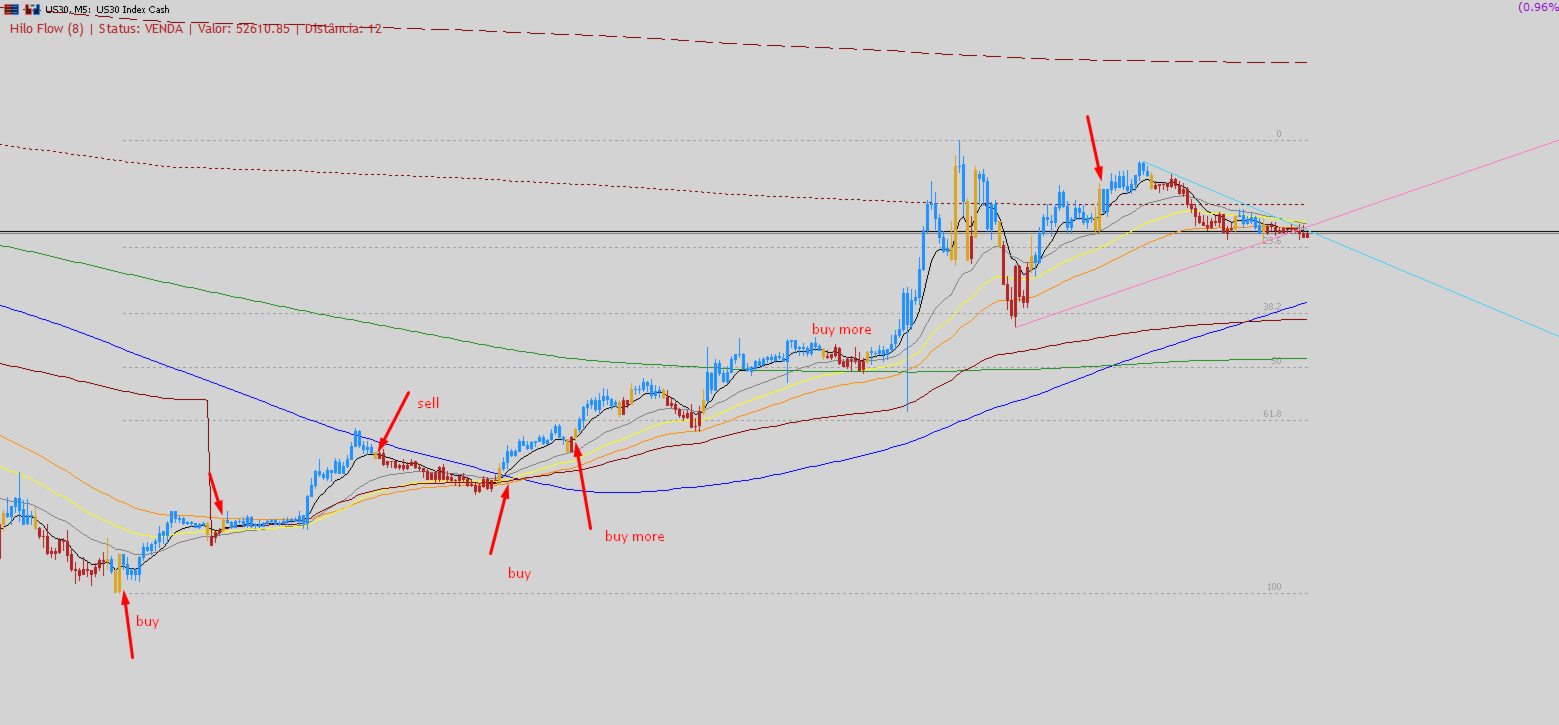
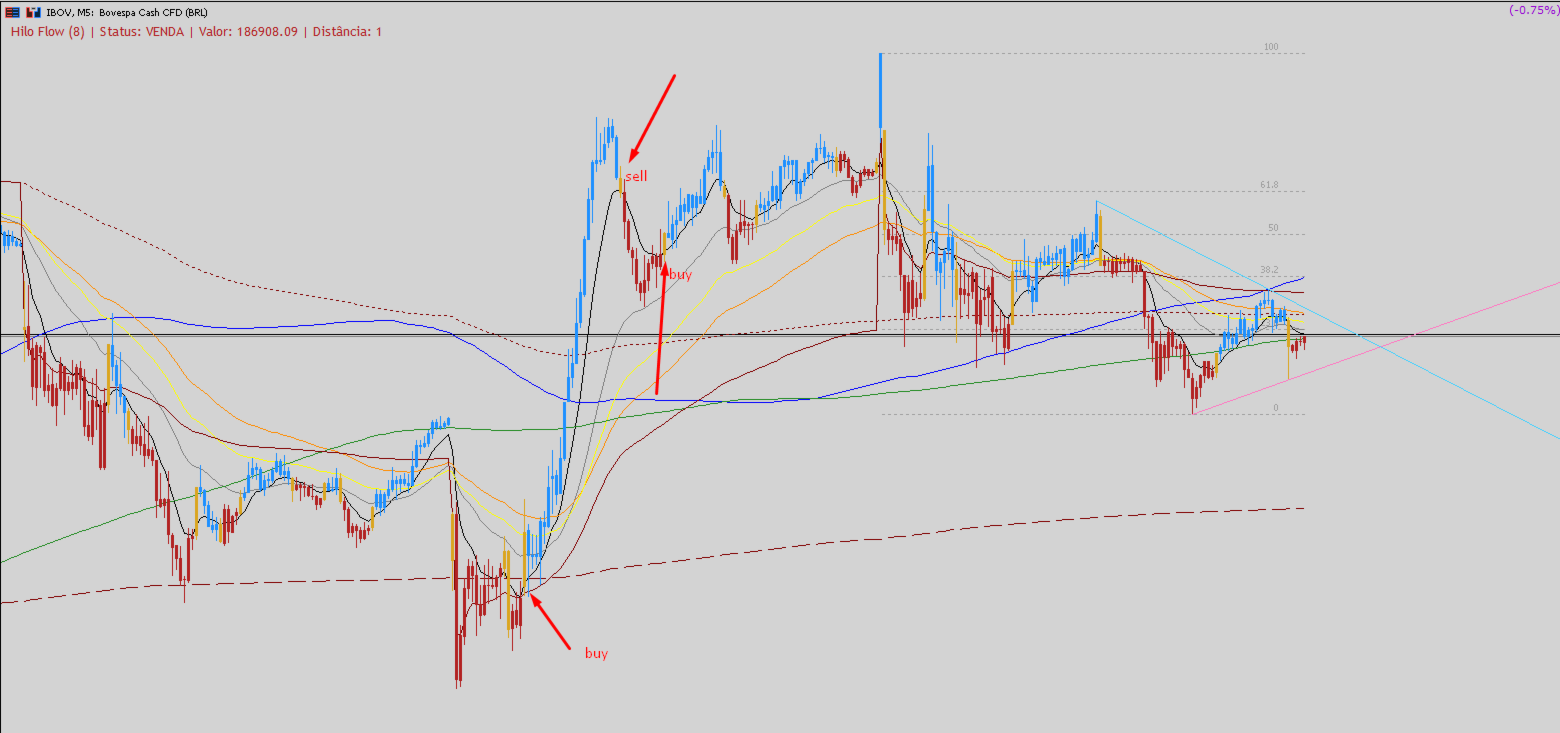
🔵 Blue Candles: Confirmed bullish trend. Focus on potential long positions or follow the movement.
-
🔴 Red Candles: Bearish trend in control. Focus on potential short positions.
-
🟡 Gold Candles: The "Golden Trigger." Signals potential exhaustion of the current trend and highlights an area where a reversal may develop. Use it as a visual alert to review existing positions or prepare for a potential new entry.
Why Use Hilo Flow in Your Trading Strategy?
-
Reduced Emotional Bias: The color-based approach provides a clear visual framework. When the market is blue, avoid forcing short setups; when it is red, avoid forcing long setups.
-
Precise Entries: Use the Gold Candle as an early warning that the current movement may be losing strength and that a new trend leg could be developing.
-
Clean Charts: Trade with a clean Price Action approach without dozens of moving averages crossing your screen.
-
Versatile: Hilo Flow can be applied to index futures, currency futures, stocks, crypto, and Forex, across different timeframes, making it suitable for both day trading and swing trading.
Turn hesitation into clarity. Get Hilo Flow and trade with the direction of the trend! 📈📉
The Power of Confluence: Combining Hilo Flow with Market ContextIn professional trading, opportunities often become clearer when different tools provide consistent information about the same market context.
Hilo Flow is designed to visualize market direction, but when combined with broader market context, it can become part of structured trading setups based on multiple confirmations.
Learn how to combine Hilo Flow with Moving Averages, VWAP, and Fibonacci to identify potential entries and define risk more effectively.
1. Hilo Flow + VWAP — Tracking Market Participation
VWAP represents the volume-weighted average price and is widely used by traders as a reference point during the trading session.
The Setup
If Hilo Flow turns 🔵 Blue while price is trading above VWAP, this can provide a bullish confluence for traders looking for potential long setups.
Potential Reversal Signal
If price approaches VWAP, forms a 🟡 Gold Candle suggesting hesitation or a potential reversal, and subsequently turns 🔴 Red while rejecting the level, this can provide a bearish confirmation for traders monitoring a potential short setup.
2. Hilo Flow + Moving Averages — Macro Trend Alignment
Use traditional moving averages, such as the 20-period or 200-period moving average, to help define the broader trend and use Hilo Flow as a potential entry trigger.
The Golden Filter
If price is trading above the 200-period moving average, the broader market structure may be considered bullish.
In this context, traders may choose to give less weight to temporary red Hilo Flow candles, treating them as potential corrections, and instead wait for the 🔵 Blue Flow to return before considering long setups.
This approach can help reduce the number of trades taken against the broader market direction.
3. Hilo Flow + Fibonacci — Identifying the End of a Pullback
Markets often move through cycles of impulse and retracement. One of the biggest challenges for traders is identifying when a pullback may be coming to an end.
The Trigger
Draw Fibonacci levels across the most recent bullish impulse.
Price begins to retrace, producing red candles, and reaches an important Fibonacci retracement area such as 50% or 61.8%.
If a 🟡 Gold Candle appears around that area, it can serve as an alert that the retracement may be losing strength.
A subsequent 🔵 Blue Candle can then provide additional visual confirmation that bullish momentum may be returning.
🛡️ Structured Stop-Loss PositioningOne of the benefits of using market confluence is the ability to define your Stop Loss based on market structure rather than using an arbitrary financial distance.
Imagine you enter a long position when Hilo Flow turns Blue, while the setup also aligns with VWAP and a 50% Fibonacci retracement level.
Your Stop Loss could then be positioned below the relevant structural support areas, depending on your trading plan and risk management rules.
For the market to invalidate the setup, price may need to break through several levels of support:
-
The Hilo Flow structure.
-
The VWAP support area.
-
The Fibonacci support region.
Think of it as positioning your stop behind multiple layers of market structure rather than relying on a single arbitrary level.
However, no combination of indicators can eliminate false breakouts or guarantee a successful trade. Proper position sizing, risk management, and disciplined execution remain essential.
ConclusionHilo Flow helps identify the "when."
VWAP, Moving Averages, and Fibonacci help provide the "where."
When combined, these tools can create a structured framework for analyzing market direction, potential entries, and risk.
Hilo Flow — Clearer Charts. Structured Analysis. Smarter Execution.