Trading Journal Analyzer
- Utilitaires
- Version: 1.0
- Activations: 5

Trading Journal Analyzer
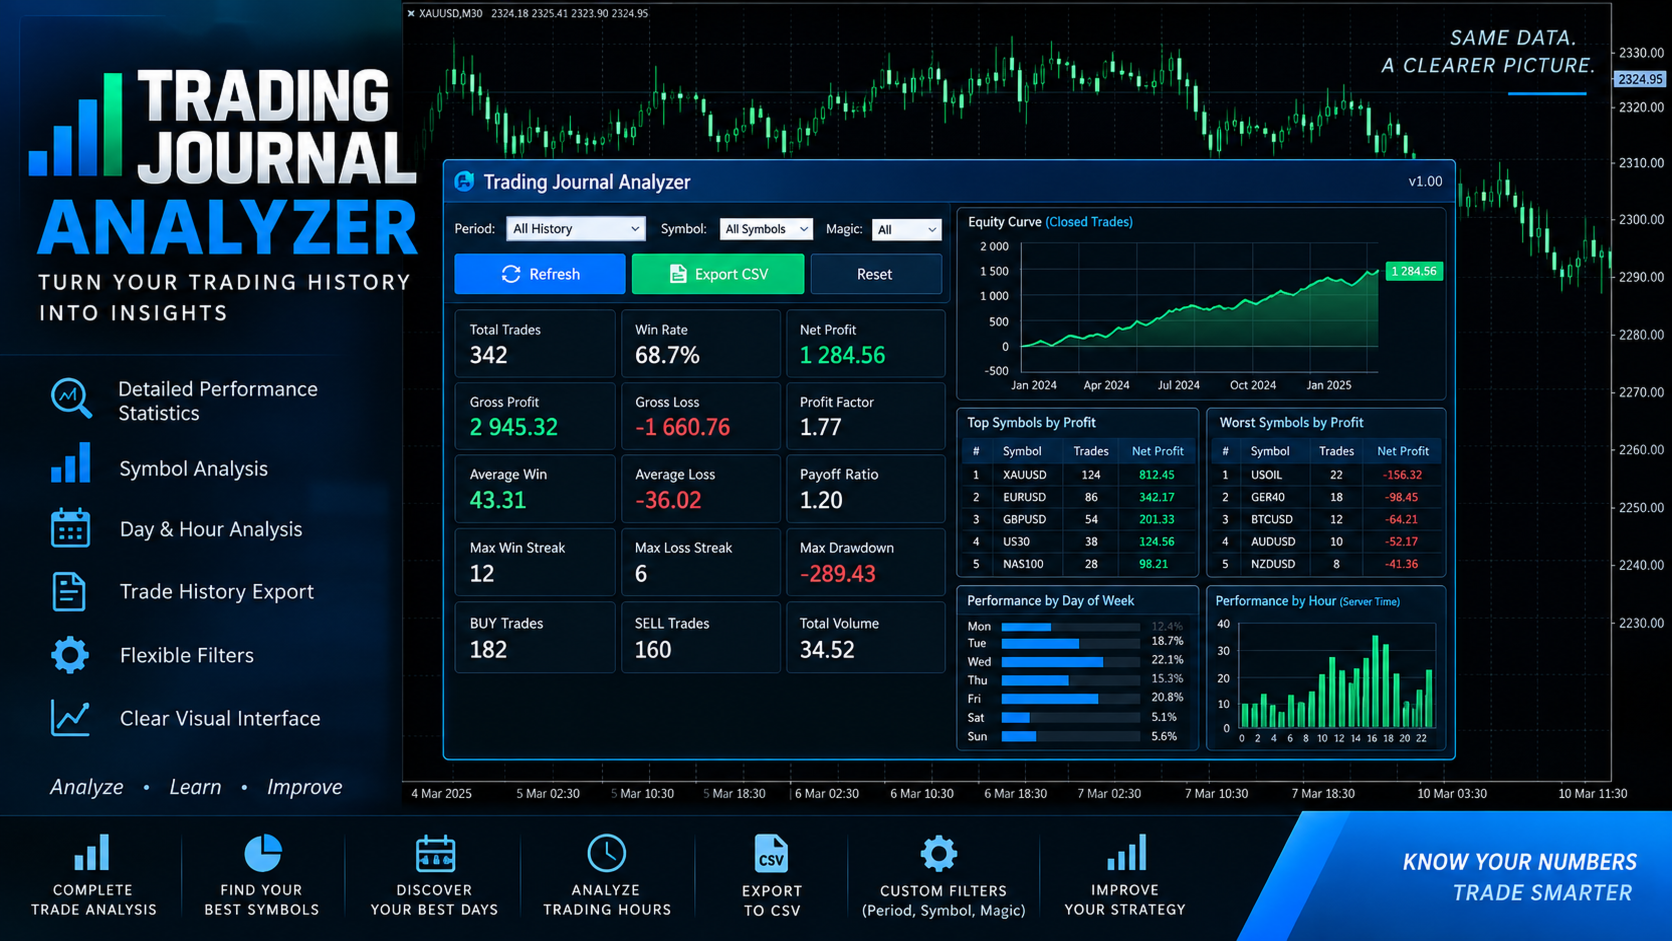
Trading Journal Analyzer is a professional trade history analysis utility for MetaTrader 5.
It helps traders review their historical trading performance directly inside MT5. Instead of manually calculating statistics from account history, the utility analyzes completed trades and presents important performance metrics in a simple on-chart panel.
The program does not open, modify, or close trades. It is designed purely for trade history analysis and performance review.
MAIN FEATURES
- Automatic analysis of MT5 trading history
- Clean on-chart statistics panel
- Total number of analyzed trades
- Win rate calculation
- Net Profit/Loss analysis
- Gross Profit and Gross Loss
- Profit Factor calculation
- Average winning trade
- Average losing trade
- Payoff Ratio
- BUY and SELL trade statistics
- Maximum consecutive winning trades
- Maximum consecutive losing trades
- Best-performing symbol
- Worst-performing symbol
- Best trading day of the week
- Worst trading day of the week
- Best trading hour
- Worst trading hour
- Historical closed-trade drawdown estimation
- Manual Refresh button
- CSV export
PERFORMANCE OVERVIEW
Trading Journal Analyzer provides a quick overview of important trading statistics.
The panel displays information such as:
Total Trades
Win Rate
Net P/L
Profit Factor
Gross Profit
Gross Loss
Average Win
Average Loss
Payoff Ratio
Maximum Drawdown
BUY / SELL Trade Count
Winning and Losing Streaks
This allows traders to evaluate their historical results without leaving the MetaTrader 5 platform.
SYMBOL ANALYSIS
When multiple instruments have been traded, the utility analyzes the results by symbol.
It identifies the best-performing and worst-performing symbols based on the selected trading history.
This can help traders understand which markets have historically produced better or worse results for their trading activity.
DAY AND TIME ANALYSIS
Trading Journal Analyzer also analyzes performance according to the day of the week and trading hour.
The panel identifies:
- Best-performing day
- Worst-performing day
- Best-performing hour
- Worst-performing hour
This information can help traders review whether certain periods have historically been more or less effective for their trading.
HISTORY FILTERING
The analysis period can be configured using the Lookback Days setting.
Users can also choose to:
- Analyze all available symbols
- Analyze only the current chart symbol
- Filter trades using a specific Magic Number
This makes the utility suitable for both manual traders and users who want to review the historical results of a specific Expert Advisor.
CSV EXPORT
Trading history can be exported to a CSV file directly from the panel.
The exported data includes information such as:
- Trade time
- Symbol
- Trade type
- Volume
- Price
- Profit
- Swap
- Commission
- Net P/L
- Magic Number
- Trade comment
The CSV file can be used for additional analysis in spreadsheet or data-analysis software.
EASY TO USE
1. Attach Trading Journal Analyzer to any chart.
2. Select the desired history period.
3. Configure optional symbol or Magic Number filters.
4. The utility automatically analyzes the trading history.
5. Use REFRESH to update the statistics.
6. Use EXPORT CSV when you want to export the analyzed trade history.
WHO IS IT FOR?
Trading Journal Analyzer can be useful for:
- Manual traders
- Forex traders
- Gold traders
- Index traders
- Expert Advisor users
- Strategy developers
- Traders reviewing historical account performance
IMPORTANT
Trading Journal Analyzer is an analytical utility.
It does not provide trading signals, predict future market movements, automatically execute trades, or guarantee profitable trading.
Historical performance does not guarantee future results.
The statistics generated by the utility are intended to help users review and better understand their historical trading activity.