Htf Level Projector
- Indicateurs
- Version: 1.0
- Activations: 5

# HTF Level Projector - The levels everyone watches
*Category: Multi Timeframe Hybrids | Difficulty: beginner | Window: chart window (overlaid on price) | Markets: Universal (Forex, indices, commodities, crypto, stocks) | Suggested timeframes: M5, M15, M30, H1, H4*
## Short description
> Projects onto the current chart the high, low and close of the last complete higher period, updating only on period close.
## Full description
### Overview
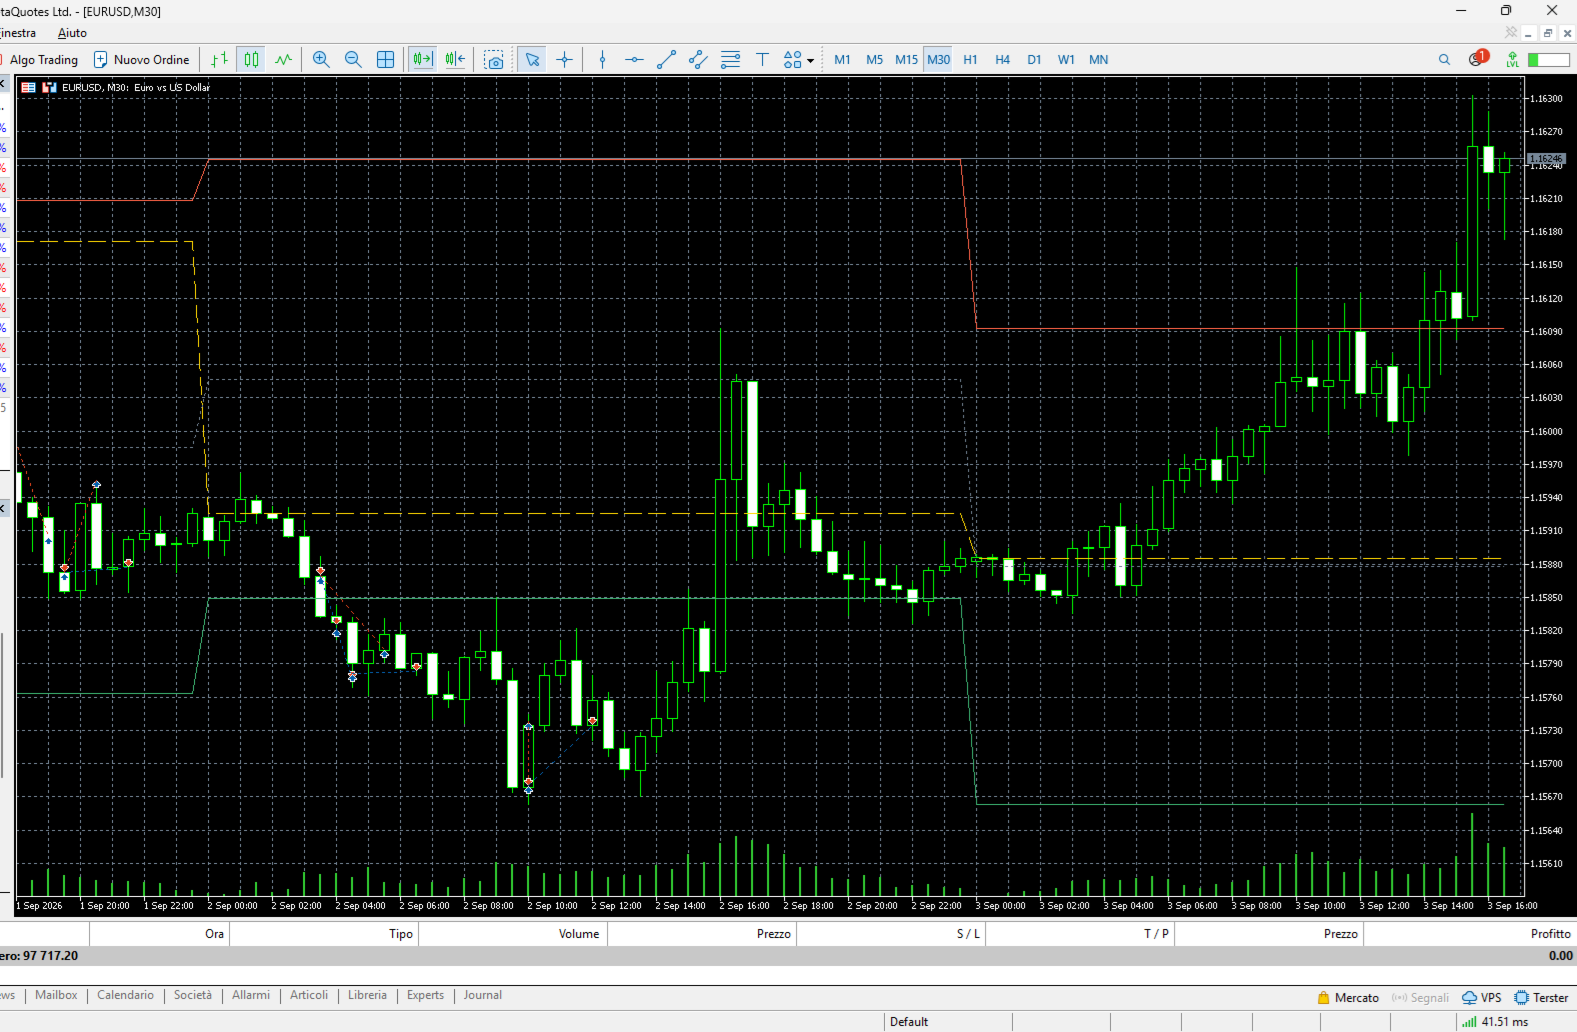
Yesterday high and low are shared references, not personal conventions: they are levels operators genuinely watch, appear in reports and attract orders. Anyone trading M15 without knowing where yesterday low sits is ignoring a level everyone else is watching, and will face seemingly inexplicable reactions. This indicator projects onto the current chart the four higher period levels that matter most in practice: high, low, close and midpoint. The levels update only at the higher period close and stay still for its entire duration, so they can be used for pending orders with no risk of shifting. Using the forming bar would show a high that can still rise, which would be useless for any operational purpose.
### How the calculation works
1. For every bar the higher timeframe bar containing it is located.
2. The preceding one is then taken, that is the last period fully closed at that moment.
3. From that period the high, low and close are read, values that are by now final.
4. The midpoint is the half sum of high and low, often used as an equilibrium reference.
5. If higher timeframe data are not yet available nothing is drawn, rather than showing wrong levels.
6. The two optional lines can be hidden by parameter, to declutter the chart.
### How to use it
- Treat the previous period high and low as the main reference levels of the day.
- Breaking the previous high with a close beyond it is one of the most widely followed continuation signals.
- The midpoint often acts as an attractor on days with no defined direction.
- Since the levels are fixed for the whole period, they can be used directly for pending orders at the start of the day.
- On M15 the automatic higher timeframe is H4: to get daily levels it is best to set it manually to D1.
### Who it is for and on which timeframes
It suits anyone trading intraday, from beginner to professional, because the levels it draws are universally recognised and require no interpretation. It works from M5 to H4. It produces no signals and no operational indication should be sought in it: it provides references, which each trader then uses according to their own method. It is probably the simplest indicator of the whole category and also one of the most useful.
### Practical example of reading a signal
On US500 M15 with the higher timeframe set to D1, the three lines show yesterday high at 5285, the low at 5240 and the close at 5272. The market opens at 5268, inside yesterday range. In the first hour it rises to 5283, stalls just below the previous high and retraces: the classic reaction at a level everyone watches. In the afternoon it breaks 5285 with a close at 5291 and continues to 5310. The trader with a pending order just above yesterday high was filled automatically, without having to watch the chart, because that level was fixed and known from the open.
## Input parameters
| Parameter | Default | Description |
|---|---|---|
| `InpHigherTf` | PERIOD_CURRENT | Higher timeframe the levels are read from. With the default value a sensible multiple is chosen automatically. |
| `InpShowMid` | true | Draws the period midpoint. Disabling it declutters the chart without touching the other levels. |
| `InpShowClose` | true | Draws the previous period close, the reference used to compute the daily change. |
## Advantages / strengths
- The levels drawn are universally recognised references, not personal conventions.
- They stay still for the whole period and are therefore usable for pending orders.
- No repaint: it uses exclusively fully closed periods.
- Extremely simple to understand and use, with no learning curve.
## Limitations and warnings
- It shows only the immediately preceding period: levels from two days ago do not appear.
- The automatic higher timeframe choice may not match the desired one and often needs correcting.
- It produces no signal: it provides references and nothing more.
- On instruments with limited higher timeframe history the lines can be missing entirely.
**No repaint:** values printed on a closed bar are never modified afterwards.
**Disclaimer.** This product is a technical analysis tool, not an automated trading system, and it offers no profit guarantee whatsoever. Financial markets carry the risk of total loss of the invested capital. Past performance is not indicative of future results. Every signal must be confirmed with your own analysis, a money management plan and prior testing on a demo account. The author is not responsible for trading decisions taken on the basis of this indicator.
## Suggested tags / keywords for MQL5
`multi timeframe`, `levels`, `previous day`, `support resistance`, `no repaint`, `intraday`, `reference`, `pending orders`