Cs2 Fixed Range Volume Profile
- Indicateurs
- Version: 1.0
- Activations: 5

Fixed Range Volume Profile
MT4 Volume Profile Indicator — Auto-Detecting Trendline Tracking, POC, Value Area & High Volume Nodes in Real Time
Fixed Range Volume Profile (FRVP) displays volume distribution over a user-defined range — automatically detecting the latest trendline you draw or drag on the chart.
No manual range selection. No naming conflicts. Just draw a trendline and the profile appears. Update it live by dragging.
MT4 Native • No Repainting • Real-Time Trendline Tracking • Fully Customizable
The Idea in One Line
Volume distribution. Value areas. High-volume nodes. All from your trendline.
What the Indicator Does
Fixed Range Volume Profile answers one core question:
Where did volume actually concentrate across the range I care about?
The indicator locks onto the exact trendline you are creating or dragging (via OnChartEvent ), calculates volume distribution across that range, and displays it directly on your price chart — with Point of Control, Value Area boundaries, and High Volume Nodes all rendered in real time.
Drag the line, and the profile updates live.
Key Strengths
Real-Time Trendline Tracking
Tracks the exact trendline you are creating or dragging via OnChartEvent . No guessing. No naming conflicts.
Chart Background Blending
Colors adapt to your actual chart background — professional appearance on any color theme.
Point of Control (POC)
The price level with the highest volume.
Value Area (VAH + VAL)
The tightest band holding 70% of total volume (configurable).
High Volume Nodes (HVN)
Volume levels above 1.5× average (configurable threshold).
Genuine Extend Lines Right
POC / VAH / VAL lines can be extended to the right as true rays.
Stability Safety Cap
Prevents performance issues when scanning across thousands of bars (Max Range Bars).
Fully Customizable
Rows, value area percentage, colors, opacity, profile side.
No Repainting
All calculations are historical.
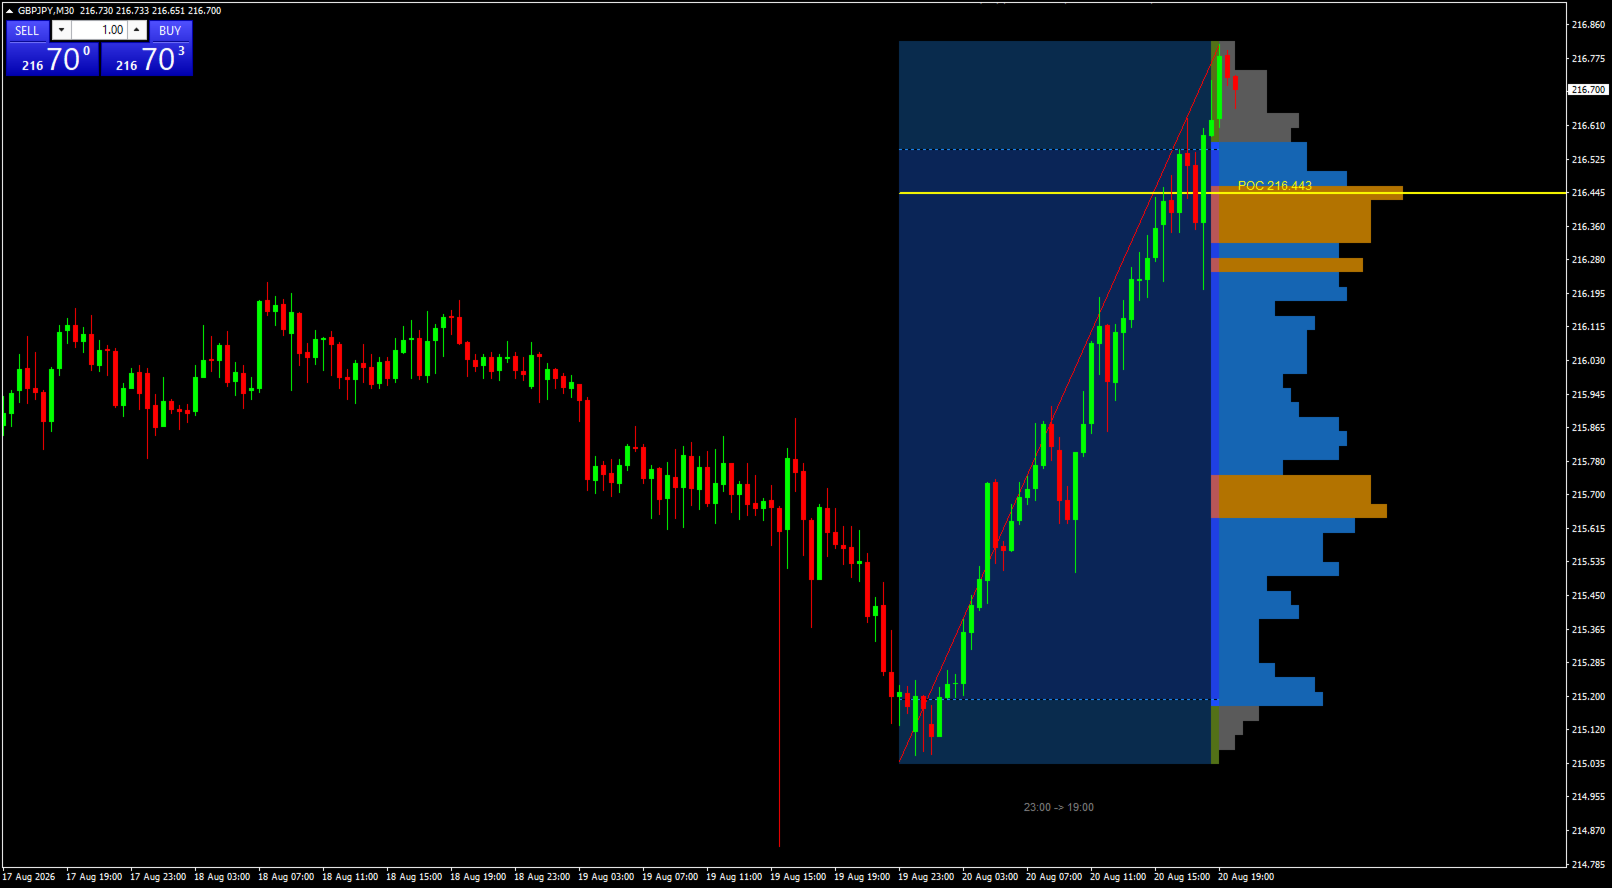
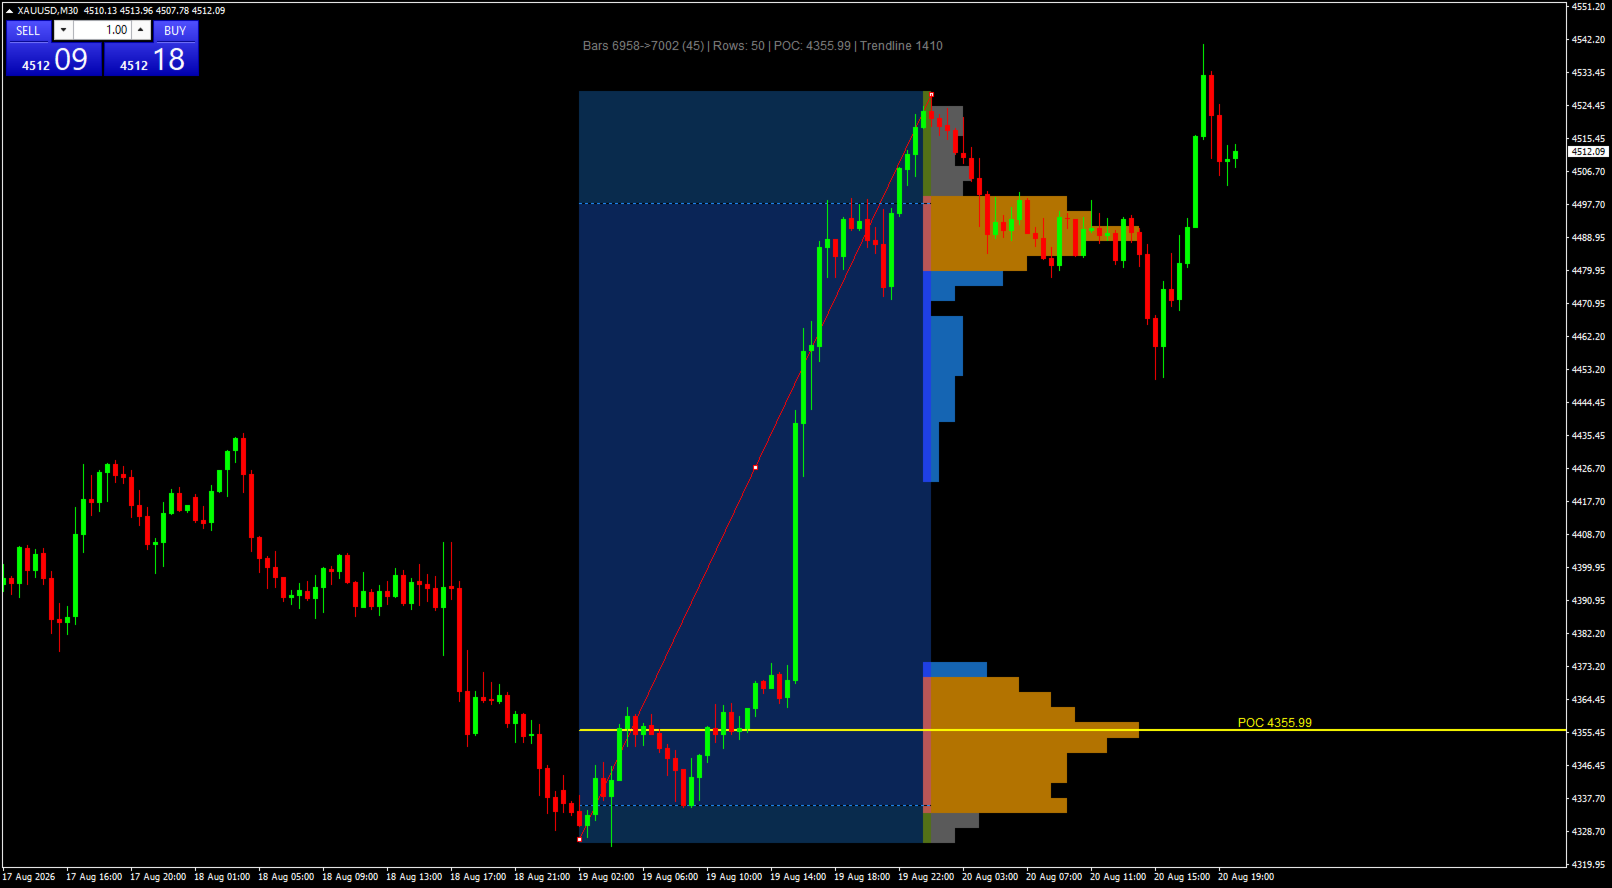
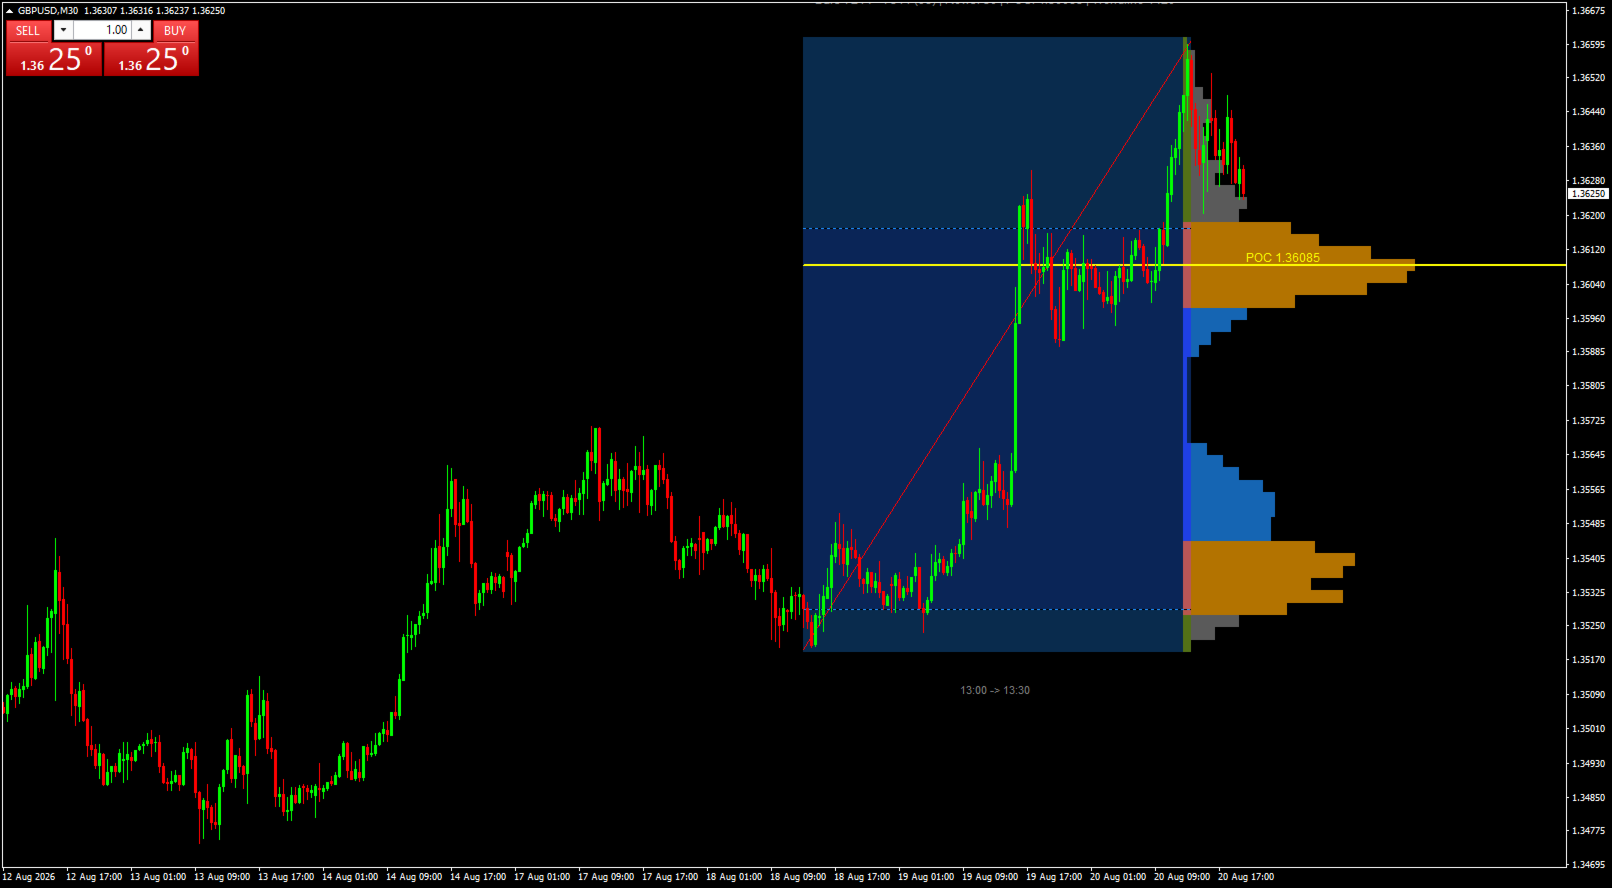
What You See on the Chart
-
Yellow horizontal line → Point of Control (POC)
-
Blue dashed lines → Value Area High (VAH) and Value Area Low (VAL)
-
Orange bars → High Volume Nodes (HVN)
-
Gray bars → Low volume nodes
-
Shaded region → Value Area (70% of volume)
-
Histogram → Volume distribution by price level
-
Info banner → Range, rows, POC, trendline name
-
POC price tag → Always visible near current price
How It Works
-
Draw a trendline on the chart.
-
The indicator locks onto the specific line you are creating or dragging.
-
Volume profile is calculated from the trendline's range.
-
POC, VAH, VAL, and HVN are displayed.
No naming required. No manual range selection. The profile updates live as you drag the line.
Enhancement over the original version: This MT4 version uses OnChartEvent to track your exact line — avoiding conflicts with EA-drawn lines or naming issues.
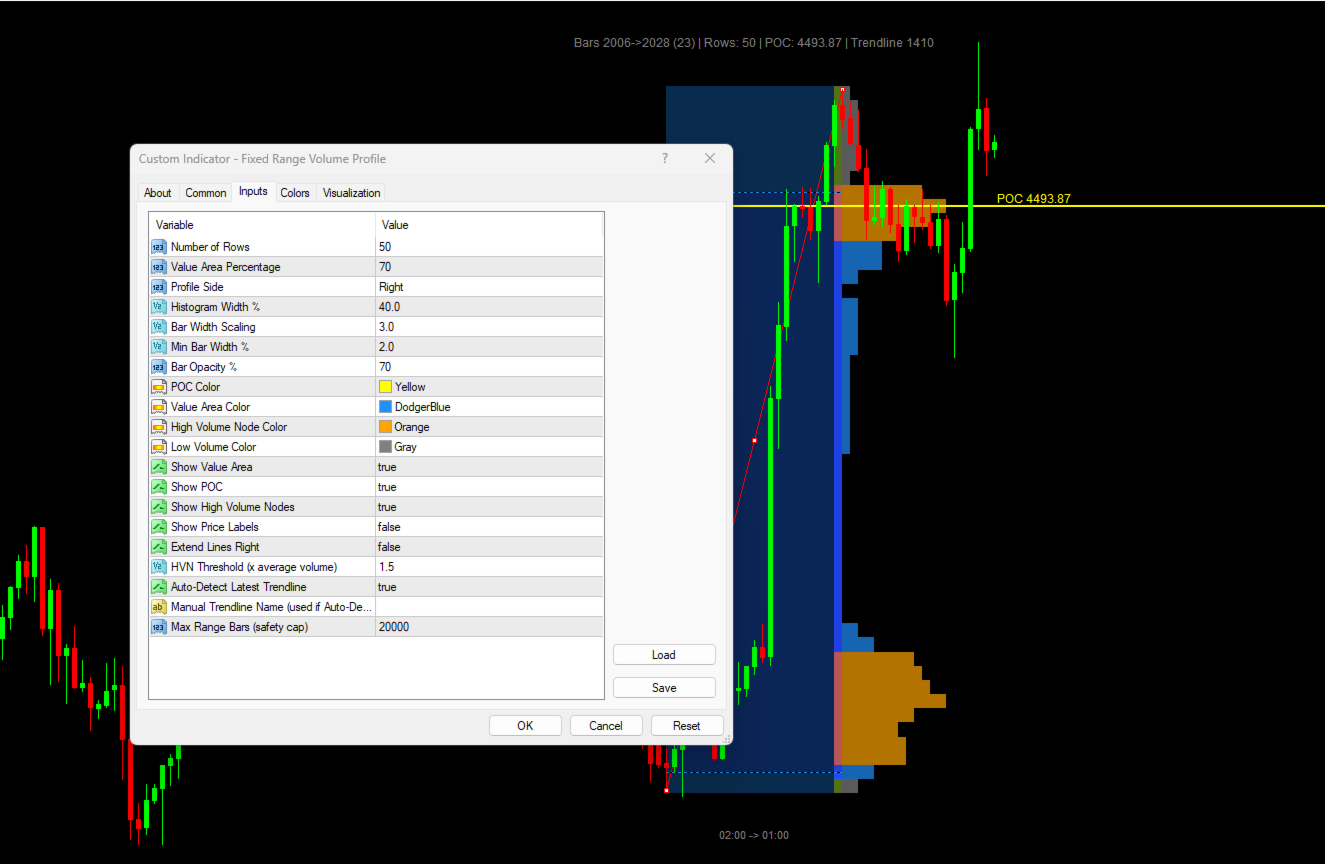
Parameter Architecture
Profile Settings
Number of Rows (10–200) · Value Area Percentage (1–100)
Visual Settings
Profile Side (Left or Right of range) · Histogram Width Percent · Bar Width Scaling · Min Bar Width Percent · Bar Opacity (10–100)
Colors
POC Color · Value Area Color · High Volume Node Color · Low Volume Color
High Volume Nodes
HVN Threshold — volume multiplier to qualify as HVN (1.0 to 3.0)
Trendline Settings
Auto-Detect Latest (default: true) · Manual Trendline Name (used if auto-detection is off)
Performance
Max Range Bars — safety cap for range size (default: 20000)
Practical Use Cases
-
Identify where most volume occurred
-
Find Point of Control (POC) for entries and exits
-
Use Value Area (VAH / VAL) for profit targets
-
Spot High Volume Nodes (HVN) for key levels
-
Understand volume distribution at a glance
-
Combine with other indicators for confluence
Technical Notes
-
Overlay indicator (draws on price chart)
-
Works on any timeframe and symbol
-
Real-Time Trendline Tracking via OnChartEvent
-
Chart Background Blending for colors
-
Genuine Extend Lines Right support
-
Safety cap for large data sets (Max Range Bars)
-
No repainting (historical calculation)
-
Optimized for performance
-
Compatible with MetaTrader 4
Upgrade Path
This indicator shows you volume distribution.
Structural Heat Zones takes it further — mapping participation intensity, acceptance vs. rejection, and market engagement across multiple zones.
Invictus EA uses structural technology to execute automated trades.
Search for these products in the MQL5 Market.
Support
Lifetime updates included.
For more information, click Developer's Profile below.
Fixed Range Volume Profile — MT4 Volume Profile Indicator | Fixed Range Volume Profile | FRVP MT4 | Auto Trendline Volume Profile | Point of Control | POC Indicator | Value Area High | Value Area Low | VAH VAL Indicator | High Volume Node | HVN Indicator | Volume Distribution | Volume Profile MT4 | Trendline Tracking | OnChartEvent Indicator | No Repaint Volume Profile | Market Profile MT4 | Volume Analysis MT4