FiboPlusTrend MT5
- Indicateurs
-
Sergey Malysh
 Professional knowledge and experience:
- Programmer.
- Forex Trader
- Chief Accountant.
- Chief Financial Officer.
- CEO. - Version: 2.1
- Mise à jour: 27 juin 2017
- Activations: 5
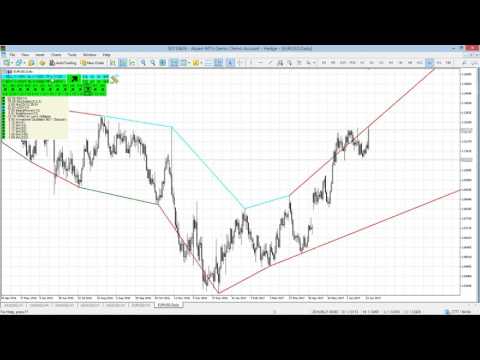
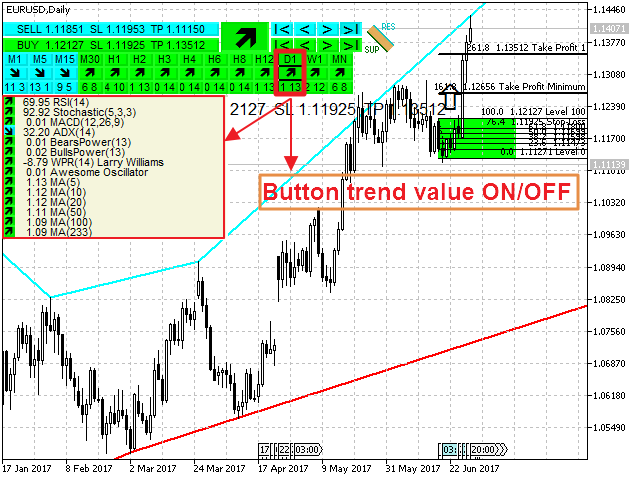
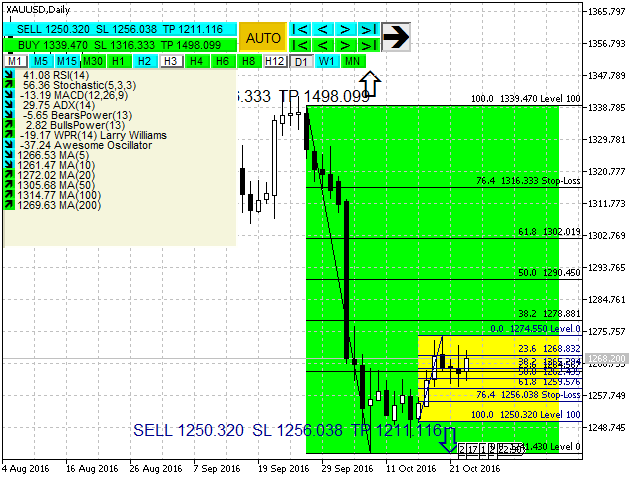
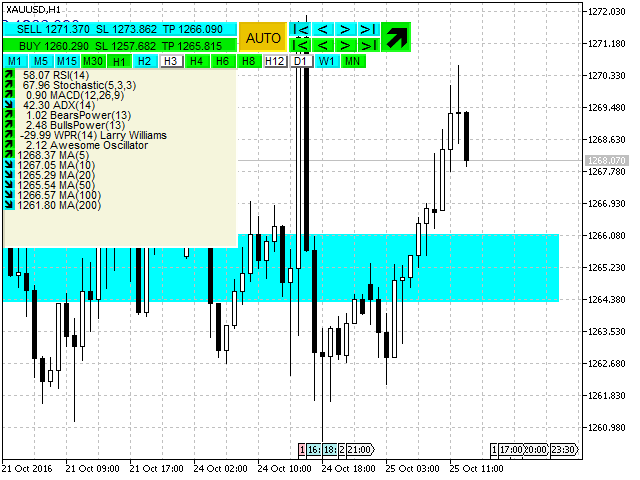
The indicator automatically plots and tracks buy and sell Fibo levels at any symbol and timeframe.
FiboPlusTrend displays:
- the trend on all timeframes and indicators values.
- Fibo levels of the probable upward or downward price movements.
- entry points are shown using "up arrow", "down arrow" icons. The data is doubled on SELL and BUY buttons.
- rectangle area limited by levels 0-100. Trading is performed from one level to another (no trend).
Features
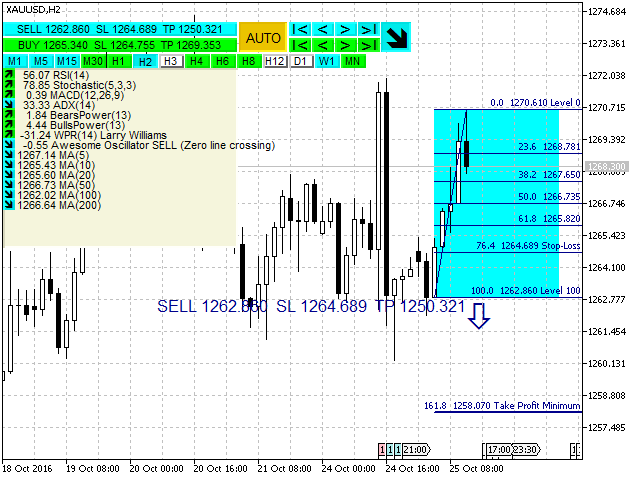
- calculation of the trend of indicators (RSI, Stochastic, MACD, ADX, BearsPower, BullsPower, WPR, AO, MA - 5, 10, 20, 50, 100, 200).
- price movement forecast, market entry points, stop loss and take profit for orders.
- ready-made trading system.
- control buttons allow you to select one of the Fibo options.
- hide buy/sell option.
- watch other timeframes.
- "+" and "-" buttons scale the chart up and down re-calculating the levels automatically.
- any Fibonacci levels.
- any color scheme.
- ability to move the buttons to any part of a chart.
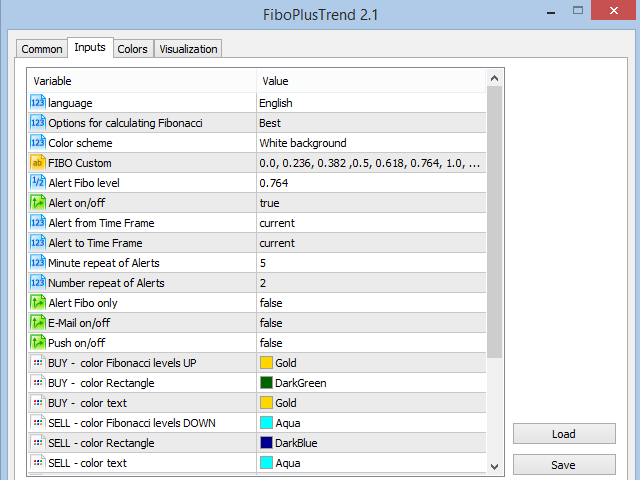
Parameters
- Language (Russian, English, Deutsch, Espanol, Portugues)
- Fibo level options:
- Best - use same-color candles till the candle of an opposite color appears,
- Standard - standard application,
- debt of flow - dept flow of the Market Maker, obtained during the activation of strong market distortions
- Color scheme (preset colors):
- White background - for white background.
- Black background - for black background.
- Custom background - custom settings of all colors.
- FIBO Custom (level values separated by «,»)
- customcolors: custom color settings
- coordinatesX, Y buttons to snap pixels (Х, Y coordinates to anchor the buttons to a chart)
Buttons
- SELL. Sell market entry option. Clicking SELL shows/hides sell Fibo levels.
- |< First sell market entry option.
- < Previous sell market entry option.
- > Next sell market entry option.
- >| Last sell market entry option + auto tracking.
- BUY. Buy market entry option. Clicking BUY shows/hides buy Fibo levels
- |< First buy market entry option.
- < Previous buy market entry option.
- > Next buy market entry option.
- >| Last buy market entry option + auto tracking.
- AUTO. Auto calculation and market tracking of the new buy and sell Fibo levels.
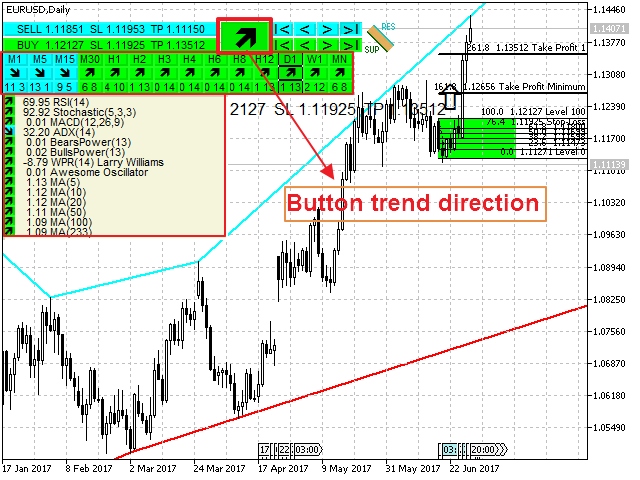
- The image of the current trend. Pressing hides / shows the trend on all timeframes
- M1, M5, M15, M30, H1, H2, H3, H4, H6, H8, H12, D1, W1, MN. Buttons values desired timeframe indicators.
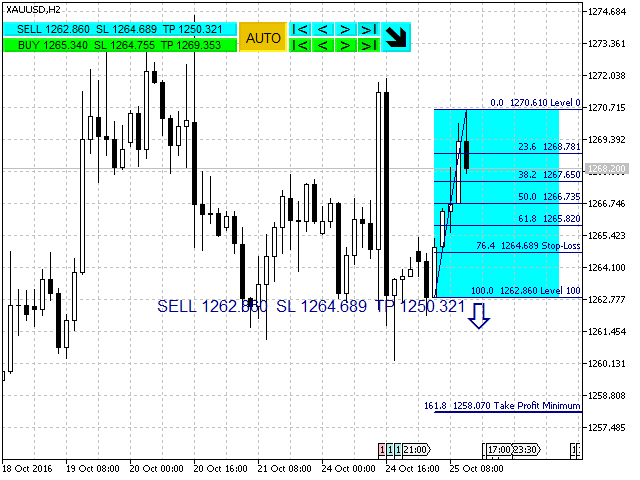
FiboPlusTrend -based trading system
- Sell. Candle closes below level 100, stop loss exceeds 76.4, take profit minimum 161.8, take profit 1 - 261.8, take profit 2 - 423.6.
- Buy. Candle closes above level 100, stop loss is below level 76.4, take profit minimum 161.8, take profit 1 - 261.8, take profit 2 - 423.6.
- Buy/sell in a rectangle area limited by level 0-100. Trading is performed from one level to another (no trend).
- The "debt of flow" option. FiboPlusTrend
plots the "debt of flow" levels of the Market Maker, the price has a high probability to return to these levels.
Trading from the level 100 to take profit 1 - 50, take profit 2 - 33. The second option is to place limit orders at the levels of 50% and 33% following the trend.
I recommend that you update the data before applying the indicator to the current chart (by subsequently clicking M1, M5, M15, M30, H1, H2, H3, H4, H6, H8, H12, D1, W1 and MN periods).


Hi,
I am still new to trading so I would be grateful if you could tell me how I should decide whether to take the Buy or Sell trade...because both are coming up on the chart with their own SL and TP levels...thanks...Samit