Tick Chart Pro
- Indicateurs
-
Elvis Wangai Muriithi
 QUANTMT5 combines quantitative approach and quantum probability models to create intelligent MT4 & MT5 trading systems.
 - Version: 1.0
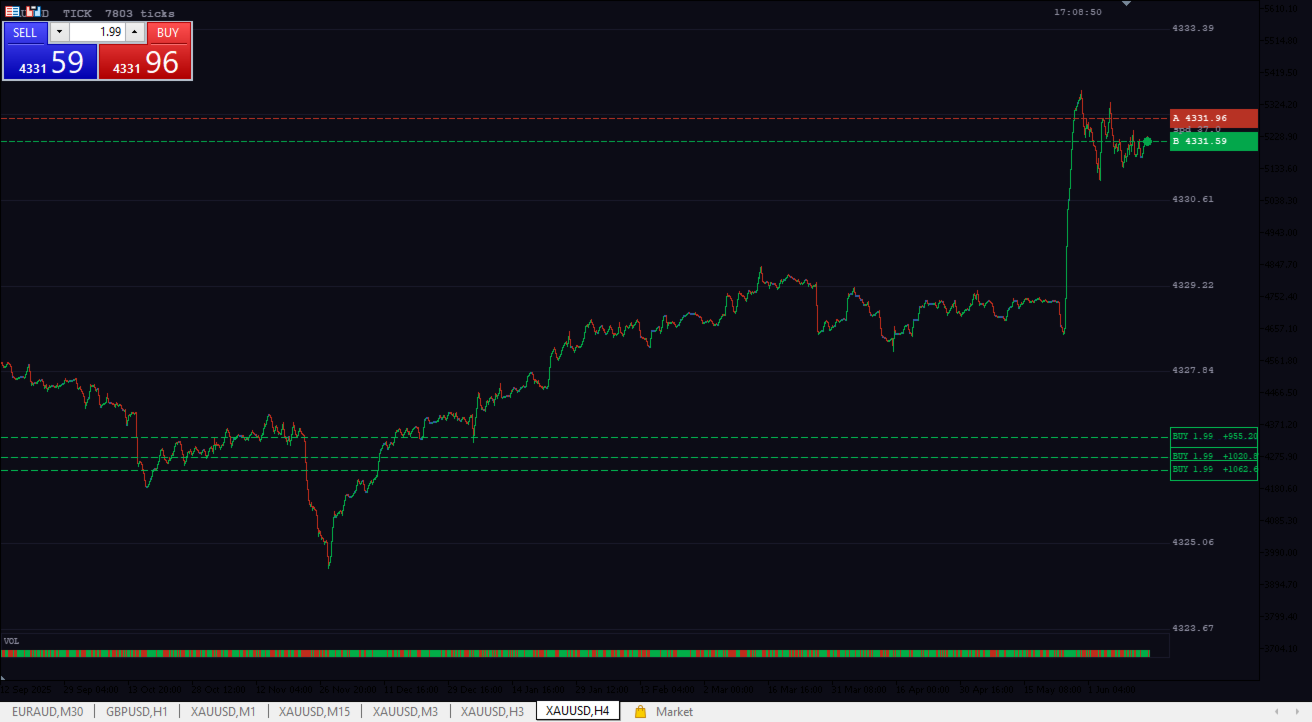
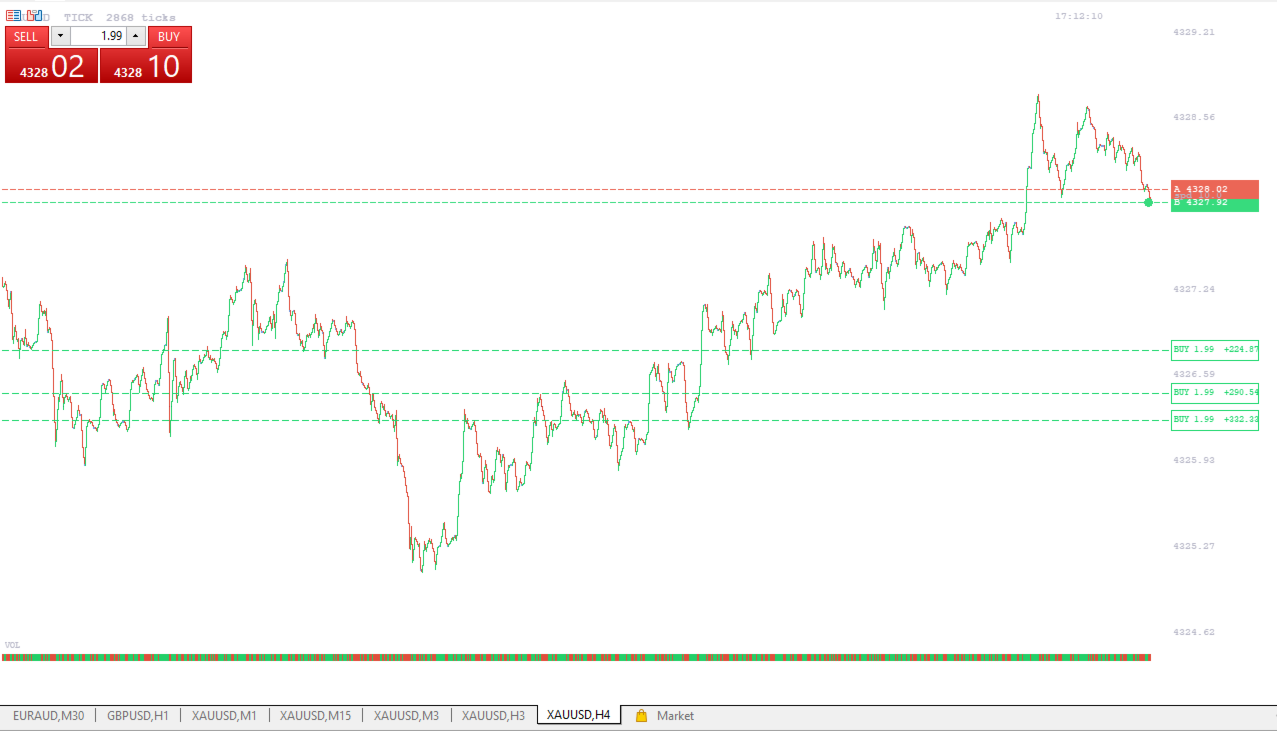
TickChart transforms your MetaTrader 5 chart into a full-screen tick-by-tick price visualization, giving you the same live tick chart found in the MT5 "New Order" panel — but expanded across your entire chart window with no size limitations.
Who Is This For
- Scalpers who need to see micro price structure that candlesticks hide between bar closes
- News traders who need to watch the exact moment price reacts to a release tick by tick
- Manual traders who place orders directly on the chart and need to see their entry, TP, and SL levels clearly while monitoring live price flow
- Order flow readers who watch tick velocity and momentum direction as a leading signal before a candle even closes
Key Features
Smooth scrolling tick line — newest tick always anchored at the right, older ticks scroll left continuously. Color-coded green on uptick, red on downtick so direction is instantly readable.
Live Bid/Ask overlay — dashed bid and ask lines update on every tick with labeled price pills on the right margin. Spread displayed between them in real time.
Position and order levels — open positions and pending orders are drawn directly onto the canvas so nothing is hidden. Entry price shows direction, lot size, and live floating P&L. TP and SL lines update as soon as they are modified.
Tick volume strip — a compact volume bar at the bottom of the chart shows tick activity intensity, color-matched to the direction of each tick.
Price grid — clean horizontal grid lines with price labels scaled automatically to the visible range.
Right shift — configurable empty space on the right side of the chart, identical to MT5's native chart shift, giving you room to read price action without the line pressing against the edge.
Auto-resize — the canvas redraws instantly when you resize, maximize, or switch chart layouts.


L'utilisateur n'a laissé aucun commentaire sur la note