QM Scanner Pro
- Indicateurs
- Version: 1.10
- Activations: 5

╔══════════════════════════════════════════════════════════════╗
║ QUASIMODO PATTERN SCANNER - Professional Edition ║
║ Automatic Detection of High-Probability Setups ║
╚══════════════════════════════════════════════════════════════╝
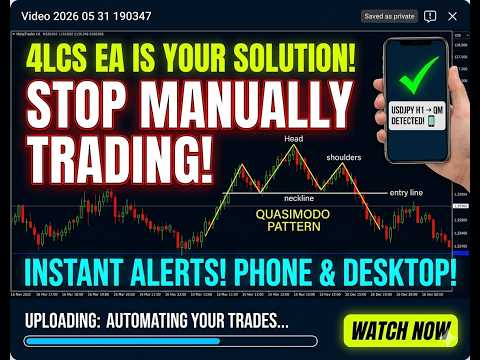
🎯 WHAT IS THE QUASIMODO (QM) PATTERN?
───────────────────────────────────────────────────────────────
The Quasimodo Pattern is one of the most reliable and powerful
reversal patterns in technical analysis. Used by professional
traders and institutional algorithms worldwide, it identifies
high-probability turning points in the market before the
majority of retail traders notice them.
Unlike traditional patterns that require subjective interpretation,
the QM pattern is based on strict structural rules that make it
objective, repeatable, and highly accurate.
Why is it so powerful?
• It reveals the footprint of institutional order flow
• It identifies liquidity grabs and stop hunts
• It provides precise Entry, Stop Loss, and Take Profit levels
• It works on ALL markets: Forex, Crypto, Indices, Commodities
• It works on ALL timeframes (best on H1 and above)
WHAT DOES THIS INDICATOR DO FOR YOU?
───────────────────────────────────────────────────────────────
This is NOT just another indicator that paints pretty lines.
This is a PROFESSIONAL ASSISTANT that automatically scans your
chart, detects valid Quasimodo patterns, and displays the 4 key
structural levels that institutional traders use to enter the
market.
Think of it as having an expert analyst working 24/7, watching
every candle, and highlighting only the highest-quality setups.
📊 THE 4 KEY LEVELS (SUPPORT & RESISTANCE ZONES)
───────────────────────────────────────────────────────────────
When a valid QM pattern is detected, the indicator instantly
draws 4 dynamic support/resistance zones:
┌─ Level 1 (Box 3): ENTRY ZONE ─────────────────────────────┐
│ The left shoulder level. This is where smart money │
│ waits to enter. The most high-probability entry zone. │
└────────────────────────────────────────────────────────────┘
┌─ Level 2 (Box 1): STOP LOSS ZONE ────────────────────────┐
│ The head level. If price breaks this level, the setup │
│ is invalidated. Your protective stop goes here. │
└────────────────────────────────────────────────────────────┘
┌─ Level 3 (Box 2): TAKE PROFIT ZONE ──────────────────────┐
│ The neckline level. This is where the pattern targets. │
│ High probability of price reaching this zone. │
└────────────────────────────────────────────────────────────┘
─ Level 4 (Box 0): IDENTIFICATION LEVEL ──────────────────┐
│ The right shoulder peak. Used to confirm pattern │
│ validity and structural integrity. │
└────────────────────────────────────────────────────────────┘
⚡ KEY ADVANTAGE: These levels are NOT static. They are
continuously updated as new patterns form, ensuring you always
have the most current and relevant support/resistance zones.
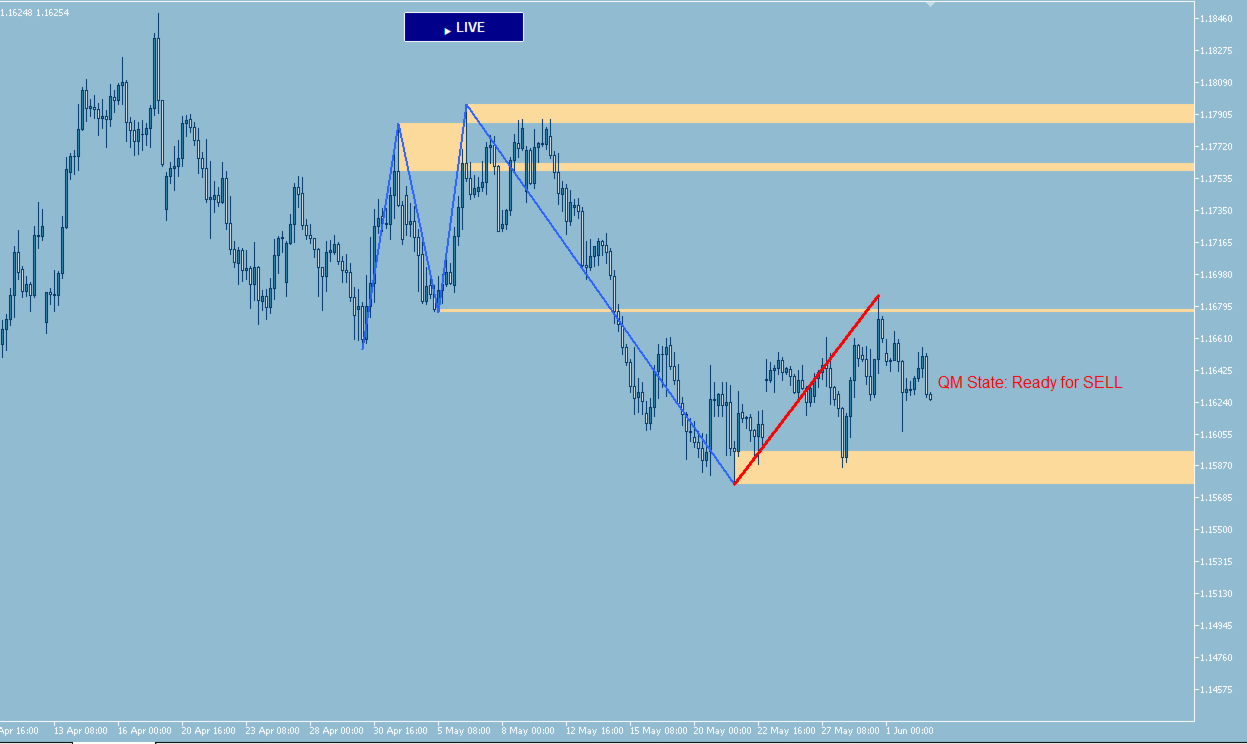
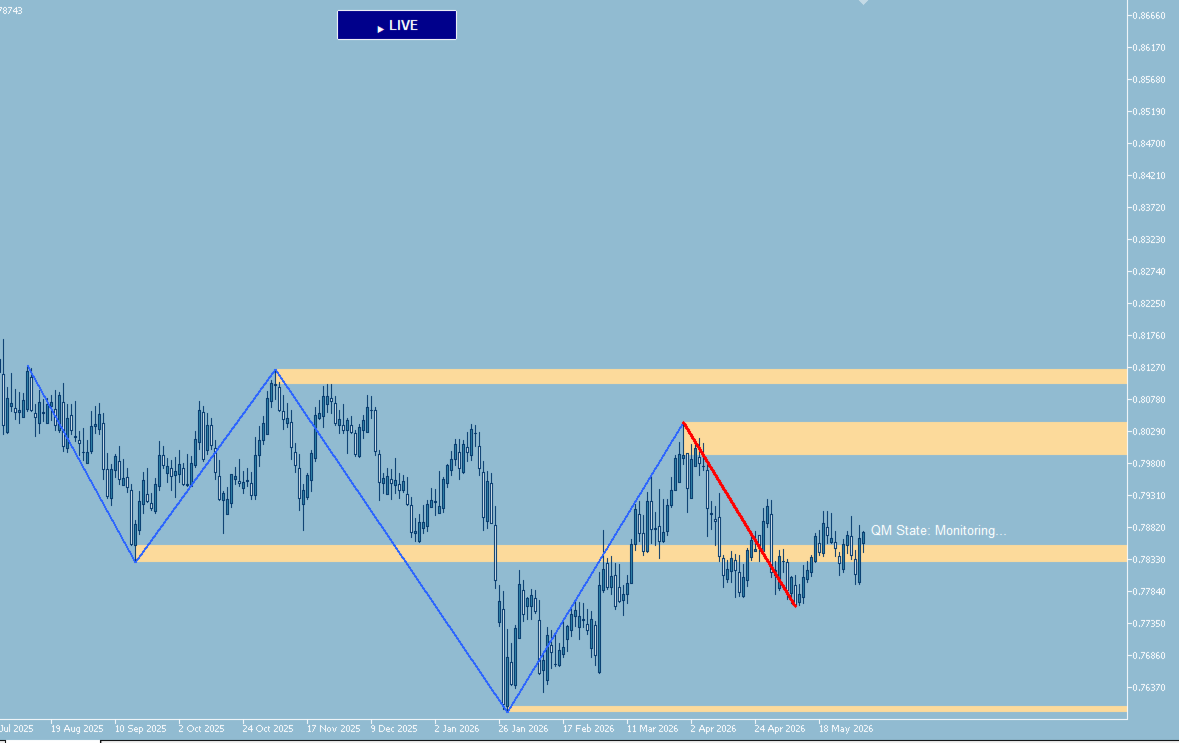
VISUAL FEATURES
───────────────────────────────────────────────────────────────
• 4 color-coded rectangular zones for instant recognition
• Blue zigzag lines connecting the 5 structural points
• Red line highlighting the active right shoulder wave
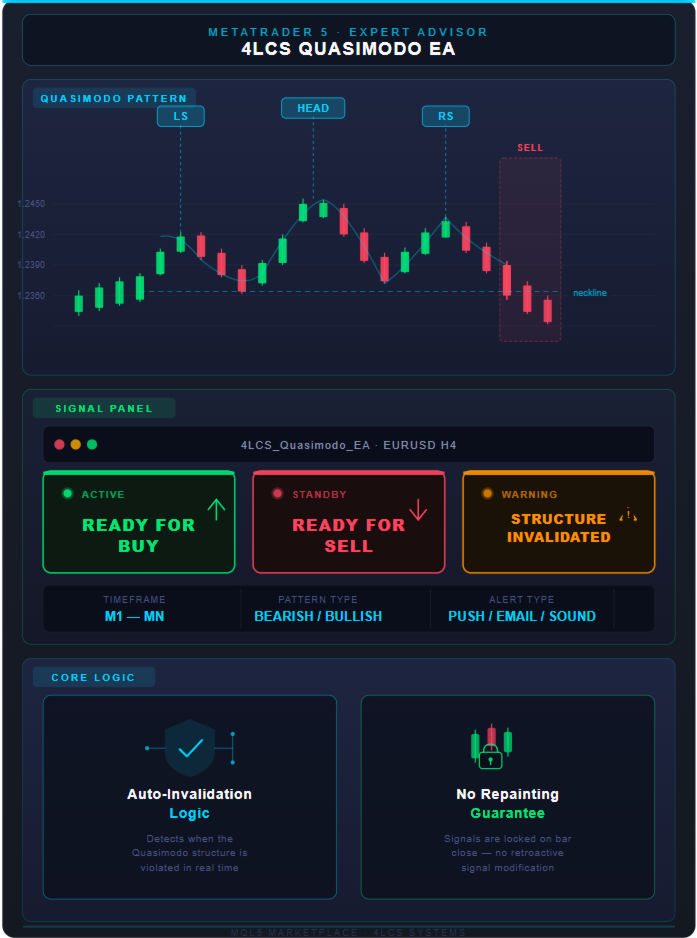
• Clear status label: "Ready for BUY" or "Ready for SELL"
• Clean, non-cluttered display that won't overwhelm your chart
🔔 SMART ALERT SYSTEM
───────────────────────────────────────────────────────────────
• Instant popup alerts when a new valid pattern forms
• Push notifications directly to your mobile device
• One alert per pattern - no spam, no noise
• Works across all timeframes and symbols
🧊 FREEZE MODE (Unique Feature!)
───────────────────────────────────────────────────────────────
Professional traders analyze multiple timeframes. But when you
switch timeframes, indicators usually reset and lose their
analysis.
Our unique Freeze Mode solves this completely:
✅ Toggle freeze ON to lock the current analysis
✅ Switch to any timeframe - analysis stays visible
✅ Compare setups across timeframes with ease
✅ Toggle freeze OFF to resume live scanning
✅ Persistent state - survives terminal restarts
This is a game-changer for multi-timeframe analysis!
CUSTOMIZATION
───────────────────────────────────────────────────────────────
• Choose between MACRO and MICRO wave detection modes
• Customize all colors to match your chart theme
• Enable/disable alerts independently
• Debug mode for advanced users
📌 IMPORTANT: THIS IS YOUR ANALYTICAL ASSISTANT
───────────────────────────────────────────────────────────────
This indicator is designed to SUPPORT your trading decisions,
not replace them. It identifies patterns and marks key levels.
You remain in full control of your trading decisions.
🚀 COMING SOON: QM Expert Advisor
───────────────────────────────────────────────────────────────
We are developing an Expert Advisor that will automatically
place trades based on the patterns detected by this indicator.
Stay tuned for the EA release - it will work seamlessly with
this indicator for fully automated QM pattern trading.
FREQUENTLY ASKED QUESTIONS
───────────────────────────────────────────────────────────────
Q: Which timeframe works best?
A: H1 and H4 provide the most reliable signals. M15 and M30
work for intraday. Avoid M1 and M5 due to excessive noise.
Q: Can I use it on multiple charts simultaneously?
A: Yes! Attach separate instances to different charts.
Each instance works independently.
Q: How do I enable mobile notifications?
A: In MT5: Tools → Options → Notifications. Enter your
MetaQuotes ID and test the connection.
Q: What's the difference between MACRO and MICRO mode?
A: MACRO uses MACD SignalLine (smoother, fewer but higher
quality signals). MICRO uses MACD Line (more sensitive,
more signals but may include noise).
Q: Can I customize the colors?
A: Yes! All colors are fully customizable in the input
parameters to match your personal chart theme.
Q: Does it repaint or lag?
A: No. The indicator only confirms patterns on candle close.
Once drawn, levels remain stable and don't repaint.
⚠️ DISCLAIMER
───────────────────────────────────────────────────────────────
TRADING INVOLVES SIGNIFICANT RISK OF LOSS.
This indicator is an ANALYTICAL TOOL designed to assist in
pattern recognition. It does NOT guarantee profits and should
NOT be used as the sole basis for trading decisions.
• Past performance does not guarantee future results
• Always use proper risk management
• Test thoroughly in demo before live trading
• The developer is NOT RESPONSIBLE for any trading losses
• Trading foreign exchange and other instruments carries a
high level of risk and may not be suitable for all investors
Use this tool to ENHANCE your analysis, not replace your
judgment.
───────────────────────────────────────────────────────────────
© 2026 Quasimodo Pattern Scanner. All rights reserved.
Developed by MOHSEN SHABAN