
Advanced Seconds Chart MT5
- Utilitaires
-
Andrew Mcculloch
 I build real tools that can help you with your trading. If you want AI characters selling you a dream, I cannot help you.
Message me if there is indicators/features you want added to current indicators or have an idea for an indicator to be developed. - Version: 2.31
- Mise à jour: 20 août 2026
- Activations: 10
See What Others Cannot
MT5 stops at the 1-minute chart. Advanced Seconds Chart MT5 goes below it, building real sub-minute OHLC candlesticks directly inside MT5 with full access to every indicator and drawing tool you already use.
No plugins. No external feeds. Attach it to a chart and go.
This product is now free. Download it, use it, and message me if anything does not work as described. I respond to every message and fix genuine issues.
What It Does
The EA captures your broker's live tick stream and aggregates it into sub-minute candles via a custom symbol. Every MT5 feature works natively, so you can attach indicators, oscillators and drawing tools exactly as you would on any other chart.
You choose the resolution. Need 25-second candles? Set it. 45-second candles? Set it. Any duration from 1 to 59 seconds.
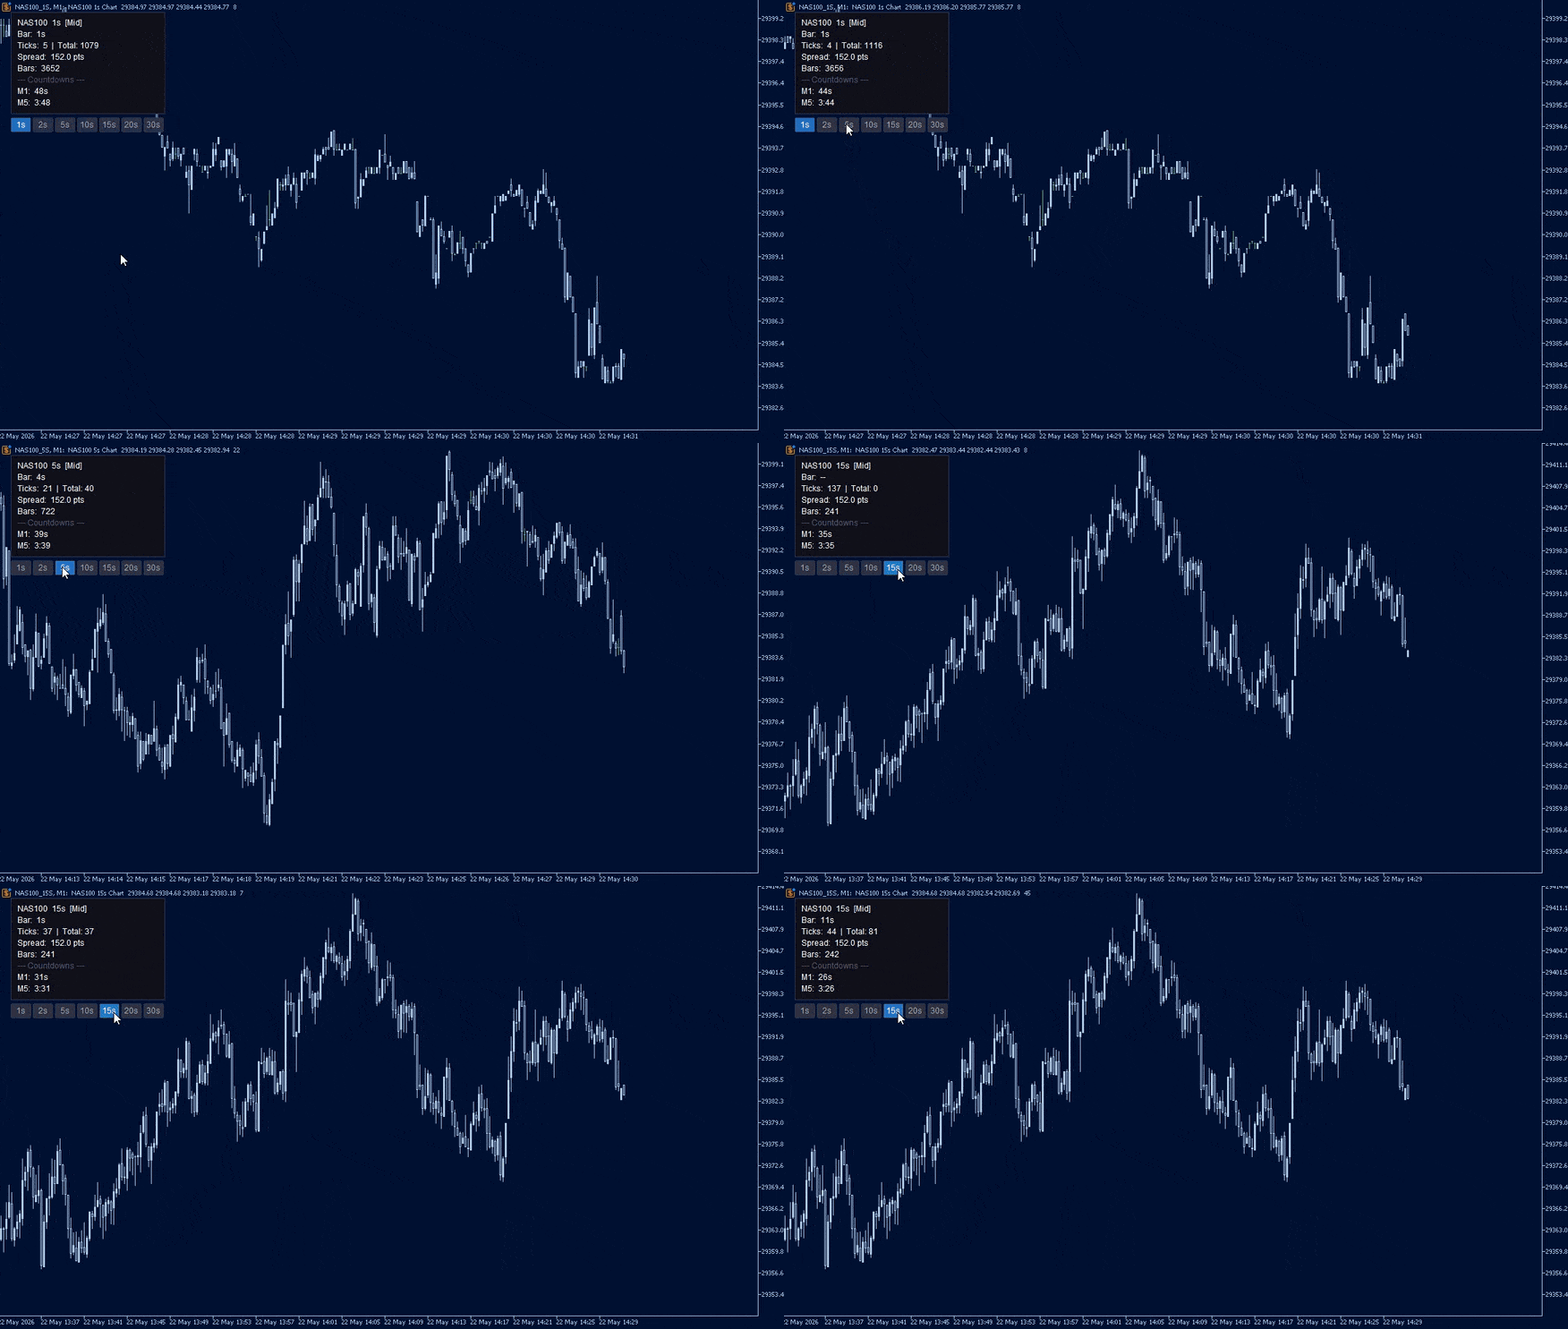
One-click duration switching. Seven on-chart buttons (1s, 2s, 5s, 10s, 15s, 20s, 30s). Click one and the chart rebuilds in under a second. No restarts, no dialogs.
Price source selection. Bid, Ask, Mid or Last. Mid averages bid and ask per tick, producing cleaner candles on pairs with variable spreads.
Spread filter. Set a maximum spread in points. Ticks arriving during blown-out spreads are discarded, keeping candles clean through news and rollover.
Instant backfill. Loads up to an hour of candles from stored tick history the moment the EA starts, so there is no waiting for bars to accumulate.
Persistent chart. The seconds chart survives a terminal restart with your template, indicators, window size and position intact. On reload the EA reattaches to the existing chart rather than opening a duplicate.
On-screen diagnostics. If bars are not being built, the EA tells you why on the chart itself rather than leaving you with an empty window.
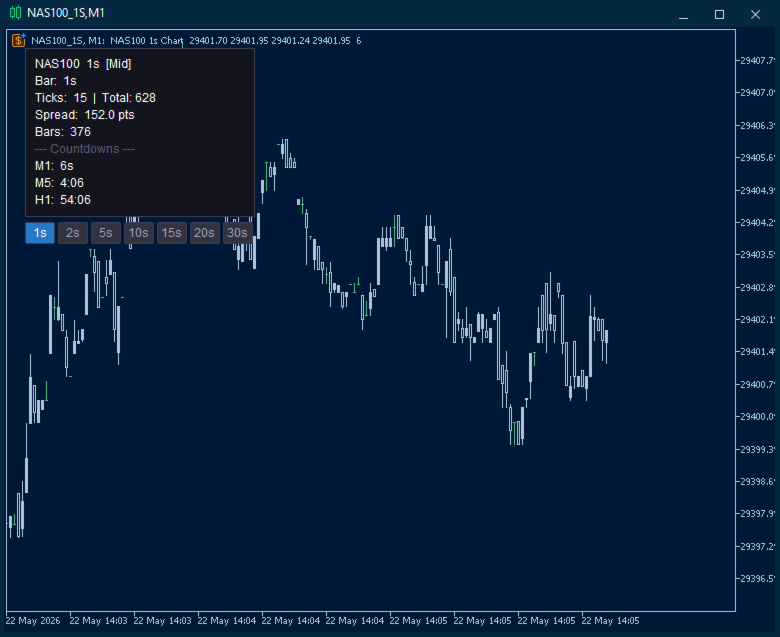
Live Info Panel
A compact, repositionable dashboard updated every second:
- Status — colour-coded indicator showing whether bars are building normally
- Bar countdown — seconds until the current candle closes
- Tick count — activity on the current bar plus session total
- Live spread — current spread in points
- Multi-timeframe countdowns — up to three slots (for example M1, M5, H1) counting down simultaneously
Panel corner, margin, colours, font size and opacity are all configurable.
If Something Does Not Look Right
Version 2.31 added active fault detection. If no candles appear, a warning is drawn on the chart naming the cause and the fix. The conditions it detects:
- The selected price source returns no price on this symbol (common when Last is selected on a forex pair — switch to Bid or Mid)
- Every tick is being rejected by the spread filter (raise the limit or set it to 0)
- No ticks are arriving from the broker (market closed, or the symbol is not receiving data)
- No tick history was available to backfill (candles will still build from live ticks)
- The seconds chart could not be opened
Faults are also flagged on the parent chart, so a problem is visible even if the seconds chart never appeared. If you hit something the warning does not cover, send me a screenshot of the info panel and I will look into it.
Configuration
Bar settings
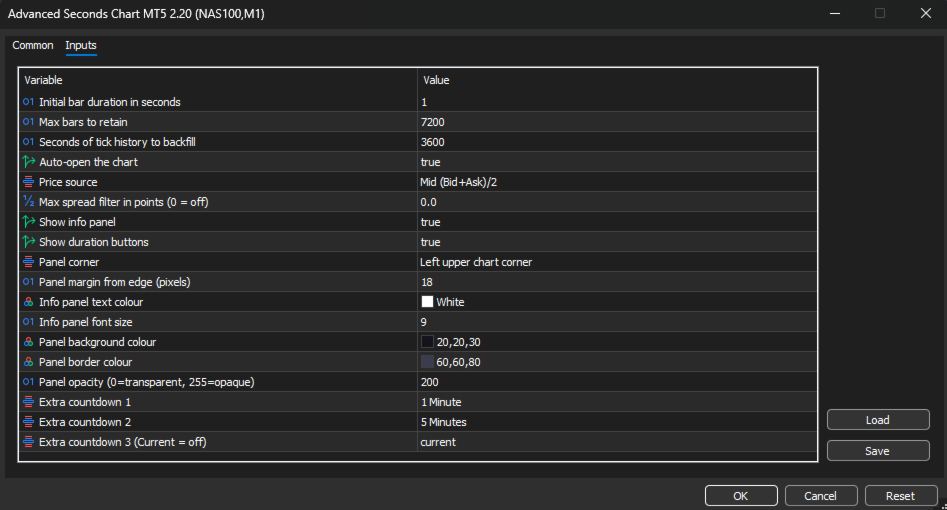
Initial bar duration (default 1s) — Starting candle duration. Changeable at any time with the on-chart buttons, without restarting.
Max bars to retain (default 7,200) — Rolling buffer size. Once the limit is reached the oldest bar is dropped as each new one is added. At 1-second resolution 7,200 bars is 2 hours of history; at 30 seconds it is 60 hours.
Backfill seconds (default 3600) — How many seconds of tick history to read on startup. Increase it if your broker stores deep tick history and you want more bars available immediately. 300 is five minutes, 3600 is one hour.
Auto-open chart (default true) — Opens the custom symbol chart automatically on launch. Disable to open it manually from Market Watch.
Price and filtering
Price source (default Mid) — Which price from each tick builds the candles. Bid and Ask use the raw quote. Mid averages the two, smoothing spread-induced noise. Last uses the trade price, relevant for futures and equities.
Max spread filter (default 0, off) — Maximum allowable spread in points. Any tick exceeding it is discarded. Useful during news, rollover and low-liquidity sessions. Set to 0 to disable.
Chart persistence
Keep seconds chart open when terminal closes (default true) — Leaves the chart open on shutdown so MT5 saves it into your profile with its template, indicators, size and position.
Reuse an existing seconds chart (default true) — On reload, reattaches to the chart already open instead of creating a second one.
Diagnostics
Show on-screen warnings (default true) — Draws the fault warning on the chart when no bars are being built.
Seconds without a tick before warning (default 120) — How long the feed can be silent before the no-market-data warning appears.
Info panel display
Show info panel (default true) — Toggles the entire dashboard.
Show duration buttons (default true) — Toggles the button row. Can be shown independently of the info panel.
Panel corner (default Left Upper) — Which corner the panel and buttons anchor to. All four are supported, and the panel repositions automatically on chart resize.
Panel margin (default 18px) — Distance in pixels between the panel edge and the chart corner.
Text colour, font size, background colour, border colour, opacity — Full visual control to match your chart theme.
Multi-timeframe countdowns
Extra countdown 1 (default M1) — Live countdown to the next candle close on the selected timeframe.
Extra countdown 2 (default M5) — Second slot.
Extra countdown 3 (default off) — Third slot. Set any slot to Current to disable it.
Setup
- Attach the EA to any chart you want sub-minute candles for.
- Adjust the inputs or accept the defaults.
- Click OK. The seconds chart opens automatically.
The first time it opens, the seconds chart uses your Default template. Set the seconds chart up the way you want it — colours, indicators, window position — and it will come back that way on every restart from then on.
Do not save a template with this EA attached and set it as your Default template, as every new chart would then load the EA and open further charts. Version 2.31 blocks this from running away, but it is still worth avoiding.
Use Cases
Scalping. See entries and exits at the resolution they actually happen. A 1-minute candle hides dozens of micro-structures that matter when holding time is measured in seconds.
News trading. Watch the initial spike, the pullback and the continuation unfold bar by bar in the seconds after a release, rather than waiting for a single 1 minute candle to close.
Execution analysis. Compare your fill times and prices against the actual 1-second price action to understand slippage and timing.
Learning price action. Studying how candles form at the 1-second level builds intuition for structure and momentum that carries directly to higher timeframes.












































L'utilisateur n'a laissé aucun commentaire sur la note