Prime ACE Strategy

Prime ACE Strategy

Trend-Following Indicator for MT4
Discretionary Trading Support Tool


Prime ACE Strategy is sold on MQL5 Market, but it runs on MetaTrader 4 only.
It does not run on MetaTrader 5.


Prime ACE Strategy is an MT4 trading tool built around the indicator itself.

It is not a product for blind arrow-following.

It is also not a fully automated system designed to run unattended.

Prime ACE is built around a real trading workflow:

identify candidates

assess edge

narrow them down with discretion

reduce the burden of trade placement and post-entry management

In short, Prime ACE is designed for traders who want more structure, clearer judgment, and steadier handling, while keeping the final decision in human hands.

A short product video is available in the Screenshots section.


What Prime ACE Is

Prime ACE is a discretionary support indicator built on classic trend-following principles.

Its basic flow is simple:

It displays non-repainting signal candidates based on confirmed bars.

The on-chart panel helps you judge whether the current settings and the current market condition offer usable edge.

You decide whether to take or skip the candidate.

After entry, the bonus companion EA helps keep management and exits more consistent.

In short:

identify candidates → assess edge → filter with discretion → support management after entry

That is the basic workflow of Prime ACE.


Three Core Design Principles

1. Non-Repaint Signals Based on Confirmed Bars

Prime ACE arrows are based on confirmed candles.
They are not designed to rewrite historical signals afterward to improve appearance.

2. It Uses Discretion Rather Than Taking It Away

Prime ACE is not built to remove human judgment from trading.
Its purpose is to provide a structure that makes market judgment easier to apply in a more organized way.

3. Focused on Classic Trend-Following

It is not designed to chase every move in every condition.
The focus is on cleaner trend-following situations where continuation is easier to trade.


What Discretion Means in Prime ACE

In Prime ACE, discretion means judging not whether an arrow appeared, but whether that arrow is worth taking.

To keep this section focused, set the panel aside for a moment and look only at the discretionary side of the decision.

Situations where you may want to skip a signal

the signal goes against the higher-timeframe trend

price is too far from the moving average and likely to become a late entry

the signal appears right in front of an important support or resistance level, leaving limited room to move

the structure looks damaged and no longer resembles a clean trend-following setup

the market lacks directional clarity and looks choppy or range-bound

the arrow is there, but you simply feel that this is not the place you want to enter

Situations where you may be more willing to take a signal

the directional flow is clean and the price action is not forced

there is still room to run

the setup looks like a clean pullback or retracement

the quality is clearly better than recent signals on the same chart

the structure is aligned well enough for you to say, “This is a setup I want to take”

So discretion in Prime ACE does not mean obeying arrows.
It means keeping only the candidates that are worth taking now.

Prime ACE is built to make that filtering process clearer.


The Role of the Indicator Panel
And Why Parameter Adjustment Matters

A major strength of Prime ACE is the ability to move back and forth between the panel and the parameters.

The point is not to keep one fixed setting and ask whether the product works.
The intended workflow is:

change the settings

observe how the arrows change

observe how the panel responds

search for the conditions that appear to offer usable edge in the current market

That is why Prime ACE should not be viewed as a simple signal display tool.
It also functions as a testing and verification framework for finding the conditions that suit your own style and preferred battlefield.


Image 01 | Thumbnail

Trend-Following Indicator for MT4
Prime ACE Strategy
Discretionary Trading Support Tool


Image 02 | Buy Example

This image shows one example of how Prime ACE presents buy-side candidates during an advancing market.

The key point is not to take every buy arrow.
The real task is to judge which candidates are more tradable within the broader bullish flow.

Prime ACE makes those candidates visible.


Image 03 | Sell Example

This is a sell-side example.

Prime ACE is not built around buy-only logic.
The same framework can be applied to short-side opportunities when market structure supports them.

Here as well, the arrows are not commands.
They are candidates for consideration.


Image 04 | Both Buy and Sell Scenarios

Prime ACE is not restricted to one side of the market.

Within the same logic framework, it can be used for both long and short opportunities, depending on market structure and direction.


Image 05 | Indicator Panel

This image shows the core panel of Prime ACE.

This is exactly why Prime ACE should not be viewed as a mere arrow tool.
The panel helps you compare whether the current settings, the current market, and the current chart structure appear to offer usable edge.

That is what makes the following workflow possible:

review the arrows

adjust the parameters

watch how the panel changes

search for your own preferred trading environment


Overall Logic Structure and Parameter Adjustment

Prime ACE becomes easier to understand when viewed in three blocks.

1. Entry Block

This determines how trade candidates are generated.
It affects the character of the trigger and the way signals appear.

2. Filter Block

This reduces unnecessary entries and helps avoid unfavorable conditions.
The filtering logic belongs here.

3. Exit Block

This governs what happens after entry.
ATR-based TP/SL, break-even handling, and trailing functions all belong to this block.

One of the strengths of Prime ACE is that you can adjust the behavior of these entry, filter, and exit blocks through the parameters, and then quickly review the result through the panel.

That is why the parameters are not decoration.
They are trading tools that materially change:

how candidates are generated

how conditions are filtered

how trades are handled after entry

For example:

Trigger-related settings

how early candidates appear

how selective the logic becomes

which types of entry behavior are allowed

Filter-related settings

which conditions should be skipped

which conditions should reduce the number of candidates

how noisy conditions should be avoided

Exit-related settings

the width of TP / SL

when break-even should activate

how trailing should be handled

In Prime ACE, changing values means changing how the logic behaves.

And the important point is not simply to change the numbers and stop there.
The intended use is:

adjust

observe the arrows

observe the panel

search for the conditions that appear to offer usable edge in the current market

That is why Prime ACE is not just a signal tool.
It is also a testing and verification framework for finding the conditions that are easier for you to trade.


Image 06 | Parameters 01

This image shows the first half of the parameter structure.

The settings here are especially tied to entry behavior and filtering logic.
They are not cosmetic options.
They are part of the logic design itself.

Starting from the default settings is perfectly fine.
From there, adjustment can bring the tool closer to your own market view and preferred battlefield.


Image 07 | Parameters 02

This image shows the second half of the parameter structure.

The settings here are tied more closely to exits and operational consistency, including how positions are handled after entry.

Together, these settings form part of the overall design of Prime ACE.


Image 08 | EURUSD M15

An example of management and exit support using the EA buttons

The point of this image is not EURUSD itself.
It is the trading workflow supported by the EA buttons.

The flow is:

review conditions with the indicator and panel

decide whether the candidate is worth taking

once you decide to take it, place the trade with the EA buttons

support the position afterward with greater consistency

In short:

judgment by the trader, reduced management burden through the EA


Image 09 | BTCUSD M15

Another example of management and exit support using the EA buttons

This image is included for the same reason.
It is not here to emphasize BTCUSD itself, but to show that the EA is part of a real trading workflow rather than an abstract add-on.

The benefits highlighted here are:

support for placing the trade after the decision is made

less hesitation after committing to the trade

more consistent post-entry management

That is the intended role of the bonus companion EA in Prime ACE.


About the Bonus Companion EA

The bonus companion EA is included for full purchase customers.

The public setup guide is available on the blog so both full purchase customers and rental users can start from day one. The bonus companion EA, templates, bonus presets, and the detailed manual are provided later via MQL5 Private Message.

Its role is not to replace judgment.
It is not presented as a fully automated profit machine.

Its role is to:

help place the trade you decided to take through discretion

reduce the burden of TP / SL / break-even / trailing management

reduce inconsistency in post-entry handling

A practical use flow is:

use the indicator and panel to find conditions worth trading

decide with discretion whether to take or skip the candidate

once you choose to take it, use the bonus companion EA to support management and exits

That semi-automatic balance is one of the defining strengths of Prime ACE.


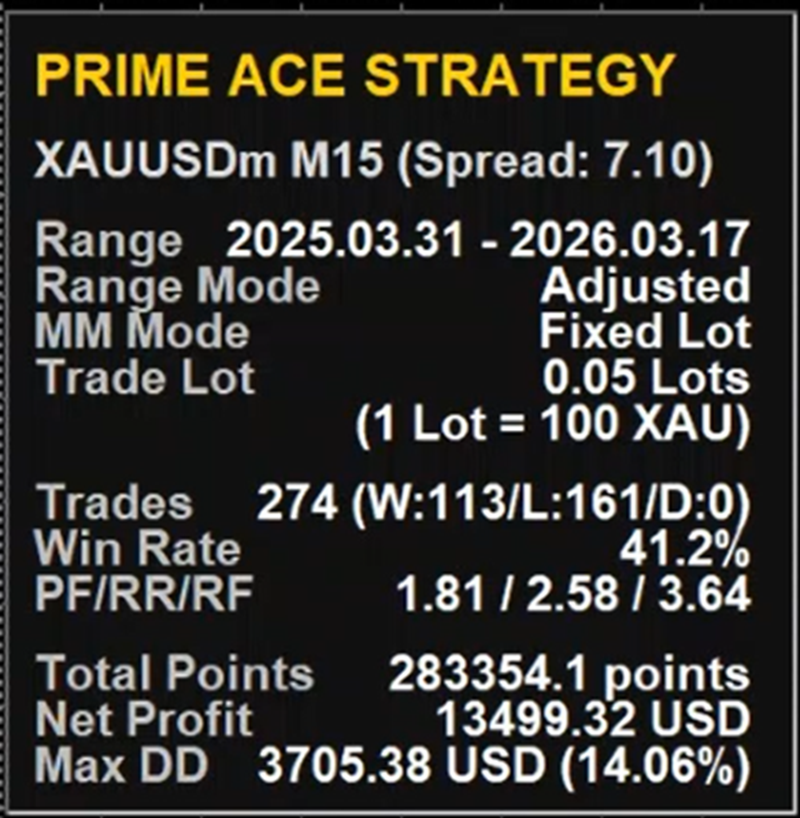
Image 10 | Backtest Result (Reference)

This backtest result image with the bonus preset is provided as reference material.

However, it is not the center of the product.

Prime ACE is not meant to be viewed as a product defined only by backtest figures.
Its real value lies in the decision-support framework built around:

non-repainting candidate signals

condition checking through the panel

exploration of tradable conditions through parameter adjustment

support for post-entry handling through the bonus companion EA


Who Prime ACE May Suit

Prime ACE may suit traders who:

are tired of repaint-style signal tools

do not believe in “switch off your brain and win” type promises

want to approach discretionary trend-following in a more structured way

want steadier post-entry management and exits

want to compare market conditions and find their own preferred trading environment

Prime ACE is not a one-click fantasy product.
Instead, it is a trading tool designed to sharpen judgment, stabilize management, and bring more consistency to discretionary trend-following.


Package Information

Full Purchase

·       Prime ACE Strategy indicator for MT4

·       Bonus companion EA

·       Templates

·       Bonus Presets

·       Setup guide (blog)

·       Detailed manual (provided later via MQL5 Private Message)

Full purchase customers receive the bonus companion EA, templates, bonus presets, and the detailed manual later via MQL5 Private Message. The setup guide is available on the blog.


Rental

·       Prime ACE Strategy indicator only

·       Setup guide (blog)

·       Detailed manual (provided later via MQL5 Private Message)

Support and delivery of the detailed manual, as well as bonus files for full purchase customers, are provided via MQL5 Private Message.


Final Note

Prime ACE Strategy is not built to eliminate judgment.

Better trading does not come from removing decision-making altogether.
It comes from making decisions clearer, handling steadier, and management more consistent.

Prime ACE was built for that purpose:
a trend-following indicator for MT4 designed for traders who want more structure, less noise, and steadier handling.

Produits recommandés
Boost binary option profesional
Sebastian Alejandro Merino Sepulveda
Binarias & Forex (+90% Ratio-Win Next Candle) Espere que el precio llegue a una buena zona (fuerte) sea soporte, resistencia, zona de oferta o demanda, fibonacci level key, cifra redonda. Haciendo lo anterior definitivamente habrá una reversión en el precio y obtendrá su ITM en primera vela dando una efectividad del 100% siguiendo la tendencia. Es muy importante estar atento a las noticias fundamentales en el mercado y estas no afecten tu trading. Sesiones comerciales: cualquiera (24 horas).
Algo Trading Indicaor  With this indicator , you’ll have zones and trends that hight probability the price will reverse from it. so will gives you all the help that you need  MT5 Version                    https://www.mql5.com/en/market/product/170028 MT4 Version                    https://www.mql5.com/en/market/product/88034 Why should you join us !?  1-This indicator is logical since it’s working in previous days movement , to predict the future movements. 2-Algo trading indicator will hel
EMA Dashboard
Chantal Sala
1 (1)
Ema Dashboard is an innovative dashboard that allows you to monitor Moving Average on multiples symbols and different timeframes. This dashboard allows you to analyze information on 28 pairs on an unique chart. Its functionality includes analysis of All Time Frames. This configuration allows you to identify the Long Term Trend with extreme ease. This panel allows you to take very important directional movements. A click on button opens a new chart (symbol and timeframe). Graphic Object Symbol l
What is the Super Ichi Indicator? Super Ichi is an advanced combination of Ichimoku Kinko Hyo and SuperTrend indicators. This powerful technical analysis tool is designed to identify market trends and generate trading signals. What Does It Do? Dual-Level Trend Analysis : Uses customized versions of Tenkan-sen and Kijun-sen lines Automatic Signal Generation : Displays visual markers (arrows) at crossover points Real-Time Alert System : Provides audio and visual alerts when new signals occur Dynam
FREE
Fibonacci Currency Strength Meter (FCSM) Early Access Sale!! This new product is still in the process of adding new features and settings. For early bird buyers. The Price will be 50% Sale. In a few weeks, the product will be done. Go Grab your copy while it's still cheap. More details will be added soon. Things to be added. Alert Levels Mobile and Email Alert From it's name, Fibonacci Currency Strength Meter is a combination of Fibonacci levels and Currency Strength Meter. The plot of Fibona
TDI Signals generates buy and sell arrows based on a TDI(Traders Dynamic Index) algorithm. It looks for price breakouts, continuations and reversals. By default it runs in the trend mode but user is provided with the option to change that to reversal mode. Trader can use the mode which compliments his/her trading style.  Usage:-   TDI Signals can be used as a stand alone indicator with context or even be added to strategies to make confirmations more strong. Volatility based stop loss, take pro
1.Determine the trend size based on the chart cycle.   An uptrend near the highest price in a period of time.   A trend down near the lowest price in a period of time. 2.   short-term trends.   Oversold and long;   Overbought, short. 3. Unwind positions based on overbought and oversold and profit points. real-time signal: https://www.mql5.com/zh/signals/1538661?source=Site+Signals+My EA Settings: You need to load EA into the currency pair to trade (M15 time range). The best performing symbol : E
Product Title: BID Wave Volume 1 - Smart Institutional Liquidity Tracker Short Description: Uncover institutional footprints! A powerful dual-timeframe volume indicator that detects real market turns by checking M1 volume order flow at current timeframe reversal zones. Full Description:  BID Wave Volume 2 is a revolutionary, advanced volume indicator designed for pro-scalpers and day traders. It bridges the gap between raw price action and institutional order flow. Unlike traditional indicators,
KFX Trade Manager
Joe Christopher Ramirez
Introducing the "KFX Trade Manager" expert advisor for MetaTrader 4 (MT4), a comprehensive solution for advanced trade management and risk control. This powerful tool is designed to enhance your trading experience by automating various aspects of order handling, profit optimization, and alert notifications. With the "KFX Trade Manager," you can take your trading to the next level and streamline your operations for improved efficiency and better risk management. Key Features: Trade Management Set
The indicator scans for TD Combo signals in multiple timeframes for the all markets filtered and shows the results on Dashboard. Key Features Dashboard can be used for all markets It can scan for signals on MN1, W1, D1, H4, H1, M30, M15 ,M5, M1 timeframes Parameters UseMarketWatch: Set true to copy all symbols available in market watch MarketWatchCount : Set the number of symbols that you want to copy from the market watch list. CustomSymbols: Enter the custom symbols that you want to be availa
PTW NON REPAINT TRADING SYSTEM + HISTOGRAM Non-Repainting ,   Non-Redrawing   and   Non-Lagging  Trading System. Does the following: - Gives Accurate Entry and Exit Points - Scalping, Day and Swing Trading  - 95% Accuracy  - Targets, where to take profits. - Shows Trends, Support and resistance levels - Works on All Brokers - Works on All Currencies, CFDs and Stocks - It does not place trades for you, it only shows you what trades to place. - It works on All Timeframes - It is for Trend or ran
BinaryMartini
Abdulkarim Karazon
un indicateur de trading binaire basé sur le croisement 3ma avec macd, il donne des signaux d'achat et de vente à l'ouverture de la barre et il ne repeint ni ne peint en arrière l'indicateur ne se concentre pas sur un taux de victoire élevé car il est conçu pour le trading de martingale, l'indicateur se concentre sur le nombre de signaux perdants le plus bas d'affilée. Stratégie : Le dépôt minimum est de 1 000 unités, nous commençons le trading avec 1 unité (la taille de la transaction est de 1
Indicateur Crypto_Forex « Histogramme de tendance » pour MT4, sans refonte. - L'indicateur Histogramme de tendance est beaucoup plus sensible et efficace que les moyennes mobiles croisées standard. - L'indicateur est disponible en deux couleurs : jaune (doré) pour une tendance baissière et vert pour une tendance haussière (les couleurs peuvent être modifiées dans les paramètres). - L'Histogramme de tendance intègre des alertes mobiles et PC. - Il est judicieux de combiner cet indicateur avec d'
At the core of the VidyaPearsonFlow Robot lies the synthesis of two key principles : a daptive filtration of market noise and statistical analysis of correlations between major Forex pairs such as EURUSD, GBPUSD, and XAUUSD. This is not merely an algorithm—it is a system that embodies the harmony of mathematical rigor and the flexibility required to operate in the ever-changing market environment. The Essence of the Method: Adaptive Filtration: The system dynamically adjusts to changing market
Trend Meter MT4
Ibrahim Olalekan Ganiu
Bonjour à tous les traders. Avez-vous du mal à déterminer si le marché est en tendance ou en range ? Si oui, ce projet est fait pour vous. Grâce à l'indicateur ADX, la plupart des traders professionnels, même les algorithmes, s'appuient sur lui pour évaluer l'humeur récente du marché. Ce projet indique la tendance et le range par des couleurs différentes afin de faciliter vos décisions de trading. Cet indicateur est un exercice pratique tiré de mon cours sur Udemy, où j'enseigne comment dével
FREE
Mirathor
Yury Emeliyanov
Mirathor — Next-Generation Intelligent Trading System Mirathor is a fully automated Expert Advisor designed for stable algorithmic trading in dynamic market conditions. It combines price-action models , dynamic levels , market-structure analysis , and adaptive risk management , creating a robust system that operates smoothly on all account types with minimal user intervention. The default optimization is performed for GBPUSD, M30 , but the algorithm demonstrates strong stability across multiple

Ultimate Price Predictor (Trade like a pro) Message Me Immediately After Purchase For Installation Help and Strategy This is an arrow indicator that shows precise price reversals. A great arsenal to add to any chart. Ultimate Price Predictor points price reversals with high degree of accuracy and it is great for scalping on the 5min time frame, Or swing trading on the 1hr time frame. Buy and sell arrows are shown on the chart as for entry signals. They do not repaint. *Great For Scalping *Grea
Technical Ratings Gauge
Mauricio Tiago Ezequiel Speroni Barboza
Technical Ratings Gauge for MT4 Technical Ratings Gauge is an indicator for MetaTrader 4 that summarizes multiple technical indicators into a single visual gauge. The indicator analyzes trend and momentum conditions using moving averages and oscillators. The final result is displayed as: Strong Sell Sell Neutral Buy Strong Buy The gauge is designed to help traders quickly view the current technical condition of the selected symbol and timeframe. The indicator automatically adapts to the active c
Drop Trend
Vitalii Zakharuk
Drop Trend is a trend indicator for the MetaTrader 4 trading platform. This indicator allows you to find the most probable trend reversal points. You will not find this indicator anywhere else. A simple but effective system for determining the forex trend. From the screenshots you can see for yourself the accuracy of this tool. Works on all currency pairs, stocks, raw materials, cryptocurrencies. Are you tired of the constant ups and downs? Do not become a victim of unstable market movements,
Strong Bot 4
Andriy Sydoruk
Strong: A Powerful Forex Bot for Multi-Currency Trading Strong is an automated tool for trading on the Forex market, utilizing modern technologies and algorithms. It is designed for traders who aim to improve the efficiency of their trading and reduce risks in a constantly changing market. Key Features of Strong Multi-Profile Trading: Strong supports a wide range of currency pairs, including both major and exotic assets. This allows traders to diversify their portfolios and adapt strategies to
Dark Breakout
Marco Solito
4.89 (9)
Dark Breakout   is an Indicator for intraday trading. This Indicator is based on Trend Following  strategy, providing an entry signal on the breakout. The signal is provided by the arrow, which confirms the breaking of the level. We can enter in good price with this Indicator, in order to follow the main trend on the current instrument. It is advised to use low spread ECN brokers. This Indicator does Not repaint and N ot lag . Recommended timeframes are M5, M15 and H1. Recommended working pairs
Simplify forex analysis: evaluate currency strength with ease This indicator evaluates all eight individual currencies by reading major, minor and crosses pairs using an indicator of your choice, and processing each currency into an index, which you can use to know the market situation of any particular currency in a simple, familiar and understandable way. [ Installation Guide | Update Guide | Troubleshooting | FAQ | All Products ] Find strong and weak currencies at a glance Compare one currenc
GridMartin Conqueror
Konstantin Kulikov
4.67 (12)
An automated trading system with smart entry/exit algorithms that uses grid and martingale techniques to maximize profits. You can search for current signals on this page, or write me a personal message:  https://www.mql5.com/en/signals/author/test-standart The default settings ( M1 timeframe ) are suitable for currency pairs, especially for pairs with GBP All new sets appear here:  https://www.mql5.com/en/blogs/post/747929 A description of the Expert's parameters can be found in the comment th
Cancer
Vitalii Zakharuk
Cancer indicator is great for trend trading! An intelligent indicator algorithm with high probability shows the points of potential market reversal. If you are trading in a trend, then a trading strategy built on the basis of this indicator is perfect for you. The indicator filters out market noise, almost everything and all the necessary functions for working with a thread are built into one tool. It works on all currency pairs and on all timeframes, indicator setting - according to your desire
This EA is Created just for RSI Entry points Indicator ( https://www.mql5.com/en/market/product/67581 Test, to show indicators profitable parameters and to give potential buyers possibility to backtest indicator Entries. EA opens Buy orders on Buy Arrows and Sell orders on Sell Arrows of the indicator, orders are closed on opposite signals. EA is not created for Live automated trading, thats not the goal to sell EA, but any ways if you like it and need it, you can rent. Default settings are fo
Ichimoku Bollinger PRO 3D (Stellar Edition) Transform your trading edge with Ichimoku Bollinger PRO 3D , a next-generation technical indicator designed for MetaTrader 4. Combining the deep analytical power of the classical Ichimoku Kinko Hyo framework with the volatility tracking of Bollinger Bands, this Stellar Edition brings a sleek, cosmic-inspired neon interface right to your charts. Key Features & Advantages No-Repaint Entry Signals: Receive high-probability BUY , SELL , STRONG BUY , and ST
Gold Strike Predator
Ignacio Agustin Mene Franco
GoldStrike Predator – Professional Expert Advisor for XAUUSD GoldStrike Predator is an advanced, high-precision Expert Advisor (EA) designed exclusively for trading the XAUUSD pair (Gold vs. US Dollar) on the MetaTrader 4 platform. Developed with a sophisticated hybrid architecture, it combines multiple layers of technical and predictive analysis to identify high-probability opportunities in the gold market, one of the world's most volatile and profitable instruments. Trading Strategy The sys
Sven AI Trading BOT EA is operating Grid, Martingale, Arbitrage Strategies by new moderne Artificial Intelligence Technologies ! Sven AI Trading BOT EA is using new moderne Artificial Intelligence Grid Technologies for very fast automatical High-Frequency trading of CFDs, Currencies, Forex (FX), Indices, Indexes, Stocks, Shares, ETFs, Gold, Commodities, Metals, ETCs, Futures and Options into MetaTrader 4 Platform ! Sven AI Trading BOT EA is using new High Quantity and High Quality Artificial Int
Jerk Indicator
Safwan Rushdi Khalil Arekat
5 (2)
In physics, "Jerk" is the third time-derivative of position, with acceleration being the second derivative and velocity the first derivative. In technical analysis, the first derivative of price is the price momentum, with the second derivative,acceleration, being seldom used and the third derivative virtually unknown. The magnitude frequency response of a digital differentiator is a positive-slope straight line passing through zero frequency. Therefore, every instance of a digital signal differ
FREE
Niubility Trend  Niubility Trend displays the trend direction for all time frames in real time. You'll see at a glance at which direction the trends are running, how long they last and how powerful they are. All this makes it an easy-to-use trend trading system for beginners, advanced and professional traders. Features Easy to trade Customizable colors and sizes It is non-repainting and non-backpainting It is fantastic as a trailing stop method It implements alerts of all kinds
Les acheteurs de ce produit ont également acheté
Miraculous Indicator Binary & Forex v3 StrategySafe Miraculous Indicator Binary & Forex v3 StrategySafe est un indicateur professionnel conçu pour les traders qui recherchent des signaux clairs, des outils de confirmation puissants et une méthode structurée pour trader les marchés Binary et Forex. La version v3 intègre le MIR Dashboard, le Miraculous Confirmation Dashboard, la GANN Law, les niveaux Square of 9, les angles GANN et un mode Forex plus avancé pour une analyse plus complète. Fonction
ORB Seeker
Marcela Goncalves De Oliveira
4 (1)
Prix spécial pour limiter la disponibilité et maintenir la rareté du produit ! Seulement 599 $ ! Après votre achat, contactez-moi pour obtenir le bonus ORB Seeker EA et les fichiers de configuration optimisés personnalisés. Réussissez vos sessions de mixage en toute confiance ! ORB Seeker est un indicateur professionnel de cassure de la plage d'ouverture (ORB) conçu pour les traders qui recherchent précision, simplicité, flexibilité et une structure graphique claire. Il trace automatiquement l
OrderFlow Absorption – Indicateur professionnel de delta et de signaux d’absorption pour MT4 Libérez la puissance de l’analyse réelle du flux d’ordres avec OrderFlow Absorption – l’indicateur ultime d’histogramme delta et de signaux d’absorption pour MetaTrader 4. Conçu pour les traders qui veulent comprendre ce qui se passe réellement derrière chaque mouvement de prix, cet outil révèle la pression d’achat/vente cachée et les événements d’absorption qui font bouger le marché. Fonctionnalités Vis
TrendMaestro
Stefano Frisetti
4 (4)
Attention: beware of SCAMS, TRENDMAESTRO is only ditributed throught MQL5.com market place. note: this indicator is for METATRADER4, if you want the version for METATRADER5 this is the link:  https://www.mql5.com/it/market/product/108106 TRENDMAESTRO ver 2.5 TRENDMAESTRO recognizes a new TREND from the start, he never makes mistakes. The certainty of identifying a new TREND is priceless. DESCRIPTION TRENDMAESTRO identifies a new TREND in the bud, this indicator examines the volatility, volumes a
There is always a need to measure if the market is "quiet" or it is volatile. One of the possible way is to use standard deviations, but the issue is simple : We do not have some levels that could help us find out if the market is in a state of lower or higher volatility. This indicator is attempting to do that : •           values above level 0 are indicating state of higher volatility (=GREEN buffer) •           values below level 0 are indicating state of lower volatility (=RED buffer)
Meravith
Ivan Stefanov
5 (3)
Outil des market makers. Meravith va : Analyser toutes les unités de temps et afficher la tendance actuellement en vigueur. Mettre en évidence les zones de liquidité (équilibre des volumes) où le volume haussier et baissier est égal. Afficher tous les niveaux de liquidité provenant de différentes unités de temps directement sur votre graphique. Générer et présenter une analyse de marché sous forme de texte pour votre référence. Calculer les objectifs, les niveaux de support et les points de stop
Binary Booster
Yaroslav Varankin
5 (1)
Binary Options Trading Indicator: A Reliable Tool for Your Trades This indicator is specifically designed for binary options trading and has proven its high quality, reliability, and adequate accuracy, depending on the dynamics of the chart. Key Points: Signal Interpretation: When a blue cross signal appears, it indicates a potential entry into a trade, though it is considered a weak signal on its own. However, if the blue cross is accompanied by an arrow, it is considered a more reliable buy s
First time on MetaTrader, introducing IQ Star Lines - an original Vedic Astrology based indicator. "Millionaires don't use astrology, billionaires do" . - J.P. Morgan, Legendary American financier and banker. We don't offer free or bonus indicators in exchange of reviews from you. You won't need any free products with this indicator to make it work. ;) Enjoy! Welcome to  the new and updated  IQ Star Lines , the ultimate fusion of ancient planetary harmonic cycles and modern quantitative trading.
CVD Divergence Détection - Analyse Avancée du Delta de Volume   LE PROBLÈME QUE NOUS RÉSOLVONS La plupart des traders s'appuient uniquement sur l'action des prix, manquant des informations cruciales sur le flux de volume qui révèlent le véritable sentiment du marché. Les indicateurs traditionnels sont en retard par rapport aux mouvements de prix, causant des entrées tardives et une mauvaise gestion des risques. CVD Divergence Detection résout cela en analysant la relation entre le prix et le
FFx Engulfing Setup Alerter gives trade suggestions with Entry, Target 1, Target 2 and StopLoss. Below are the different options available: Entry suggestion - pips to be added over the break for the entry 3 different options to calculate the SL - by pips, by ATR multiplier or at the pattern High/Low 3 different options to calculate the 2 TPs - by pips, by ATR multiplier or at Risk/Reward Offset the dashboard - any place on the chart Remove the suggestion once the price reached the SL line Lines
FFx InsideBar Setup Alerter gives trade suggestions with Entry, Target 1, Target 2 and StopLoss. Below are the different options available: Entry suggestion - pips to be added over the break for the entry Minimum candle size - to avoid too close buy/sell entry suggestions 3 different options to calculate the SL - by pips, by ATR multiplier or at the pattern High/Low 3 different options to calculate the 2 TPs - by pips, by ATR multiplier or at Risk/Reward Offset the dashboard - any place on the c
FFx OutsideBar Setup Alerter gives trade suggestions with Entry, Target 1, Target 2 and StopLoss. Below are the different options available: Entry suggestion - pips to be added over the break for the entry. 3 different options to calculate the SL - by pips, by ATR multiplier or at the pattern High/Low. 3 different options to calculate the 2 TPs - by pips, by ATR multiplier or at Risk/Reward. Offset the dashboard - any place on the chart. Remove the suggestion once the price reached the SL line.
FFx PinBar Setup Alerter gives trade suggestions with Entry, Target 1, Target 2 and StopLoss. Below are the different options available: Entry suggestion - pips to be added over the break for the entry Minimum candle size - to avoid too small candles 3 different options to calculate the SL - by pips, by ATR multiplier or at the pattern High/Low 3 different options to calculate the 2 TPs - by pips, by ATR multiplier or at Risk/Reward Offset the dashboard - any place on the chart Remove the sugges
Automatic, live & interactive picture of all trendlines. Assign push, email and sound alerts to the lines of your choice and be informed about price rollback, breakout, rollback after breakout, number of rollbacks, line expiration by double breakout. Correct, drag or delete the lines and interactively tune the line system. https://youtu.be/EJUo9pYiHFA . Chart examples https: //www.mql5.com/en/users/efficientforex Price Interaction Events All events are effective immediately and only after one
Adaptive Stochastic
Rasoul Mojtahedzadeh
Stochastic Oscillator is one of the most popular and accurate oscillators widely used by traders to capture overbought and oversold areas of price action. Although the Stochastic indicator works fine for an interval of the market, it fails to generate profitable signals when the market conditions change, and hence it produces wrong signals resulting in big losses. Have you ever thought about an adaptive Stochastic indicator that adapts its period of calculation based on the market conditions? Th
The purpose of this new version of the MT4 standard indicator provided in your platform is to display in a sub-window multiple timeframes of the same indicator with its divergences. See the example shown in the picture below. But the display isn't like a simple MTF indicator. This is the real display of the indicator on its timeframe. Here's the options available in the FFx divergences indicator: Select the timeframes to be displayed (M1 to Monthly) Define the width (number of bars) for each tim
The purpose of this new version of the MT4 standard indicator provided in your platform is to display in a sub-window multiple timeframes of the same indicator with its divergences. See the example shown in the picture below. But the display isn't like a simple MTF indicator. This is the real display of the indicator on its timeframe. Here's the options available in the FFx divergences indicator: Select the timeframes to be displayed (M1 to Monthly). Define the width (number of bars) for each ti
The FFx Dashboard MTF alerter will show you on a single chart all the timeframes (M1 to Monthly) with their own status for the indicator. 2 Alert Options: Single timeframe: each selected timeframe alert separately when a signal occurs Multi timeframes: all selected timeframes must agree for an alert to be triggered Both options have an input to select the timeframes to be used for the alert(s). How to Understand the Status: Green/Red square: histogram above/below 0 line Green square + Red bord
The FFx Dashboard MTF alerter will show you on a single chart all the timeframes (M1 to Monthly) with their own status for the indicator. 2 Alert Options: Single timeframe: each selected timeframe alert separately when a signal occurs Multi timeframes: all selected timeframes must agree for an alert to be triggered Both options have an input to select the timeframes to be used for the alert(s). How to understand the status: Green/Red square: RSI above/below 50 line Green square + Red border: R
The FFx Dashboard MTF alerter will show you on a single chart all the timeframes (M1 to Monthly) with their own status for the indicator. 2 Alert Options: Single timeframe: each selected timeframe alert separately when a signal occurs Multi timeframes: all selected timeframes must agree for an alert to be triggered Both options have an input to select the timeframes to be used for the alert(s). How to understand the status: Green/Red square: Stoch above/below 50 line Green square + Red border:
The FFx Dashboard MTF alerter will show you on a single chart all the timeframes (M1 to Monthly) with their own status for the indicator. 2 Alert Options: Single timeframe: each selected timeframe alert separately when a signal occurs Multi timeframes: all selected timeframes must agree for an alert to be triggered Both options have an input to select the timeframes to be used for the alert(s). How to understand the status: Green/Red square: Price above/below Cloud (Kumo) Green square + Red bo
The FFx Dashboard MTF alerter will show you on a single chart all the timeframes (M1 to Monthly) with their own status for the indicator. 2 Alert Options: Single timeframe: each selected timeframe alert separately when a signal occurs Multi timeframes: all selected timeframes must agree for an alert to be triggered Both options have an input to select the timeframes to be used for the alert(s). How to understand the status: Green/Red square: MA pointing Up/Down Green square + Red border: MA po
The FFx Dashboard MTF alerter will show you on a single chart all the timeframes (M1 to Monthly) with their own status for the indicator. 2 Alert Options: Single timeframe: each selected timeframe alert separately when a signal occurs. Multi timeframes: all selected timeframes must agree for an alert to be triggered. Both options have an input to select the timeframes to be used for the alert(s). How to understand the status: Green square: Price above PSAR Red square: Price below PSAR Options
The FFx Dashboard MTF alerter will show you on a single chart all the timeframes (M1 to Monthly) with their own status for the indicator. 2 Alert Options: Single timeframe: each selected timeframe alert separately when a signal occurs Multi timeframes: all selected timeframes must agree for an alert to be triggered Both options have an input to select the timeframes to be used for the alert(s). How to understand the status: Green/Red square: CCI above/below levels (ie. 100/-100) Grey square: C
The FFx Dashboard MTF alerter will show you on a single chart all the timeframes (M1 to Monthly) with their own status for the indicator. 2 Alert Options: Single timeframe: each selected timeframe alert separately when a signal occurs Multi timeframes: all selected timeframes must agree for an alert to be triggered Both options have an input to select the timeframes to be used for the alert(s). How to understand the status: Green/Red square: ADX above level Grey square: ADX below level Red bor
The FFx Dashboard MTF alerter will show you on a single chart all the timeframes (M1 to Monthly) with their own status. 2 Alert Options: Single timeframe: each selected timeframe alert separately when a signal occurs Multi timeframes: all selected timeframes must agree for an alert to be triggered Both options have an input to select the timeframes to be used for the alert(s). How to understand the status: Green/Red square: bullish/bearish candle Options available in the FFx Dashboard Alerter
Simply drop the indicator to the chart and Fibonacci levels will be shown automatically! The indicator is developed for automatic drawing of Fibonacci levels on the chart. It provides the abilities to: Select the standard Fibo levels to be shown Add custom levels Draw the indicator on the timeframes other than the current one. For example, the indicator is calculated on the weekly period (W1) and is displayed on the monthly period (MN1) Select the timeframes the indicator will be available on Ca
Filtrer:
Aucun avis
Répondre à l'avis