
MT5 Market Profiles
- Indicateurs
-
Anh Hung Ngo
 Request a MQL5 Tools, visit quantumine.net
 - Version: 2.1
- Mise à jour: 18 août 2026
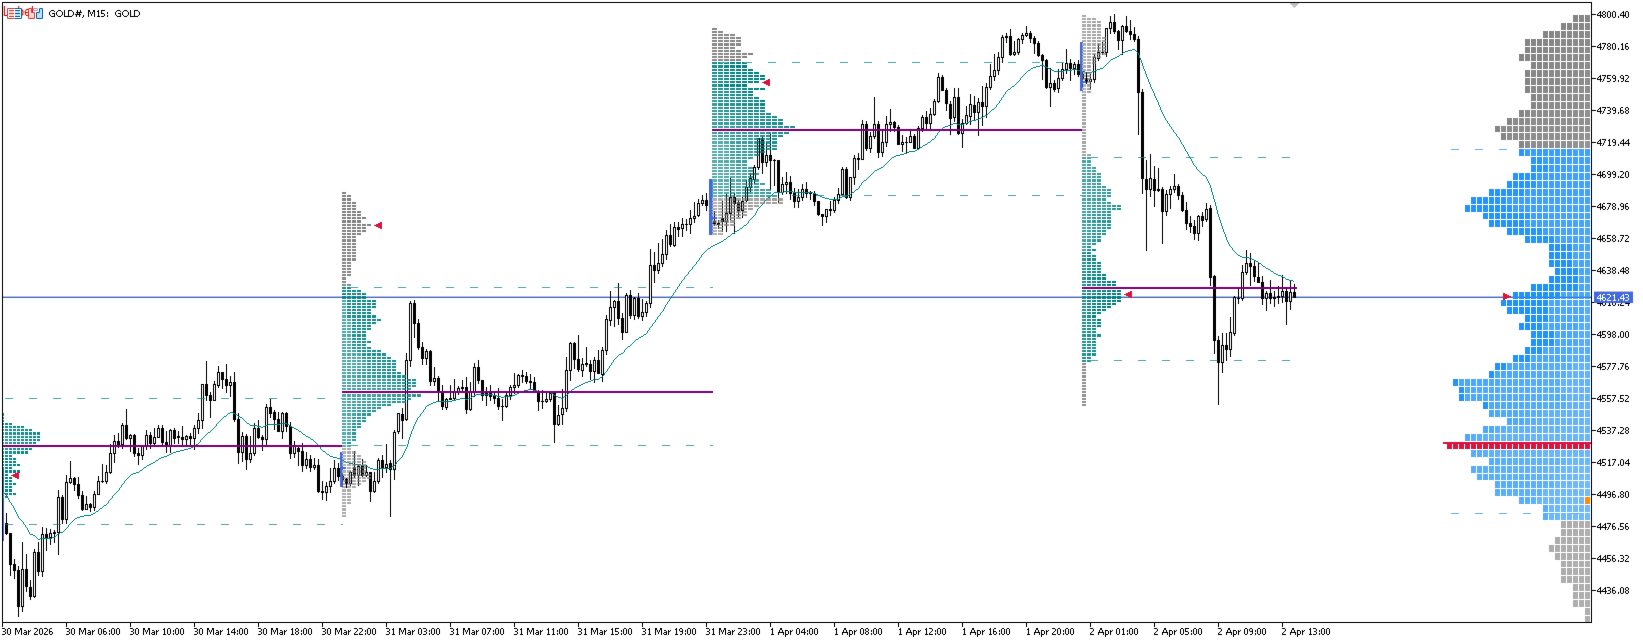
TPO Market Profile displays Time Price Opportunity profiles directly on your MetaTrader 5 chart. Each session is divided into 30-minute brackets, helping traders identify value areas, balance zones, and key support/resistance levels. A built-in Volume mode and an on-chart control panel let you switch views with one click — no need to reopen the settings window.
Key Features:
- Daily, Weekly & Monthly profiles with up to 50 historical sessions (12 for Monthly)
- POC, Value Area (VAH/VAL) calculated using standard CME method (70% rule)
- TPO / Volume metric switch — POC and Value Area recalculate instantly, no data reload
- Merged or Split view — pack blocks to the left, or place every 30-minute bracket at its real position on the time axis, so each letter sits directly above the candles that produced it
- Initial Balance — IBH/IBL lines over the first sub-session: 60 minutes on Daily, the first trading day on Weekly and Monthly
- Naked Levels — unvisited POC/VAH/VAL automatically extended to current price with price labels
- Bracket letters (A–Z, a–z) show which 30-min period visited each price level — on Weekly/Monthly they recycle every day, so the same letter always marks the same time of day
- Time gradient shading — earlier brackets appear lighter, recent ones darker
- Right Profile mode — anchors current session profile to the right edge of the chart
- The developing session scales with elapsed time — the profile never draws into the future
- On-chart control panel — toggle everything with one click, including hiding the whole indicator
- Auto row sizing — optimal tick-per-row calculated from session range
- Self-healing start — waits for history to sync and builds automatically; Refresh button forces a full recalculation
Requirements: Complete M1 history data. Recommended timeframe: M15–H1. Enable Chart Shift when using Right Profile.
How to Use
- Attach the indicator to any chart (M15–H1 recommended)
- Set History Count = 3–5 for intraday trading, 10–20 for swing trading
- Enable Extend Lines to spot Naked levels acting as potential support/resistance
- Use Right Profile + Chart Shift for real-time current session monitoring
- Increase Target Rows to 80–100 for more detail, decrease to 30–40 for overview
- Pair it with the Volume Profile indicator (Anchor Session Right enabled) for a classic TPO-left + volume-right session layout
Control Panel
A compact button panel sits in the top-left corner of the chart. Green = enabled, gray = disabled, blue = mode selector. To move it, set the Panel X / Panel Y inputs (pixels from the top-left corner). When running two copies or combining with Volume Profile, give each panel its own X/Y so they do not overlap.
| Button | Action |
|---|---|
| TPO [-] / [+] | Collapse / expand the panel |
| Refresh | Force a full recalculation of all profiles |
| Merged / Split | Toggle merged blocks vs time-aligned brackets (disabled while Right Profile is on — that layout is always merged) |
| TPO / Volume | Switch the profile metric — POC/VA recalculate instantly |
| VA: ON/OFF | Toggle VAH/VAL lines |
| IB: ON/OFF | Toggle Initial Balance lines |
| Right: ON/OFF | Toggle Right Profile mode |
| Daily / Weekly / Monthly | Cycle session period Daily → Weekly → Monthly (rebuilds profiles) |
| Hide / Show | Hide the entire indicator. Data keeps updating in the background, so Show restores it instantly |
Input Parameters
Profile Settings
| Parameter | Default | Description |
|---|---|---|
| Profile Period | Daily | Session period: Daily, Weekly or Monthly |
| Profile Mode | TPO | Profile metric: TPO (time-based) or Volume — POC/VA follow the selected metric |
| Split Profile | false | Place each 30-minute bracket at its own position on the time axis instead of packing blocks left. Spans the full session regardless of Width Percent |
| History Count | 5 | Number of historical sessions to display (0–50). 0 = current session only |
| Width Percent | 50 | Profile width as % of session space on chart (5–100). Applies to Merged view and Right Profile; Split view always spans the full session |
| Ticks Per Row | 0 (Auto) | Ticks per row. 0 = auto-calculated from Target Rows |
| Target Rows | 60 | Target row count in Auto mode (20–200) |
| Enable Time Gradient | true | Gradient shading by time: early brackets lighter, late brackets darker |
| Show Letters in Blocks | true | Display bracket letters (A, B, C...) inside each block |
| Font Name | Consolas | Font for bracket letters |
| Right-Anchored Profile | false | Anchor current session profile to chart right edge. Requires Chart Shift |
Lines
| Parameter | Default | Description |
|---|---|---|
| Show POC Line | false | Display the POC line |
| Show VA Lines | false | Display VAH and VAL lines |
| Show IB Range Lines | false | Display Initial Balance IBH/IBL lines (first 60 min on Daily, first trading day on Weekly/Monthly) |
| Extend Naked Lines | false | Extend unvisited POC/VAH/VAL to current time |
| Show Price Labels | false | Price labels at the end of extended lines (requires Extend Naked Lines) |
TPO Colors
| Parameter | Default | Description |
|---|---|---|
| POC Color | Purple | Color for POC blocks and line |
| Value Area Color | Teal | Color for blocks inside Value Area |
| Outside VA Color | Gray | Color for blocks outside Value Area |
| Open Marker Color | Green | Color for session open marker block |
| Close Marker Color | Crimson | Color for session close marker triangle |
Line Colors, Width & Style
| Parameter | Default | Description |
|---|---|---|
| VAH Line Color | Teal | Value Area High line color |
| VAL Line Color | Teal | Value Area Low line color |
| IB Background Color | Green | Initial Balance line color |
| POC Line Width | 2 | POC line thickness (1–5 pixels) |
| VA Line Width | 1 | VA line thickness (1–5 pixels) |
| IB Line Width | 1 | IB line thickness (1–5 pixels) |
| POC Line Style | Solid | POC line style (Solid / Dash / Dot) |
| VA Line Style | Dash | VA line style (Solid / Dash / Dot) |
| IB Line Style | Dash | IB line style (Solid / Dash / Dot) |
Control Panel
| Parameter | Default | Description |
|---|---|---|
| Show Control Panel | true | Show / hide the on-chart button panel |
| Panel X | 10 | Panel distance from the left edge (pixels) |
| Panel Y | 20 | Panel distance from the top edge (pixels) |















































L'utilisateur n'a laissé aucun commentaire sur la note