 MetaTrader 5
 Experts
 Indicateurs
 Scripts
 Bibliothèque
 Stockage
Voir comment télécharger gratuitement des robots de trading
Retrouvez-nous sur Facebook !
Rejoignez notre page de fans
Rejoignez notre page de fans
Vous avez aimé le script ? Essayez-le dans le terminal MetaTrader 5

Gap and Weekend Map: Measuring Gap Fill Rate, Fill Time and Gap Size Relative to ATR - indicateur pour MetaTrader 5

- Vues:
- 59
- Publié:
-
 Vous manquez des opportunités de trading :
- Applications de trading gratuites
- Plus de 8 000 signaux à copier
- Actualités économiques pour explorer les marchés financiers
Inscription Se connecterVous acceptez la politique du site Web et les conditions d'utilisation
Si vous n'avez pas de compte, veuillez vous inscrire -
 Besoin d'un robot ou d'un indicateur basé sur ce code ? Commandez-le sur Freelance
Aller sur Freelance

Gap and Weekend Map: Measuring Gap Fill Rate, Fill Time and Gap Size Relative to ATR
OVERVIEW
Most gap tools draw a gap and stop there. The questions a trader actually asks come afterwards: do gaps on this symbol fill, how quickly, and does the size of the gap change the odds? The answer is different for every broker, symbol and timeframe, because it depends on the broker's session times, the instrument and the price history that is available. This indicator measures it on your own chart.
A few definitions make the numbers comparable between symbols:
- Gap. A bar opens above the high of the previous bar (up gap) or below its low (down gap). The size of the gap is the distance between the open and that old high or low.
- Size in ATR. The size is divided by the Wilder ATR of the previous bar, so a gap of 0.5 means half of a normal bar range, on an index, a stock or a crypto CFD alike. Only gaps of at least InpMinGapAtr are recorded.
- Weekend gap. A gap that follows a break between two bars longer than InpWeekendHours . The length of one bar is not counted as a break, so consecutive bars on any timeframe from M1 to D1 are never flagged. Long holiday breaks can be flagged as well.
- Fill level. Chosen with InpFillMode . The default is the previous close, the usual meaning of "the gap was filled". The alternatives are the gap edge (the old high or low, a partial fill) and the far extreme of the previous bar (a complete retracement of that bar).
- Fill time. The number of bars from the gap bar to the first bar that reaches the fill level. The gap bar itself counts as 0, so 0 means the gap was filled within the same bar.
- Three outcomes. A gap is filled if the level is reached within InpMaxBars bars, expired if it is not reached by the last allowed bar, and open while it is still inside that window. Open gaps are not counted in the fill rate, because they have not been decided yet. Without this rule a fill rate would look better than it is.
The calculation is incremental. On every call only the new bars and the bar that was still forming are processed, and a gap is only evaluated against the bars that follow it, so history is never rescanned on a tick. A gap can be filled by the forming bar, but it can only expire after the last allowed bar has closed, so a status never flips back.
WHAT TO LOOK OUT FOR
- Boxes on the main chart. For each gap one box spans the gap, from the old high or low to the open of the gap bar, starting at the gap bar. It ends one bar after the bar that decided the gap (the fill bar, or the last allowed bar), or one bar after the last bar while the gap is open. Gray box: filled. White box: open. Dotted dark box: not filled within InpMaxBars . A thicker outline marks a weekend gap.
- Dashed line. The fill level of each gap, drawn over the same span as the box. A filled gap's line ends where price came back to it.
- Histogram in the indicator window. One bar per gap, at the gap bar. Up gaps are above zero and down gaps below zero, and the height is the size in ATR. Bars are clipped at InpPlotCapAtr for readability, the exact value is in the Data Window. Colors follow the status: gray filled, white open, dark gray expired.
- Dot above or below a bar. A weekend gap.
- Dotted levels. At plus and minus InpBucket1 and InpBucket2 . They are the borders of the three size buckets used in the panel.
- Data Window. "Gap size (ATR)" is the signed, unclipped size, and "Bars to fill" is the fill time of a filled gap (it is empty for gaps that are not filled).
- Panel (top left of the chart).
- Line 1: symbol, timeframe and the main settings.
- Lines 2 and 3: the number of gaps (weekend gaps, up, down) and how many are filled, expired and still open. "Decided" is filled plus expired.
- Line 4: the fill rate, filled divided by decided, for all gaps and for weekend gaps.
- Line 5: the median and the 90th percentile of the fill time of the filled gaps. The median is the lower median.
- Lines 6 to 8: the number of gaps, the fill rate and the median fill time for gaps smaller than InpBucket1 , between the two borders, and larger than InpBucket2 . Weekend gaps are also counted in their size bucket.
- Line 9: the newest gap, its direction, size, status and age in bars.
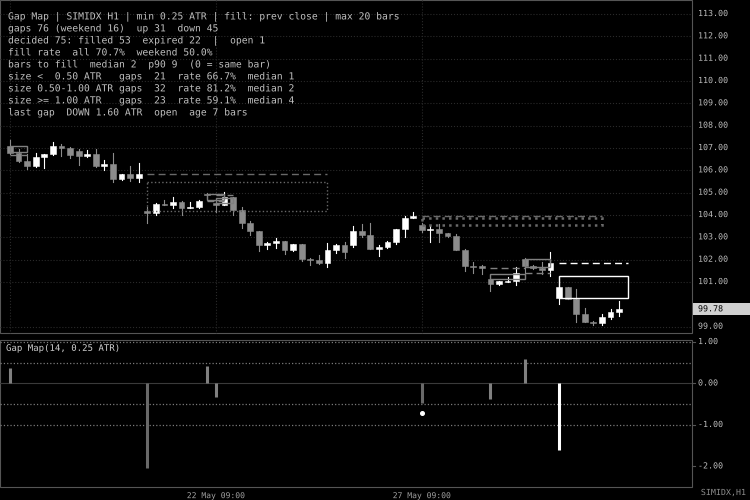
Fig. 1. The last 72 bars of an H1 index-type series with 8 gaps: five filled (gray boxes), two not filled within 20 bars (dotted boxes, one of them the weekend gap, drawn with a thicker outline and marked by a dot in the indicator window) and one open gap (white box, 1.60 ATR). Dashed lines are the fill levels. The panel shows the statistics of all analysed bars. Black and white screenshot, per the Code Base image guidelines.
External variables (inputs)
| Input | Default | Purpose |
|---|---|---|
| InpAtrPeriod | 14 | Period of the Wilder ATR that measures the gap size (2-200). The ATR of the bar before the gap is used. |
| InpMinGapAtr | 0.25 | Smallest gap that is recorded, in ATR (0.01-10). Raise it to ignore noise, lower it to count every gap. |
| InpWeekendHours | 24 | A break between two bars longer than this many hours (the length of one bar is not counted) marks a weekend gap (1-200). |
| InpFillMode | FILL_PREV_CLOSE | Level that has to be reached for a fill: FILL_EDGE (old high or low), FILL_PREV_CLOSE (previous close), FILL_PREV_RANGE (far extreme of the previous bar). |
| InpMaxBars | 20 | Bars allowed for a fill, counted from the gap bar, which is bar 0 (1-500). A gap not filled by then is expired. |
| InpHistoryBars | 3000 | Newest bars analysed when the indicator is loaded or fully recalculated. 0 analyses all bars. New bars are added as they arrive. |
| InpBucket1 | 0.5 | Upper border of the small gap bucket, in ATR. |
| InpBucket2 | 1.0 | Upper border of the medium gap bucket, in ATR. It is kept above InpBucket1 . |
| InpShowBoxes | true | Draw a box and a fill-level line for each gap. |
| InpMaxGapsShown | 40 | Newest gaps that keep their chart objects (0-500). Older gaps are still in the statistics. Two objects per gap. |
| InpShowPanel | true | Show the statistics panel. |
| InpPlotCapAtr | 4.0 | Largest histogram bar, in ATR (1-20). Larger gaps are clipped in the picture only. |
| InpFilledColor | clrGray | Color of filled gaps (boxes, lines and histogram). |
| InpOpenColor | clrWhite | Color of open gaps. |
| InpExpiredColor | clrDimGray | Color of gaps not filled within the limit. |
| InpTextColor | clrSilver | Panel text color. |
| InpFontSize | 8 | Panel font size (Consolas). The line height follows the size. |
| InpPanelX , InpPanelY | 8, 14 | Panel offset from the upper left corner of the chart, in pixels. |
Recommended use
- Symbols. Instruments that close between sessions: stock indices, single stocks and crypto CFDs with trading breaks. On a 24-hour forex symbol there are almost no gaps except after the weekend, and the panel will show only a handful of them. Run it on the symbols you trade, and only compare symbols through the ATR-based sizes.
- Timeframes. H1 to D1 are the natural choice. On M1 to M5 most gaps are a few points and fall under the minimum size. On W1 and MN1 the weekend is part of every bar, so there are no weekend gaps. Scale InpMaxBars with the timeframe: 20 bars is about two and a half sessions on H1 but about a month on D1.
- Number of gaps. A rate from 10 or 20 gaps means little. Load enough history ( InpHistoryBars ) and read the counts in the panel together with the percentages, especially in the weekend and size lines, which are small samples.
- It describes the past. A fill rate is a statistic of the loaded history, not a signal. It also depends on your broker's session times, time zone settings and history depth, so the figures of two brokers can differ.
- Choosing the fill rule. Previous close is stricter than the gap edge and looser than the whole previous bar. Change InpFillMode and watch the rate: if it moves a lot, the result depends mostly on how you define "filled".
- Open and expired gaps. The newest gaps are open, and they are not in the rate. A gap needs up to InpMaxBars bars before it is decided, which on H1 is a few sessions on an index and about a day on a 24-hour symbol. Gaps decided as expired stay expired even if price fills them later, because the limit is part of the definition.
- Performance. Gap records are kept in memory and the panel counters are updated only when a gap is recorded or decided. Only the newest InpMaxGapsShown gaps have chart objects, so a long history does not slow the chart down.
- Chart objects. Boxes and lines are created in the main chart window, the histogram is in the indicator window, and the panel is in the main window. All objects start with the prefix GM_ and are removed in OnDeinit() . The object names can be used to find them in the object list.
- Strategy Tester. Use visual mode. The tester does not call OnDeinit() for indicators.
- Account types. The indicator does not trade and does not depend on netting or hedging accounts.
 Session Time - session hours to broker server time with daylight saving
Converts session hours given in London, New York, Tokyo or Sydney time into broker server time, including US and EU daylight saving and the weeks when the two are out of step. Comes with a check script that verifies 15 hand-calculated cases.
 Basket Guard - closes a basket of positions at loss or profit in percent of balance
Free Expert Advisor that watches a basket of open positions (all, by Magic number or by symbols) and closes the whole basket when floating loss or profit reaches a set percent of balance. Works next to any EA or manual trading.
Accelerator Oscillator (AC)
The Acceleration/Deceleration Indicator (AC) measures acceleration and deceleration of the current driving force.
MACD Signals
Indicator edition for new platform.