 MetaTrader 5
 Experts
 Indicateurs
 Scripts
 Bibliothèque
 Stockage
Voir comment télécharger gratuitement des robots de trading
Retrouvez-nous sur Twitter !
Rejoignez notre page de fans
Rejoignez notre page de fans
Vous avez aimé le script ? Essayez-le dans le terminal MetaTrader 5

- Vues:
- 93
- Publié:
-
 Vous manquez des opportunités de trading :
- Applications de trading gratuites
- Plus de 8 000 signaux à copier
- Actualités économiques pour explorer les marchés financiers
Inscription Se connecterVous acceptez la politique du site Web et les conditions d'utilisation
Si vous n'avez pas de compte, veuillez vous inscrire -
 Besoin d'un robot ou d'un indicateur basé sur ce code ? Commandez-le sur Freelance
Aller sur Freelance

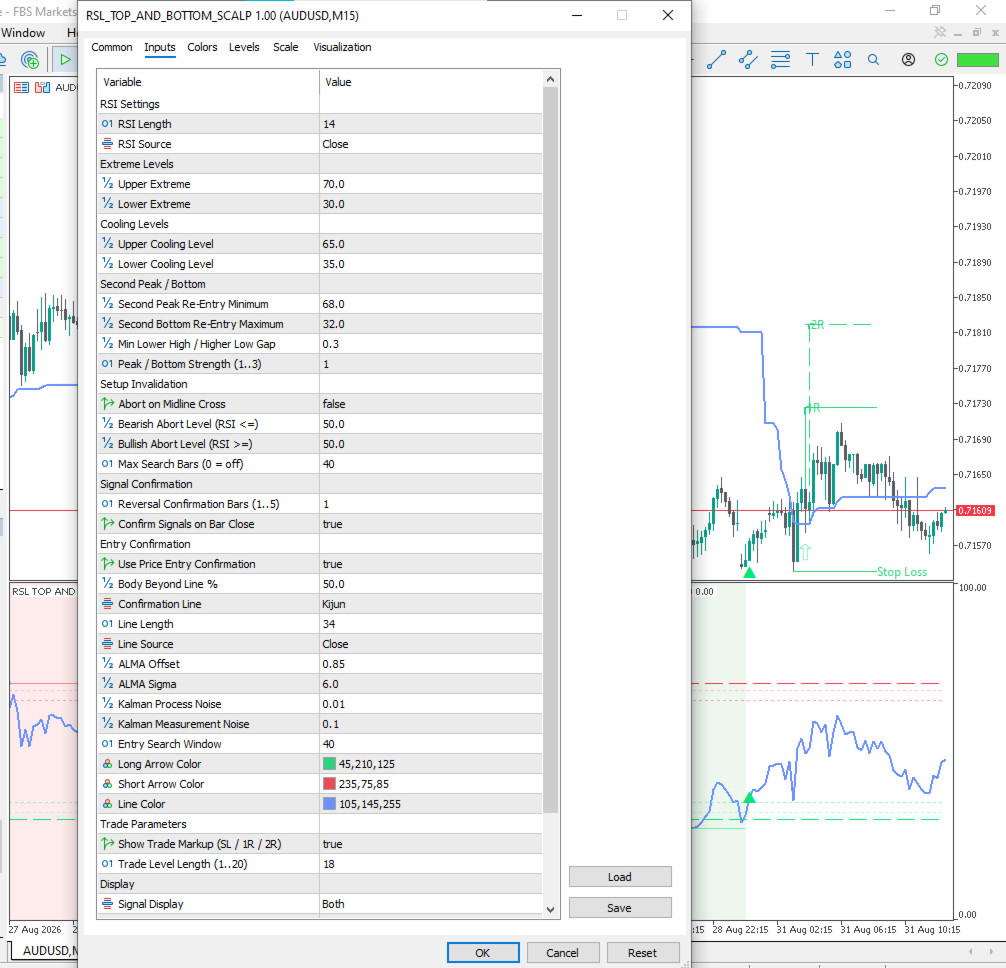

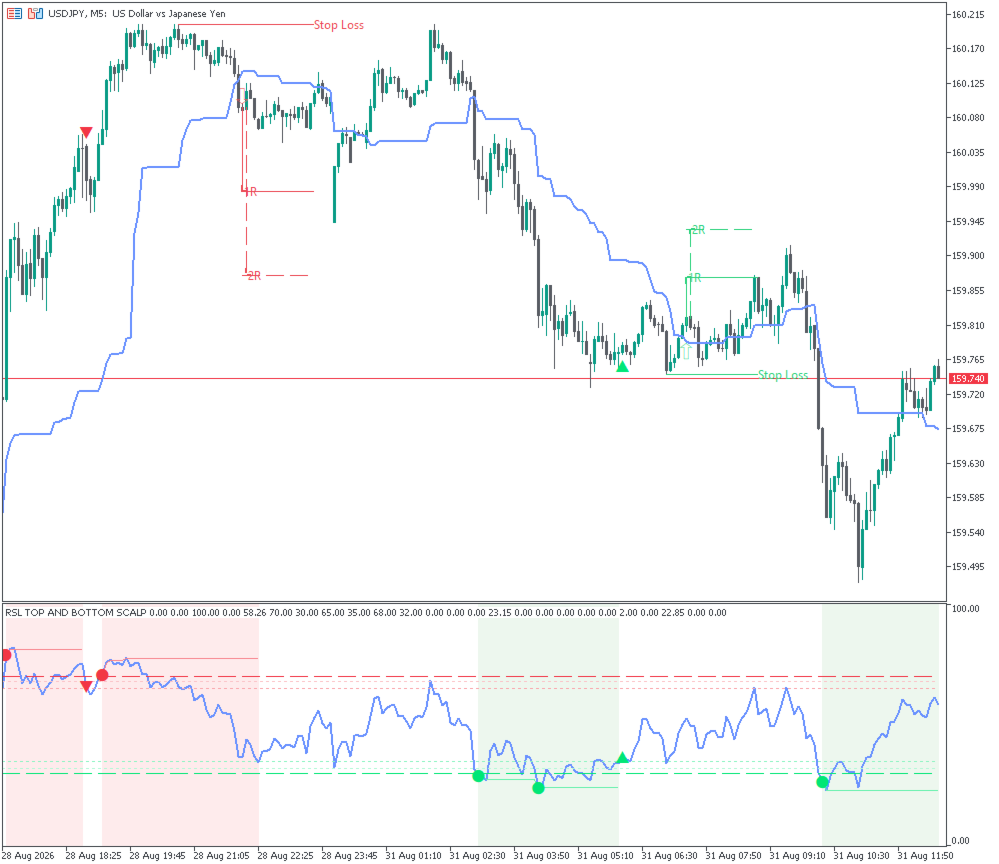

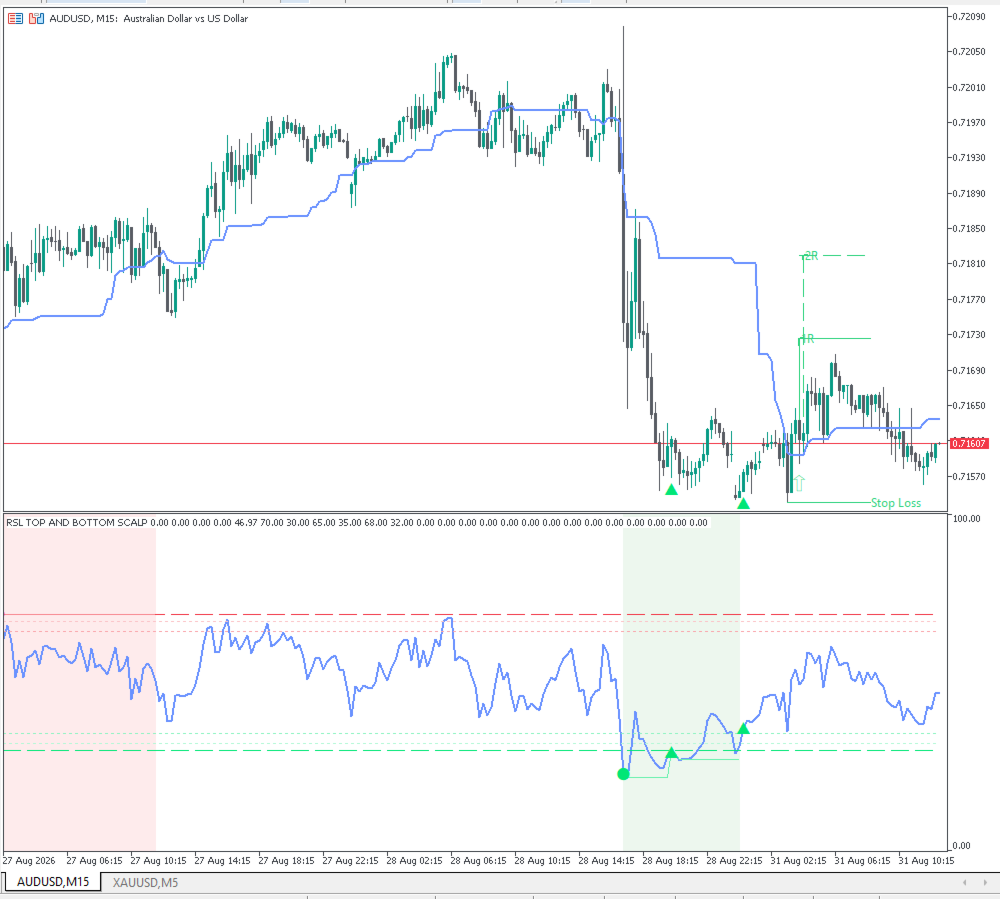
The indicator can also confirm entries using different moving average and price lines such as EMA, SMA, HMA, KAMA, ALMA, Kijun and others. Once an entry is confirmed, it can automatically display the Stop Loss, 1R and 2R target levels directly on the chart
Main features include:
RSI top and bottom retest signals
Buy and Sell entry arrowsPrice confirmation before entry
Multiple confirmation line options
Stop Loss, 1R and 2R levels
Adjustable RSI and confirmation settings
Works on different symbols and timeframes
Clear RSI panel and chart signals
Alerts for confirmed entries
The indicator is suitable for scalping, intraday trading and reversal trading on Forex, Gold and other markets.
Your capital is at Risk Adaptive SuperTrend K-Means
A faithful MetaTrader 5 port of the open-source TradingView indicator "Machine Learning Adaptive SuperTrend" by AlgoAlpha: K-means clusters recent ATR into high, medium and low volatility, and the SuperTrend band uses the centroid of the current cluster. No repainting, alerts, gradient fill and statistics table.
Tester vs Live Trade Matcher
A free, read-only MetaTrader 5 utility: it reads a Strategy Tester report (MT5 or MT4 .htm) and matches every backtest trade with your account history or with a second report. It shows the match rate, missed and extra trades, slippage, delay, real costs and how much of the backtest edge survives live.
MTF Trend Dashboard — trend, position and volatility on six timeframes at a glance
One on-chart table for M15, H1, H4, D1, W1 and MN1: EMA slope, price vs EMA, Donchian position, ATR percentile and a combined UP / DOWN / RANGE regime. Completed bars only. Any symbol.
Swap Cost Panel — tonight's rollover cost for every open position
On-chart panel that estimates tonight's swap for each open position in account currency, marks the triple-swap day, and compares it with the cost of closing before rollover and re-opening after (spread + commission).