 MetaTrader 5
 Experts
 Indicateurs
 Scripts
 Bibliothèque
 Stockage
Voir comment télécharger gratuitement des robots de trading
Retrouvez-nous sur Twitter !
Rejoignez notre page de fans
Rejoignez notre page de fans
Vous avez aimé le script ? Essayez-le dans le terminal MetaTrader 5

Gold Trend Breakout Lite — educational XAUUSD trend-following EA - expert pour MetaTrader 5
Shipra Gupta

Je suis Shipra Gupta, trader et développeuse de stratégies quantitatives avec une solide formation en mathématiques, économie et systèmes de trading algorithmique. Au fil des années, j’ai travaillé activement sur les marchés du forex, de l’or, des indices, des matières premières et des
- Vues:
- 297
- Publié:
-
 Vous manquez des opportunités de trading :
- Applications de trading gratuites
- Plus de 8 000 signaux à copier
- Actualités économiques pour explorer les marchés financiers
Inscription Se connecterVous acceptez la politique du site Web et les conditions d'utilisation
Si vous n'avez pas de compte, veuillez vous inscrire -
 Besoin d'un robot ou d'un indicateur basé sur ce code ? Commandez-le sur Freelance
Aller sur Freelance
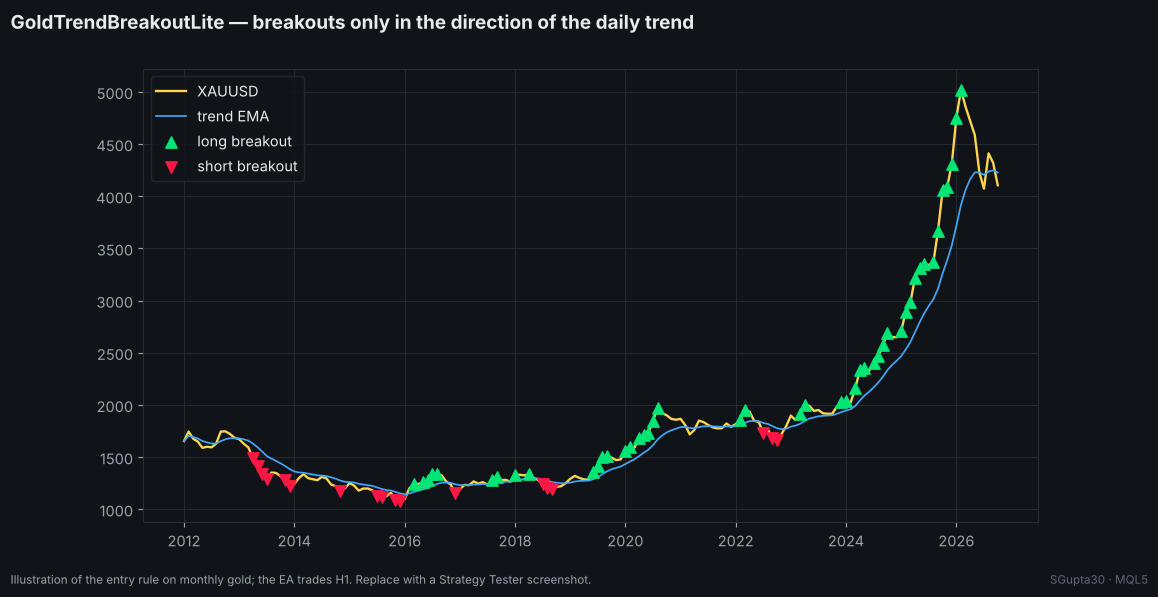
Strategy
| Element | Rule |
|---|---|
| Trend | D1 EMA(100) rising over the last 3 completed days → longs only; falling → shorts only |
| Entry | H1 close above the highest high of the previous 120 bars (long), or below the lowest low (short) |
| Stop | 3 × ATR(14) H1, sent with the order |
| Management | When an H1 bar closes at +1R, the stop moves to entry + 0.1R |
| Exit | Stop (initial or break-even). No take-profit: winners run |
| Size | Fixed lot, default 0.01 |
Flow
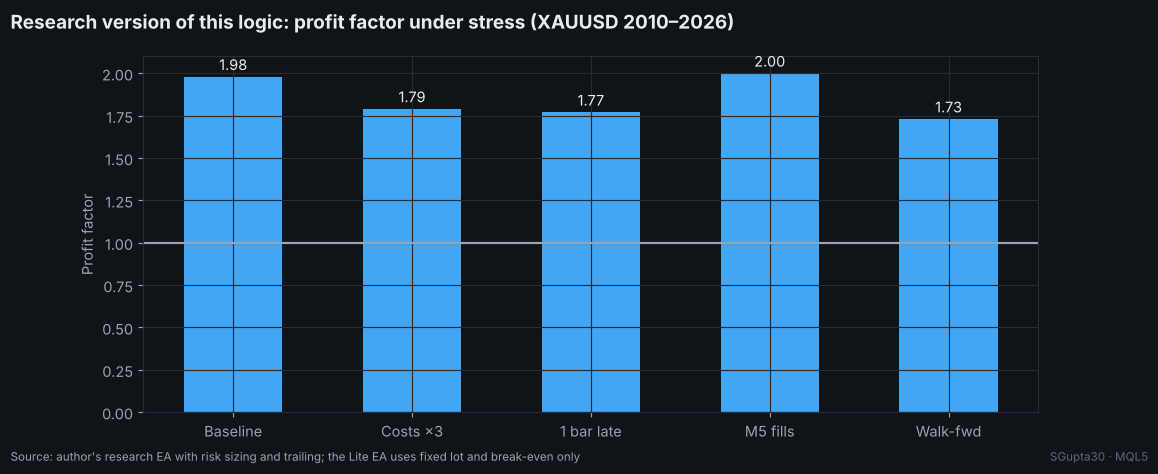
The EA makes one decision per closed H1 bar. With no position open, it checks the trend and the breakout. With a position open, it only checks break-even. Every order passes a hygiene gate: trade permissions, volume step and limits, stops level, free margin, and a 60-second cooldown after a failed order.
void OnTick()
  {
   datetime b=iTime(_Symbol,TF,0);
   if(b==0 || b==g_last_bar) return;   // once per closed H1 bar
   g_last_bar=b;
   ulong tk;
   if(MyPosition(tk)) ManageBE(tk);    // break-even only
   else               TryEntry();      // trend + Donchian breakout
  }
Background
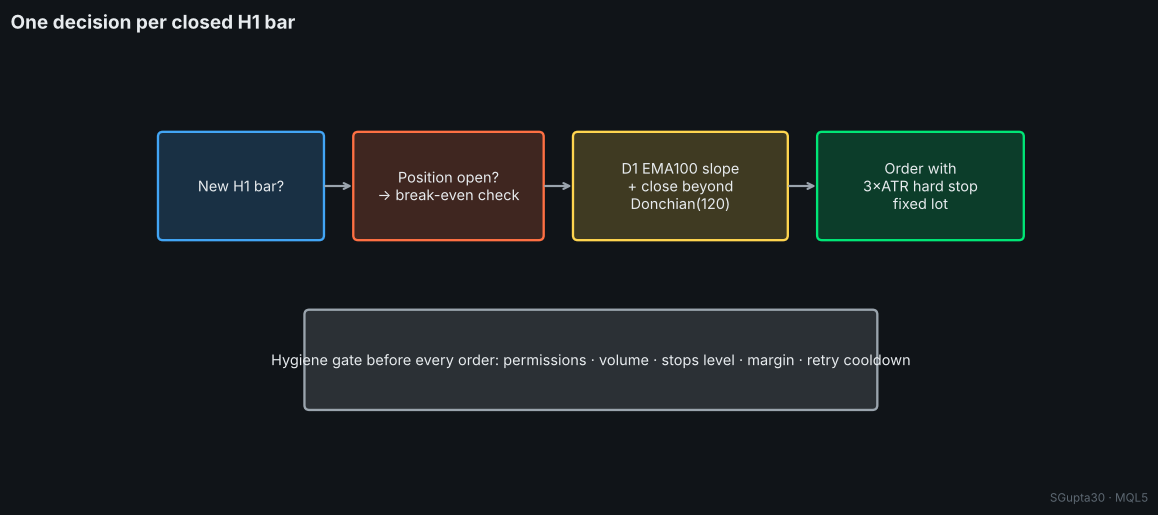
The logic follows the author's XAUUSD research. A research version with risk-based sizing and a trailing stop stayed profitable under triple costs, a one-bar-late entry, M5 fill checks and yearly walk-forward re-optimisation (2010–2026). This Lite version deliberately leaves out risk sizing, trailing and extra engines so the core idea is easy to read and modify.
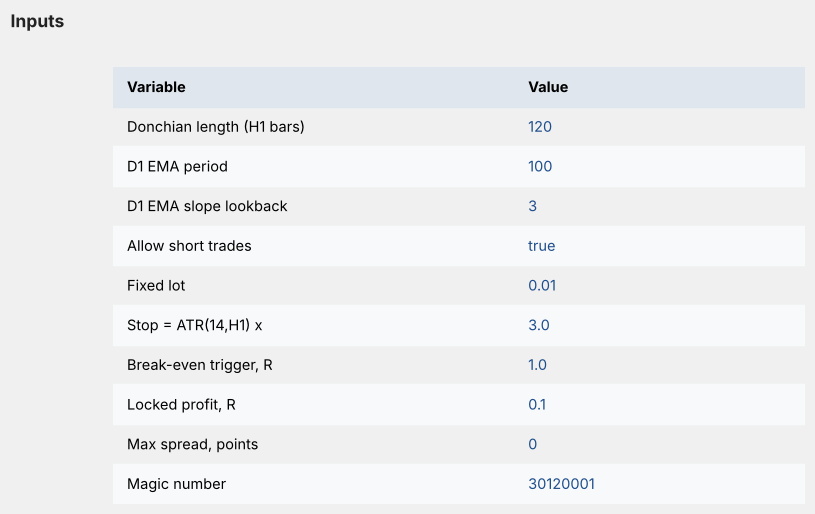
Inputs
Testing
- Symbol XAUUSD, any chart timeframe (the EA uses H1 internally). Model "Every tick based on real ticks" or "1 minute OHLC".
- Test from 2012 or earlier, so the 2013–2015 bear market is included.
- Expect a 30–40% win rate with a few large winners. That is normal for trend following.
- OnTester() returns net profit / relative balance drawdown for optimisation.
Disclaimer
Educational code. Trading leveraged gold carries a high level of risk, and past performance does not guarantee future results. Test on a demo account first.
Author: Shipra Gupta (SGupta30) · fully featured gold EAs (multi-engine, risk profiles, drawdown governor) are in the author's Market profile.
 Risk Lot Panel — drag the stop line, read the lot size for your risk percentage
On-chart position-size calculator. Drag the stop line (and optional target line) and the panel shows lots for your risk %, money at risk and reward:risk. Uses OrderCalcProfit, so it is correct for gold, indices, crypto, FX and any account currency.
Volatility Squeeze Scanner — Bollinger inside Keltner, with momentum histogram
Shows when volatility is compressed (Bollinger Bands inside the Keltner Channel) and which way it releases. Red dots = squeeze on, green = released, four-colour momentum histogram. Wilder ATR, closed bars, no repaint.
Hull Moving Average with Slope Color Change
Hull Moving Average that changes color with its slope: one color while the line rises, another while it falls, a neutral one when it is flat, with optional arrows at the turns.
Kaufman Adaptive Moving Average (KAMA) Ribbon
A ribbon of Kaufman Adaptive Moving Averages with growing Efficiency Ratio periods, drawn in a monochrome gradient, with an on-chart label showing whether the ribbon is bullish, bearish or mixed.