 MetaTrader 5
 Experts
 Indicateurs
 Scripts
 Bibliothèque
 Stockage
Voir comment télécharger gratuitement des robots de trading
Retrouvez-nous sur Twitter !
Rejoignez notre page de fans
Rejoignez notre page de fans
Vous avez aimé le script ? Essayez-le dans le terminal MetaTrader 5

Donchian Breakout Channel with ATR Trailing Stop - indicateur pour MetaTrader 5
Kenichiro Sakamoto

Je suis Kenichiro Sakamoto, le développeur de FXEA365, un studio qui conçoit des Expert Advisors transparents et basés sur des règles pour MetaTrader 5.
- Vues:
- 73
- Publié:
-
 Vous manquez des opportunités de trading :
- Applications de trading gratuites
- Plus de 8 000 signaux à copier
- Actualités économiques pour explorer les marchés financiers
Inscription Se connecterVous acceptez la politique du site Web et les conditions d'utilisation
Si vous n'avez pas de compte, veuillez vous inscrire -
 Besoin d'un robot ou d'un indicateur basé sur ce code ? Commandez-le sur Freelance
Aller sur Freelance

The indicator combines a Donchian channel with an ATR trailing stop line. The channel on each bar is the highest high and the lowest low of N_Channel bars that end two bars back, so the bar that is tested for a breakout is not part of its own channel. A breakout is registered when the previous bar closes above the upper line or below the lower line, and an arrow is placed on the bar that follows it.
After a breakout the trailing stop line starts at the close minus or plus Trail_ATR times the ATR. While no new breakout occurs, the line only moves in the breakout direction. When a close crosses the line, it disappears until the next breakout. The line is green after an upward breakout and red after a downward breakout. On every bar that follows a close outside the channel, the line is set again from the close of that bar.
The channel and the breakout test use closed bars only. The trailing stop value on the bar that is still forming follows its current close and becomes final when the bar closes. Arrows are placed 0.4 ATR below the low or above the high of the bar. The same arrow symbol is used for both directions, so the direction is read from its position relative to the bar.
Input parameters
- N_Channel - Donchian channel length in bars (default 40).
- Trail_ATR - distance of the trailing stop line as a multiple of the ATR (default 8.0).
- ATR_Period - ATR period (default 14).
- ShowArrows - show the breakout arrows (default true).
Buffers: 0 - upper channel, 1 - lower channel, 2 - trailing stop, 3 - trailing stop colour index (0 up, 1 down), 4 - breakout arrows. The empty value of the plots is 0. The indicator does not place or manage trades.
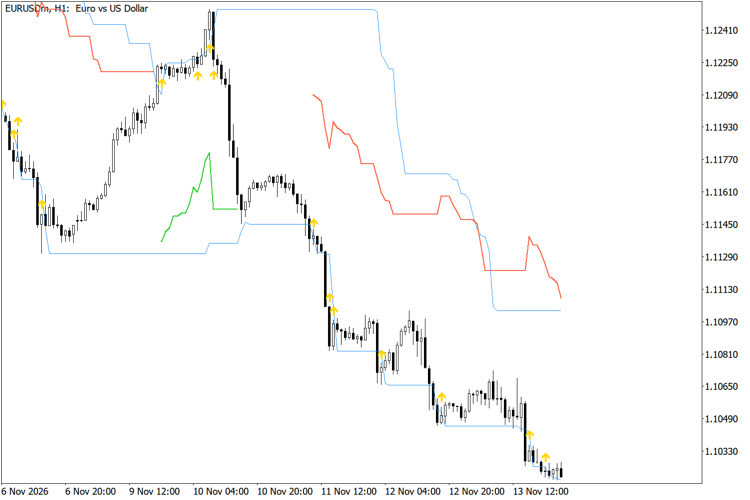
Donchian channel, breakout arrows and ATR trailing stop on EURUSD H1
Previous Day and Week Levels with Round Numbers
Draws the high and low of the previous day and the previous week plus round-number levels around the current price as horizontal lines.
True Trading Cost - Net Risk Reward Calculator for MT5
Free MT5 chart planner with draggable entry, stop and target levels, spread, risk-based lots, fees, estimated swap, break-even and net risk/reward. Indicator only; no orders.
Confirmed Swing Pivots with Trend MA
Marks swing highs and lows that are confirmed by a fixed number of bars on both sides and plots a simple moving average for trend context.
Bollinger Keltner Squeeze Release Arrows
Shows Bollinger bands and a Keltner channel on the chart, marks bars where the bands are inside the channel and draws an arrow when that squeeze ends.