 MetaTrader 5
 Experts
 Indicateurs
 Scripts
 Bibliothèque
 Stockage
Voir comment télécharger gratuitement des robots de trading
Retrouvez-nous sur Telegram !
Rejoignez notre page de fans
Rejoignez notre page de fans
Vous avez aimé le script ? Essayez-le dans le terminal MetaTrader 5

Fair Value Gap (FVG) Detector with Auto-Removal When Filled - indicateur pour MetaTrader 5

- Vues:
- 27
- Publié:
-
 Vous manquez des opportunités de trading :
- Applications de trading gratuites
- Plus de 8 000 signaux à copier
- Actualités économiques pour explorer les marchés financiers
Inscription Se connecterVous acceptez la politique du site Web et les conditions d'utilisation
Si vous n'avez pas de compte, veuillez vous inscrire -
 Besoin d'un robot ou d'un indicateur basé sur ce code ? Commandez-le sur Freelance
Aller sur Freelance

Fair Value Gap (FVG) Detector with Auto-Removal When Filled
The idea behind it
A Fair Value Gap is a price imbalance left by a fast move. It is formed by three consecutive candles: the first and the third candle do not overlap, so the range between them was crossed by the middle candle only, with no trading from both sides. Many traders expect price to come back to such a gap to "fill" it, and use it as a zone for entries, targets or as a sign of strong momentum.
- Bullish FVG - the Low of the third candle is above the High of the first candle. The gap is the range between these two prices.
- Bearish FVG - the High of the third candle is below the Low of the first candle. The gap is the range between these two prices.
The indicator finds these gaps on closed bars, draws a box for each one and checks every active gap against new prices. When the gap is filled (you choose what "filled" means), the box is deleted, so the chart shows only gaps that are still open.
The indicator keeps a list of active gaps. At the start it scans a limited number of bars; after that, each new closed bar is processed once and each tick only checks the active gaps against the current bar. The full history is never rescanned.
How to interpret it
- White box (default) - an unfilled bullish gap. It begins at the first candle of the pattern and extends to the right. Price returning from above into it is often watched as a possible support zone.
- Gray box (default) - an unfilled bearish gap, watched as a possible resistance zone when price returns from below.
- Box edges - the top and bottom of the box are the two prices of the gap. Hover over a box to see its type and size in points.
- Disappearing boxes - when the price fills a gap, its box is deleted (or turned into a gray dotted box that stops at the fill bar, if InpDeleteFilled is false).
- Large boxes show strong, one-sided moves; many open boxes on one side show a persistent imbalance.
The fill rule is set by InpFillMode:
- FVG_FILL_TOUCH - the gap is filled as soon as the price enters it.
- FVG_FILL_HALF - the gap is filled when the price reaches the middle of the gap.
- FVG_FILL_FULL - the gap is filled only when the price crosses the whole gap (the default).
The check uses High and Low prices (wicks) of the bars after the pattern.
External variables (inputs)
| Input | Default | Purpose |
|---|---|---|
| Detection | ||
| InpMinGapPoints | 10 | Minimum gap size in points; smaller gaps are ignored (0 = any gap) |
| InpLookbackBars | 500 | Number of bars scanned when the indicator starts (10 to 5000) |
| InpMaxZones | 30 | Maximum number of zones kept; the oldest is dropped first (1 to 200) |
| Fill rule | ||
| InpFillMode | FVG_FILL_FULL | When a gap is considered filled: FVG_FILL_TOUCH, FVG_FILL_HALF or FVG_FILL_FULL |
| InpDeleteFilled | true | Delete filled zones; if false they stay as gray dotted boxes that stop at the fill bar |
| InpFilledColor | clrDimGray | Color of filled zones when they are kept |
| Appearance | ||
| InpBullColor | clrWhite | Color of bullish gaps |
| InpBearColor | clrGray | Color of bearish gaps |
| InpZoneStyle | STYLE_DASH | Border style of the zones |
| InpZoneWidth | 1 | Border width (1 to 5) |
| InpFillZones | false | Fill the zones with color |
| InpExtendBars | 20 | Number of bars the zones extend to the right of the last bar (0 to 200) |
| Alerts | ||
| InpAlertNew | false | Show an alert when a new gap forms on a closed bar |
Recommended use
- Works on any symbol and timeframe. Gaps are more meaningful on liquid symbols and on M5 to H4 charts; on very low timeframes they are very frequent, so raise InpMinGapPoints.
- Choose the minimum size according to the symbol. 10 points is 1 pip on a 5-digit Forex symbol, which is very small; metals and indices need a much larger value in points.
- Gaps are detected on closed bars only, so a gap never appears and disappears while the third candle is still forming. A gap is created when its third candle closes.
- On the first start only the last InpLookbackBars bars are scanned, so very old gaps are not shown. Filled gaps are removed immediately, so after a restart the chart shows only gaps that are still open within the scanned history.
- When more than InpMaxZones gaps are open, the oldest ones are removed to keep the chart readable.
- Weekend and session gaps between two bars are not treated specially; they appear as a normal gap when the pattern conditions are met.
- A gap is a price-action concept, not a trading signal. Use it together with trend, structure or higher-timeframe context.
- All objects use the prefix Fvg_ and are removed when the indicator is deleted from the chart. Do not attach two copies to the same chart because they would share object names.
- It is a chart indicator only and does not trade, so it works the same on netting and hedging accounts.
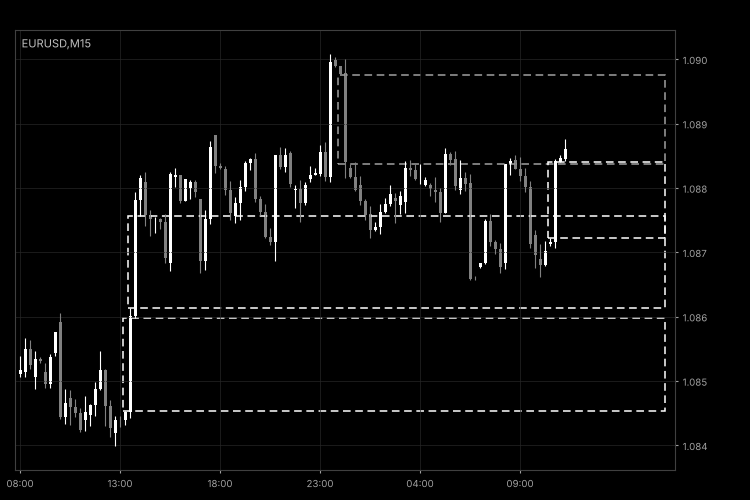
Fig. 1. FvgDetector on an M15 chart with default settings: open bullish gaps in white and a bearish gap in gray (black and white image per Code Base guidelines).
Index Gap Marker – daily opening gaps and fill status
Shows the daily opening gaps for stock indices and indicates whether each one has been filled.
News Event Marker
Marks built-in economic calendar events on the chart with time lines, optional windows, labels, a panel and alerts.
Order Block Marker with Mitigation Tracking
Marks bullish and bearish order blocks (the last opposite candle before a strong impulse) and tracks their state: fresh, mitigated when price returns, and removed when broken.
Fair Value Gap (FVG) Detector with Auto-Removal When Filled
Detects bullish and bearish Fair Value Gaps (three-candle price imbalances), draws them as boxes extending to the right and automatically removes each box once the price fills the gap.