 MetaTrader 5
 Experts
 Indicateurs
 Scripts
 Bibliothèque
 Stockage
Voir comment télécharger gratuitement des robots de trading
Retrouvez-nous sur Twitter !
Rejoignez notre page de fans
Rejoignez notre page de fans
Vous avez aimé le script ? Essayez-le dans le terminal MetaTrader 5

Supertrend Indicator with Trend Color Change - indicateur pour MetaTrader 5

- Vues:
- 60
- Publié:
-
 Vous manquez des opportunités de trading :
- Applications de trading gratuites
- Plus de 8 000 signaux à copier
- Actualités économiques pour explorer les marchés financiers
Inscription Se connecterVous acceptez la politique du site Web et les conditions d'utilisation
Si vous n'avez pas de compte, veuillez vous inscrire -
 Besoin d'un robot ou d'un indicateur basé sur ce code ? Commandez-le sur Freelance
Aller sur Freelance

Supertrend Indicator with Trend Color Change
The idea behind it
Supertrend is a popular trend-following tool that works as a trailing stop. It builds two bands around the price at a distance of multiplier x ATR and follows only one of them at a time: the lower band in an up-trend and the upper band in a down-trend. A band can move only in the direction of the trend, so the line trails the price and does not step back.
When the close crosses the active line, the trend is considered changed: the indicator switches to the opposite band, the line jumps to the other side of the price and its color changes. Because the distance depends on ATR, the indicator adapts to volatility.
The ATR (Wilder smoothing) is calculated inside the indicator, so no indicator handles are needed. On each tick only the last bar is recalculated, and the whole history is processed only once.
How to interpret it
- Up-trend line (solid, white by default) - drawn below the price. It acts as dynamic support and as a trailing stop level for long positions.
- Down-trend line (dashed, gray by default) - drawn above the price. It acts as dynamic resistance and as a trailing stop level for short positions.
- Color change - the line changes color and moves to the other side of the price when a candle closes beyond it. This is the trend change signal.
- Buy arrow - drawn on the bar where the trend changes from down to up.
- Sell arrow - drawn on the bar where the trend changes from up to down.
- Info label (top-left corner) - shows the settings and the current trend direction (UP or DOWN).
Supertrend works best in trending markets. In a sideways market it can change direction often and produce false signals, so it is best used with a higher-timeframe filter or other confirmation.
External variables (inputs)
| Input | Default | Purpose |
|---|---|---|
| Supertrend | ||
| InpAtrPeriod | 10 | ATR period (1 and above) |
| InpMultiplier | 3.0 | ATR multiplier; a larger value gives wider bands and fewer signals (greater than 0) |
| InpPriceSource | ST_SRC_MEDIAN | Price used as the center of the bands: ST_SRC_MEDIAN (High+Low)/2 or ST_SRC_CLOSE |
| Appearance | ||
| InpUpColor | clrWhite | Color of the line in an up-trend |
| InpDownColor | clrGray | Color of the line in a down-trend |
| InpUpStyle | STYLE_SOLID | Line style in an up-trend |
| InpDownStyle | STYLE_DASH | Line style in a down-trend |
| InpLineWidth | 1 | Line width (1 to 5). Dash and dot styles are drawn only with width 1 |
| Signals | ||
| InpShowArrows | true | Show arrows when the trend changes |
| InpBuyColor | clrWhite | Color of the buy arrow |
| InpSellColor | clrSilver | Color of the sell arrow |
| InpAlerts | false | Show an alert when a closed bar changes the trend |
| Info label | ||
| InpShowInfo | true | Show the info label with the current trend |
| InpInfoColor | clrWhite | Color of the info label |
Recommended use
- Works on any symbol and timeframe. The defaults (ATR 10, multiplier 3.0) are a common starting point; use a smaller multiplier for faster, more sensitive signals and a larger one for fewer, more reliable ones.
- Values and arrows of closed bars do not change. On the current, still forming bar the line and an arrow can appear or disappear, because the signal depends on the current close. Wait for the bar to close before acting.
- Alerts are generated only for the last closed bar, once per bar, and never for historical signals when the indicator is attached.
- Do not use the arrows as a complete trading system: sideways markets produce whipsaws. The line itself is most useful as a trailing stop.
- The indicator needs more bars than the ATR period to start drawing.
- It is a chart indicator only and does not trade, so it works the same on netting and hedging accounts.
- The info label uses the prefix Supertrend_ and is removed when the indicator is deleted from the chart.
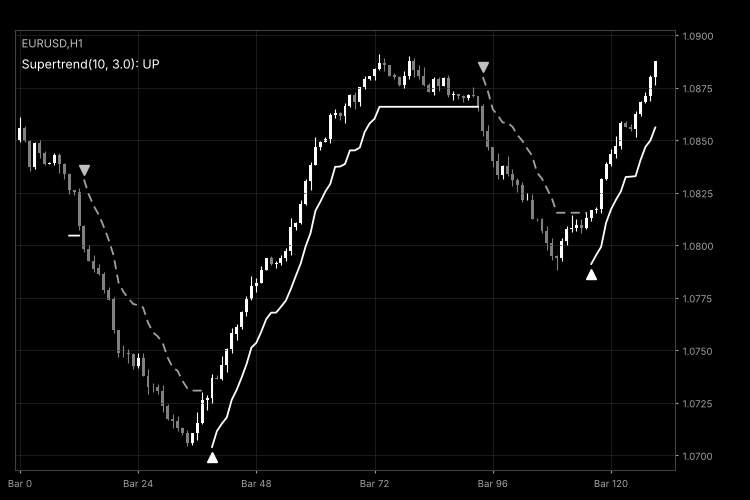
Fig. 1. SupertrendColor on an H1 chart with default settings (black and white image per Code Base guidelines).
Candle Countdown Timer and Spread Display on Chart
Shows the time left until the current candle closes and the current spread in a corner of the chart. The countdown updates every second, even when no new ticks arrive.
ATR Dynamic Support and Resistance Bands
Dynamic support and resistance bands built from a moving average and the Average True Range (ATR). The bands widen when volatility rises and narrow when it falls.
Daily Open Line with Distance in Points
Draws the daily open price as a horizontal line and shows, in points, how far the current price is from today's open. The label changes color depending on whether the price is above or below the open.
MACD Signals
Indicator edition for new platform.