 MetaTrader 5
 Experts
 Indicateurs
 Scripts
 Bibliothèque
 Stockage
Voir comment télécharger gratuitement des robots de trading
Retrouvez-nous sur Telegram !
Rejoignez notre page de fans
Rejoignez notre page de fans
Vous avez aimé le script ? Essayez-le dans le terminal MetaTrader 5

Previous Day High, Low and Close Levels - indicateur pour MetaTrader 5

- Vues:
- 86
- Note:
- Publié:
-
 Vous manquez des opportunités de trading :
- Applications de trading gratuites
- Plus de 8 000 signaux à copier
- Actualités économiques pour explorer les marchés financiers
Inscription Se connecterVous acceptez la politique du site Web et les conditions d'utilisation
Si vous n'avez pas de compte, veuillez vous inscrire -
 Besoin d'un robot ou d'un indicateur basé sur ce code ? Commandez-le sur Freelance
Aller sur Freelance

Previous Day High, Low and Close Levels
The idea behind it
Many traders treat yesterday's High, Low and Close as reference prices. The High and Low mark the edges of the previous day's range, where price was accepted or rejected, and the Close shows where the market settled. Today's price often reacts around these levels, so they are useful for spotting breakouts, reversals and targets.
The indicator reads the daily bars of the symbol and draws the levels for you. It does not use indicator buffers; it works with chart objects. Levels are rebuilt only when a new daily bar appears, not on every tick, so the indicator is very light on resources.
How to interpret it
- PDH (Previous Day High) - dashed line at the highest price of the previous day. Acts as potential resistance or a breakout level.
- PDL (Previous Day Low) - dashed line at the lowest price of the previous day. Acts as potential support or a breakdown level.
- PDC (Previous Day Close) - dotted line at the closing price of the previous day. Works as a "fair value" reference and a common intraday magnet.
- Today's levels are drawn from the start of the current day and can be extended to the right.
- Historical levels (when InpDaysBack is greater than 1) are drawn as short segments, each one covering the day on which it was active, so you can see how price reacted to them in the past.
- Labels show the name of the level and its price at the left end of each line.
External variables (inputs)
| Input | Default | Purpose |
|---|---|---|
| Levels | ||
| InpShowHigh | true | Show the previous day High |
| InpShowLow | true | Show the previous day Low |
| InpShowClose | true | Show the previous day Close |
| InpDaysBack | 3 | Number of days to draw (1 to 100). 1 draws only today's levels |
| InpExtendRight | true | Extend today's levels to the right of the last bar |
| Lines | ||
| InpHighColor | clrWhite | Color of the High line |
| InpLowColor | clrSilver | Color of the Low line |
| InpCloseColor | clrGray | Color of the Close line |
| InpLineStyle | STYLE_DASH | Line style of the High and Low levels |
| InpCloseStyle | STYLE_DOT | Line style of the Close level |
| InpLineWidth | 1 | Line width (1 to 5) |
| Labels | ||
| InpShowLabels | true | Show text labels (PDH, PDL, PDC) with the price |
| InpLabelColor | clrWhite | Color of the labels |
| InpLabelSize | 8 | Font size of the labels |
Recommended use
- Attach it to any intraday timeframe (M1 to H4). On D1 and higher timeframes it also works, but the segments become very short.
- Works on any symbol: Forex, metals, indices, stocks and crypto CFDs.
- The "day" is defined by the daily bars of your broker's server time. Brokers with different server time zones or session start times will show slightly different levels; this is normal.
- On Monday the previous day is the last trading day (usually Friday), because the indicator uses the previous existing daily bar.
- If the daily history is not loaded yet, the indicator retries automatically on the next tick.
- All objects are created with the prefix PrevDayLvl_ and are removed when the indicator is deleted from the chart. Do not attach two copies to the same chart, because they would share object names.
- Works on both netting and hedging accounts, since it does not trade and only draws on the chart.
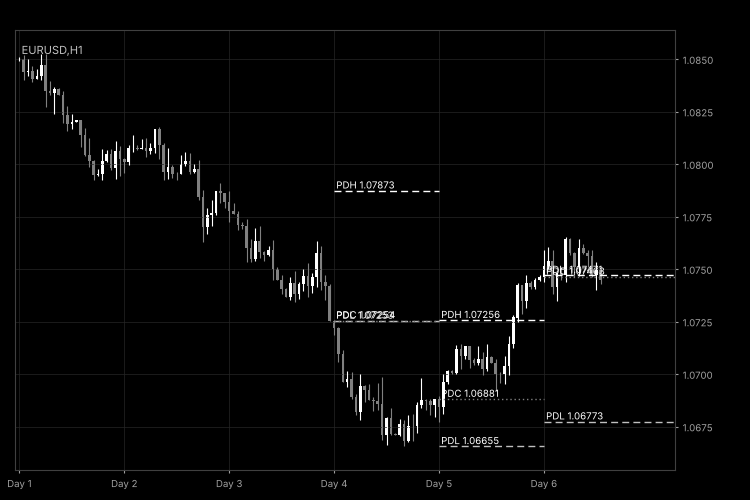
Fig. 1. PrevDayLevels on an H1 chart with InpDaysBack = 3 (black and white image per Code Base guidelines).
Position Tool - TradingView-style Long/Short position calculator
TradingView-style Long/Short position tool for MT5: drag the Entry, Stop and Target lines and get lot size, risk, reward, R:R and margin instantly.
MA Toolkit
MA Toolkit: a compact moving average indicator written from scratch. Choose SMA, EMA or LWMA for a fast and a slow line, see the fast line colored by its slope, and get optional crossover arrows, alerts and an info panel.
 Risk Drift Audit: the Real Risk of Every Past Trade
Shows the risk every past trade really took (the loss at its stop loss as a % of the balance at entry) and how far a fixed lot drifted from the tested risk. Read-only.
MACD Signals
Indicator edition for new platform.