 MetaTrader 5
 Experts
 Indicateurs
 Scripts
 Bibliothèque
 Stockage
Rejoignez notre page de fans

Multi-Indicator Divergence Detector - indicateur pour MetaTrader 5

- Vues:
- 180
- Note:
- Publié:
-
 Vous manquez des opportunités de trading :
- Applications de trading gratuites
- Plus de 8 000 signaux à copier
- Actualités économiques pour explorer les marchés financiers
Inscription Se connecterVous acceptez la politique du site Web et les conditions d'utilisation
Si vous n'avez pas de compte, veuillez vous inscrire -
 Besoin d'un robot ou d'un indicateur basé sur ce code ? Commandez-le sur Freelance
Aller sur Freelance
Besoin d'un robot ou d'un indicateur basé sur ce code ? Commandez-le sur Freelance
Aller sur Freelance
One oscillator disagreeing with price is a hint. Four of them disagreeing at the same swing is worth a closer look, and that is exactly what this indicator puts on the chart. On every bar it checks ten oscillators against the latest price pivots, draws each divergence on the price itself and labels the bar with a box that names the oscillators in agreement and counts them.
All ten are calculated inside the indicator with their classic settings: MACD (12, 26, 9) and its histogram, RSI 14, Stochastic 14 smoothed over 3 bars, CCI 10, Momentum 10, On-Balance Volume, VWMACD (12, 26), Chaikin Money Flow 21 and Money Flow Index 14. None of them depends on the terminal's built-in indicators, and each one can be switched off on its own. The volume-based four (OBV, VWMACD, CMF and MFI) use tick volume.
Reading the chart
- Boxes: a bullish box sits under the signal bar and points up; a bearish box sits above it and points down. The box lists every oscillator that diverges on that bar, and the number at the bottom is the count. A box reading Hist, Stoch, MOM, VWMACD and 4 means four separate oscillators confirm the same turn; a box with a single name is one vote.
- Lines: each divergence is drawn on price, from the earlier pivot to the signal. Regular divergences get a solid line, hidden ones a dashed line, and oscillators that point to the same pivot share a single line instead of stacking several.
- Colors: amber for bullish regular, blue for bearish regular, green for bullish hidden and red for bearish hidden. The box takes the color of its divergence, and every color can be changed.
Regular divergence is the classic reversal setup: price makes a lower low while the oscillator makes a higher low, or price makes a higher high while the oscillator makes a lower high. Hidden divergence is the continuation setup: price holds a higher low while the oscillator dips to a lower one, or the mirror image at the tops. Search for either one or for both.
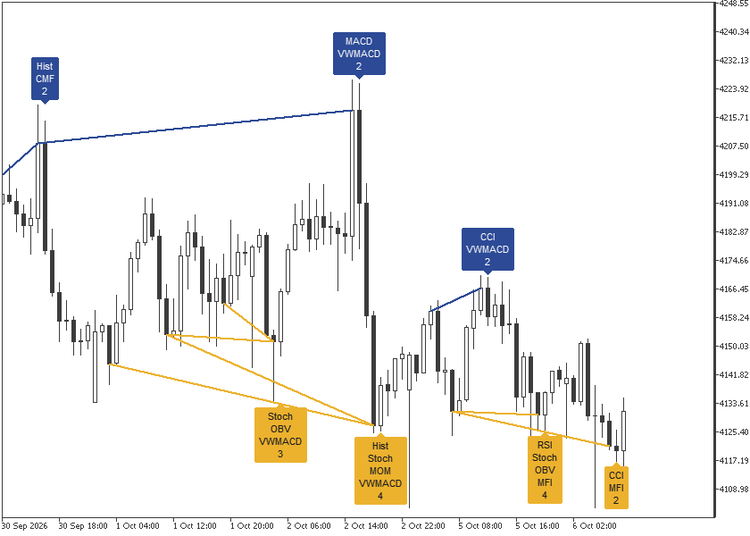
What has to happen before a box is drawn
Pivots are tops and bottoms with five bars on each side, read on the close or on the high and low. For every oscillator, the signal bar is compared with up to ten of the latest pivots inside the last 100 bars, skipping any pivot five bars away or closer. A pair only counts when the path between the two points is clean: no bar in between may cross the straight line that joins them, neither on the oscillator nor on the close. A divergence that was already broken halfway never reaches the chart.
The "minimum divergences on a bar" setting turns the box count into a filter. At 1 every divergence is shown; at 3, a bar needs three or more before anything is drawn, which leaves only the confluence on the chart.
Closed bars, fixed history
With "wait for the next bar to confirm" on, the default, only closed bars are read. The divergence is measured on the bar before, and the bar that just closed has to show the turn, with the oscillator or the close moving back in the signal's direction. The box appears when that bar closes, and the calculation of past bars never changes. Until the next pivot forms on the same side, a newer divergence replaces the previous one, so each swing keeps its latest signal. With confirmation off, the bar in progress is previewed and updated tick by tick.
Alerts
Bullish and bearish alerts are set apart, each to off, regular, hidden or either of them. An alert fires once per bar and side, at the close of the bar when confirmation is on, with the symbol, the timeframe and the kind of divergence in the message. A single switch also sends it as a push notification to the MetaTrader mobile app.
Inputs
- Pivots: pivot period, the bars on each side of a top or bottom (default 5), and the pivot source, close or high and low. On high and low, pivots and line ends sit on the wicks.
- Divergence: divergence type (regular by default, hidden, or both), minimum divergences on a bar (1), pivots checked back (10, up to 20), bars checked back (100, from 30 to 200), wait for the next bar to confirm (on), keep only the latest divergence (off) and bars scanned on load (2000).
- Display: oscillator names in full, as a first letter or hidden, the divergence count, the divergence lines, H and L marks on every pivot (off) and the 50 and 200 simple moving averages (off). With names and count both hidden, the chart shows the lines alone.
- Oscillators: one switch for each of the ten, all on by default.
- Colors: one color for each kind of divergence, plus the text color of bullish and bearish boxes.
- Alerts: bullish divergence alert, bearish divergence alert (both off by default) and the push notification switch.
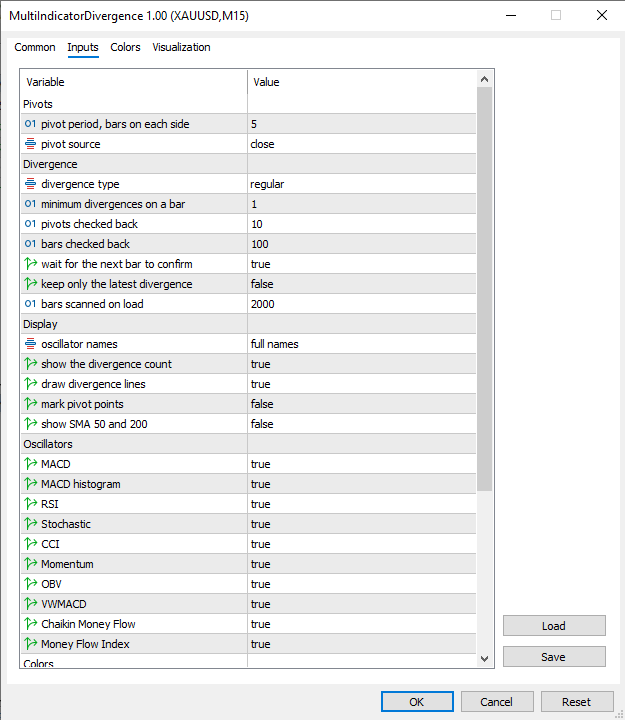
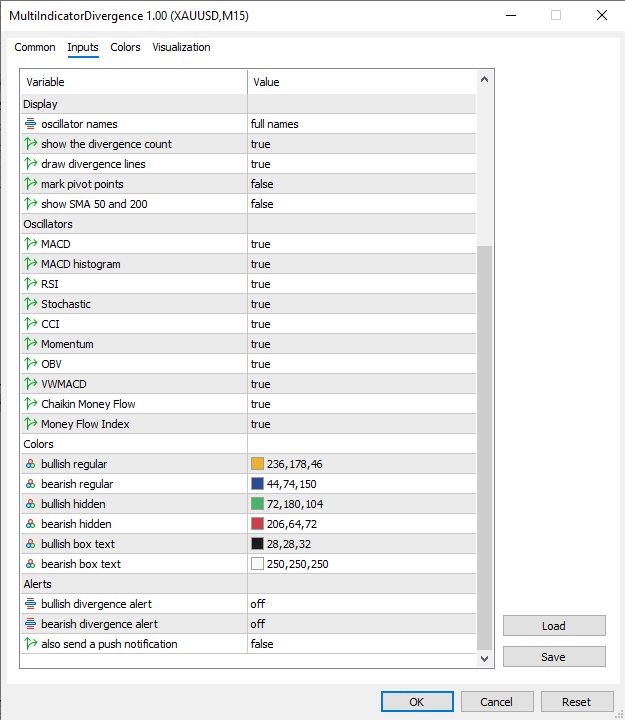
Works on any symbol and timeframe, and removing the indicator clears everything it drew.
Session Levels - Asian range, PDH/PDL, VWAP, swings and round numbers
Session Levels draws the reference levels intraday traders watch most: Asian range, London and New York sessions, previous day and week high/low, daily VWAP, swing points and round numbers. Hover any level to read what it is and why it matters. Optional alerts when price breaks the Asian range or the previous day high/low.
CajasTF – Integrated Multi-Timeframe Side Panel for MT5
Real-time multi-timeframe side panel mini-chart with smart color matching, independent price scale, and candle countdown timer.
 Server Clock Check
Measures how far your PC clock is from the trade server's clock, from the server time stamped on live ticks, and tells you how to fix it.
Prop Daily Loss Meter
Shows how much of the daily loss limit of a prop firm account is already used, and how much is left. Read-only indicator.