 MetaTrader 5
 Experts
 Indicateurs
 Scripts
 Bibliothèque
 Stockage
Rejoignez notre page de fans

Tick Integrity Auditor - expert pour MetaTrader 5

- Vues:
- 206
- Note:
- Publié:
-
 Vous manquez des opportunités de trading :
- Applications de trading gratuites
- Plus de 8 000 signaux à copier
- Actualités économiques pour explorer les marchés financiers
Inscription Se connecterVous acceptez la politique du site Web et les conditions d'utilisation
Si vous n'avez pas de compte, veuillez vous inscrire -
 Besoin d'un robot ou d'un indicateur basé sur ce code ? Commandez-le sur Freelance
Aller sur Freelance
Besoin d'un robot ou d'un indicateur basé sur ce code ? Commandez-le sur Freelance
Aller sur Freelance
A backtest in "Every tick based on real ticks" mode does not trade on the candles you see. It replays the tick history the terminal holds, one quote at a time, and every stop, every pending order and every spread filter is decided on those ticks. This tool audits that tick history: it reads the ticks of the last few days for one symbol, a list, or the whole Market Watch, and counts five classes of problem in them — impossible quotes, broken timestamps, one-tick price reversals measured in multiples of the median spread, silences inside the broker's own quote sessions, and minutes where the ticks and the M1 bars disagree.
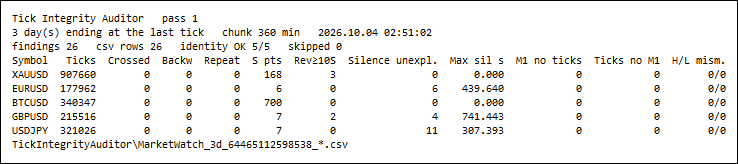
Five Market Watch symbols, three days each, one pass at 02:51:02 server time on a Sunday, 1.3 s. S pts is the median spread in points, Rev≥10S counts one-tick reversals of at least ten median spreads, Silence unexpl. counts gaps of more than 60 s that the broker's own session table does not explain, and the last three columns are the tick-against-M1 checks. Shot at panel font size 4 to fit the page; the default is 8.
The problem
A candle is a summary. It keeps four prices of a minute and throws away the order in which they came, so a quote that dropped two dollars and came straight back shows, on the chart, as a wick at best — and as nothing at all when the rest of the minute already covers that range. The tester does not see the candle. It sees the quote, and a stop-loss sitting inside that range is filled on it.
Nobody reads ticks by eye because there are too many of them: on the gold symbol measured below the terminal holds roughly 300 000 ticks per trading day. So the questions that decide whether a real-ticks backtest is a measurement or a fiction usually go unasked. Are there quotes where the ask is below the bid? Does time ever run backwards? Are there stretches of a session with no tick at all? Do the M1 bars the indicators read agree with the ticks the tester trades?
This tool asks them in under two seconds for five symbols and three days, and answers with counts, millisecond timestamps and CSV rows, not with a quality percentage.
What it measures
Five checks over the window [last tick - N days, last tick), both ends floored to the minute. The window ends at the symbol's newest tick, not at the wall clock, so a run on a Sunday audits the last days of the week that just closed. Every definition below is exact, and every finding is written to CSV with its millisecond timestamp, so the report can be recounted instead of believed.
- Quotes (K1). A tick with bid <= 0 or ask <= 0; a crossed quote, ask < bid; a locked quote, ask == bid. Locked quotes are counted but are not findings — some feeds legitimately touch.
- Timestamps (K2). A tick whose time_msc is earlier than the previous tick's (backwards); a repeat, same time_msc, same bid and same ask as the previous tick; and a tick whose time field disagrees with time_msc / 1000.
- One-tick reversals (K3). On the sequence of ticks that change the chart price, three consecutive prices p0, p1, p2 form a reversal when the move into p1 and the move out of it have opposite signs and p2 lands back within a quarter of the move from p0. The size is the smaller of the two moves, in points, and it is reported in multiples of S, the symbol's own median spread over the window: counts at 2, 5, 10 and 20 spreads, and every reversal of at least InpReversalMult spreads (default 10) is a finding. Ten spreads on gold and ten spreads on EURUSD are then the same thing.
- Silences (K4). Two consecutive ticks more than InpSilenceSeconds apart (default 60). The tool asks SymbolInfoSessionQuote about every minute of the silence and about its last second: if any of them falls outside the quote sessions, the silence is explained (a daily break, a weekend); if all of them are inside, it is unexplained and it is a finding. A symbol with no session record at all is reported as unclassified, never as explained.
- Ticks against M1 bars (K5). For every minute of the window, the highest and lowest chart price over every tick of that minute are compared with the high and low of the broker's M1 bar. Every tick, not only the ones that moved the price: a minute's first tick often changes only the ask, and its bid is still the bar's open. Counting only price-changing ticks produced 144 false mismatches on one day of EURUSD while this tool was being built; counting every tick produced none. An M1 bar with no tick under it is a finding — that is a minute in which the Strategy Tester has to invent ticks — and so is a minute with ticks but no bar, and a minute whose high or low differs by more than InpBarTolPoints.
The tool checks its own arithmetic and prints both sides for every symbol: the number of findings must equal the sum of the eleven finding counters, and the number of rows written to the findings file for that symbol must equal both.
Measured example
Five Market Watch symbols of one Exness demo terminal (build 6230), three days each, audited in one pass on 2026.10.04 at 02:51 server time. That is a Sunday, so the forex and gold windows end at Friday's last tick, while BTCUSD, which trades at the weekend, ends at the moment of the run. 1 962 511 ticks were read in 1 297 ms.
| symbol | window (server time) | ticks | S, points | reversals >= 2 S / 5 S / 10 S | largest reversal, points | silences > 60 s: explained / unexplained | unexplained seconds (longest) | M1 bars / minutes with ticks | M1 mismatches | findings |
|---|---|---|---|---|---|---|---|---|---|---|
| XAUUSD | 09.29 20:57 - 10.02 20:57 | 907 660 | 168 | 532 / 16 / 3 | 2 400 | 3 / 0 | 0 | 4 134 / 4 134 | 0 | 3 |
| EURUSD | 09.29 20:58 - 10.02 20:58 | 177 962 | 6 | 13 / 2 / 0 | 58 | 0 / 6 | 1 514.073 (439.640) | 4 299 / 4 299 | 0 | 6 |
| GBPUSD | 09.29 20:58 - 10.02 20:58 | 215 516 | 7 | 14 / 8 / 2 | 75 | 0 / 4 | 1 602.183 (741.443) | 4 295 / 4 295 | 0 | 6 |
| USDJPY | 09.29 20:58 - 10.02 20:58 | 321 026 | 7 | 124 / 23 / 0 | 67 | 0 / 11 | 1 397.153 (307.393) | 4 305 / 4 305 | 0 | 11 |
| BTCUSD | 10.01 02:51 - 10.04 02:51 | 340 347 | 700 | 34 / 0 / 0 | 3 084 | 0 / 0 | 0 | 4 320 / 4 320 | 0 | 0 |
What is clean is most of it. Across 1 962 511 ticks there is no quote at or below zero, no crossed and no locked quote, no tick that goes back in time, no repeated tick and no tick whose two time fields disagree. Every one of the 21 353 M1 bars has ticks under it, every minute with ticks has a bar, and the bar's high and low equal the extreme bid of its ticks to the last point. On this server the bars the indicators read and the ticks the tester replays agree on every high and low. That is worth knowing, and it is not something to assume about a server that has not been measured.
The session table and the feed disagree on every evening of the window. For EURUSD, GBPUSD and USDJPY this broker declares one quote session from 00:00 to 24:00 on Monday to Thursday. The ticks say otherwise. On each of the three evenings the last tick before the daily rollover arrives between 20:59:52 and 20:59:58 and the next one between 21:04:28 and 21:12:18: 4.5 to 12.4 minutes with no quote at all, inside what the broker calls an open session. The longest is GBPUSD on 2026.10.01, 741.443 seconds, from 20:59:57.249 to 21:12:18.692. USDJPY shows a second pattern after the rollover of 2026.09.29: between 21:15 and 21:29 it goes silent for just over a minute seven times, 60.001 to 60.007 seconds each, which is where seven of its eleven findings come from. Gold, on the same server, declares a break from 20:58 to 22:00, so its three rollover silences are explained and are not findings.
This matters wherever an Expert Advisor trusts the session table to tell it the market is open. The bars agree with the ticks — there are no M1 bars in those minutes either, so a backtest sees the same gap — but an EA that reads the quote sessions to decide when to act believes the market is quoting at 21:02, and on none of the nine symbol-evenings above was it.
The largest reversals all sit on a US data release. All five reversals of at least ten median spreads — three on XAUUSD, two on GBPUSD — fall within eight seconds after 12:30 server time on 2026.09.30 and 2026.10.02. The terminal's own economic calendar lists US releases at 12:30 on both days. The largest, on gold, is three ticks inside one millisecond:
symbol;check;time_msc;time;value1;value2;detail XAUUSD;reversal;1790771407860;2026.09.30 12:30:07.860;2400;141;p0 4198.315 p1 4195.774 p2 4198.174 d1 -2541 d2 2400 S 168
The bid falls 2.541 and comes back 2.400, ending 0.141 short of where it started (value2), within the same millisecond. That is 14.3 median spreads. On the M1 chart it is invisible: the 12:30 bar runs from 4192.325 to 4209.799, so the candle carries no trace of it. In a real-ticks test, a sell stop or a stop-loss resting between 4195.774 and 4198.174 at that moment — a trailing stop following the rally, for example — is triggered by that one tick.

XAUUSD, 29 consecutive ticks around the largest reversal of the run, in arrival order. The three ticks stamped 12:30:07.860 go 4198.315, 4195.774, 4198.174. The other 26 ticks, from 12:30:07.610 to 12:30:08.663, are a fast but ordinary news move spanning 7.7 dollars. Drawn from ticks read through MetaTrader 5's own MCP server, not from the tool's files.
Whether such a tick is a bad print or a real trade in a thin book cannot be decided from the data alone, and the tool does not try. What it does is count them, size them against the symbol's own spread and give you the timestamp, so you can find out whether the result of a backtest depends on a handful of them. The distribution is steep: on gold, 532 reversals of at least two spreads, 16 of at least five and 3 of at least ten.
Verifying the report independently
Every counter in the table above was recomputed by something that shares no code with the tool and takes its ticks and bars from an interface the tool never calls. A Python script reads from the EA's files only the window, the symbol's point and chart mode, the four thresholds and the session table, and pulls the raw ticks and M1 bars itself, through MetaTrader 5's built-in MCP server (get_chart_ticks_history, get_chart_history). It then applies the definitions above and compares.
For the run in the table: 1 962 511 ticks pulled, 31 summary fields per symbol plus the 24-hour table of each symbol (72 cells per symbol), 0 mismatches. The 31 fields are 29 counters, the row count of the findings file and the identity. Two deliberately planted errors — one counter raised by 1, one hourly tick count raised by 1 — were both reported. One field is not recounted: the time-field check needs the time member of MqlTick, which the MCP rows do not carry, so its zero rests on the EA alone. The script also cannot check a symbol whose chart is built on Last prices; none of the five is.
The script's own definitions are pinned by a test on 13 hand-made ticks with every expected count worked out on paper — one repeat, one reversal of 49 points, one tick out of order, one crossed and one locked quote, one quote with a zero ask, two silences inside a session and one across a session break — plus a two-tick case in which only the last second of a silence falls outside the session. 45 assertions, counted by the test itself. That the EA applies the same predicates is established by the recount on real data, not by that test.
A zero confirmed on both sides is only a zero. No crossed, backwards, repeated or non-positive tick and no M1 mismatch occurred in any run behind this article, so those branches are defined and recounted but were never seen firing on this server.
How to use it
- Attach it to any chart; the chart's own symbol is audited unless InpSymbols lists others or is * (Market Watch). Read the journal or the panel.
- Set InpDays to cover the period of the backtest you care about. The window always ends at the last tick the terminal holds.
- Look at unexplained silences first and read their timestamps in the findings file. Silences that repeat at the same minute every day are the server's schedule disagreeing with its session table; scattered ones are worth checking against your own terminal's connection log.
- Look at the reversals of ten spreads and more, then at the 2 S and 5 S counts for the shape of the distribution. If a strategy's stops are within a few spreads of price, re-run its backtest with the flagged minutes excluded and compare.
- Any M1 mismatch or M1 bar without ticks is a minute in which the tester and the chart disagree, or in which the tester invents prices. Those deserve a question to the broker.
- Re-run it after changing broker or server: tick quality is a property of one terminal's history at one time, not of a symbol.
Inputs
| input | default | meaning |
|---|---|---|
| InpSymbols | "" | Symbols: empty = chart symbol, * = Market Watch, else CSV list |
| InpDays | 3 | Days of tick history to audit (ending at the last tick) |
| InpCheckQuotes | true | K1: nonpositive / crossed / locked quotes |
| InpCheckTimes | true | K2: backwards, repeated and inconsistent timestamps |
| InpCheckReversals | true | K3: one-tick price reversals (spikes) |
| InpReversalMult | 10.0 | K3: flag reversals of at least this many median spreads |
| InpReversalReturnFrac | 0.25 | K3: max distance back to the start, as a share of the move |
| InpCheckSilences | true | K4: gaps between ticks against the quote sessions |
| InpSilenceSeconds | 60 | K4: a silence is a gap longer than this, seconds |
| InpCheckBars | true | K5: compare tick high/low with the M1 bars |
| InpBarTolPoints | 0 | K5: ignore high/low deviations up to this many points |
| InpChunkMinutes | 360 | Ticks are read in chunks of this many minutes |
| InpMaxExamples | 5 | Journal: example findings printed per check |
| InpWriteCsv | true | Write summary, sessions, hours and findings CSV files |
| InpShowPanel | true | Draw the result table on the chart |
| InpPanelCorner | CORNER_LEFT_UPPER | Panel corner |
| InpPanelFontSize | 8 | Panel font size |
| InpPanelX | 10 | Panel X offset, px |
| InpPanelY | 18 | Panel Y offset, px |
| InpRefreshMinutes | 0 | Re-audit every N minutes (0 = audit once) |
Output files
All files are written to MQL5\Files\TickIntegrityAuditor\, ;-separated with a header row, with the prefix <symbols>_<days>d_<chart id>, so two instances never overwrite each other.
- <prefix>_<symbol>_summary.csv — one row per symbol: the window in milliseconds, every counter above, the parameters used and the identity result. A disabled check leaves its cells empty instead of writing 0.
- <prefix>_<symbol>_sessions.csv — the quote sessions the broker declares, one row per session (weekday, from, to in seconds).
- <prefix>_<symbol>_hours.csv — by server hour: ticks, unexplained silences and their seconds, flagged reversals.
- <prefix>_findings.csv — one row per finding with the symbol, the check, time_msc, the readable time, two values and a text detail. For a reversal value1 is its size and value2 the distance back to p0, both in points; for a silence value1 is its length in seconds and value2 the time_msc of the tick that ended it.
Limits, stated plainly
- It audits the ticks your terminal holds. A refreshed or re-downloaded history can change every number, and a terminal that was offline produces silences the broker never had.
- The session table is the broker's own statement. An explained silence is explained only in the sense that the broker said there would be no quotes; an unexplained one is a disagreement between two of the broker's statements, not proof of a fault.
- A reversal is a pattern, not a verdict. The tool cannot tell a bad print from a real trade; it measures size and time and leaves the judgement to you.
- The window is limited to InpDays days (at most 365). Ticks are read in chunks, so memory stays small, but a long window on a busy symbol takes proportionally longer.
- Symbols charted by Last price are audited on the Last price. No such symbol was available on this server, so that branch is implemented but was never run, and the independent recount covers Bid-charted symbols only.
- No trading functions, no DLL, no network access: it reads ticks, bars and session tables, and writes CSV files to MQL5\Files.
 Memory Sequence
A specified moment in time can be analyzed through multiple synced timeframes from 1 host chart for a symbol.
ORB Risk Managed - Opening Range Breakout with Account Protection
Opening Range Breakout EA template with built-in account protection. Marks the high and low of the first N minutes after the session open and places OCO stop orders above and below the range. Includes risk-based position sizing, daily loss limit, maximum drawdown limit, ATR range filter, trade direction filter, and protection against positions carried overnight. All session times are configurable inputs. Educational template, not a profit-guaranteed system. Test on demo before any live use.
87.8 Percent from 2021 to YTD at 8.5 Percent MaxDD. The Nikkei EA That Only Buys When Volume Is Quiet
A free, fully open JPN225 (Nikkei 225) EA for M15. Buys when price leans up, momentum isn't stretched and volume is quiet. Backtest 2022 to 2026: profit factor 1.68, +18.5% a year, passed 15 stress tests. Flat by 17:00.
Extrapolator
Extrapolator fits a sum of sinusoidal harmonics to the recent price history and extends the fitted curve to the right of the last bar as a forecast.The forecast is a mathematical extrapolation of past cyclical behaviour, not a guarantee of future price movement. The last part of the line is redrawn while the current model bar is forming, and the fitted curve changes with each refit.