 MetaTrader 5
 Experts
 Indicateurs
 Scripts
 Bibliothèque
 Stockage
Rejoignez notre page de fans

Multi-Timeframe FVG Depth Meter - indicateur pour MetaTrader 5

- Vues:
- 1846
- Note:
- Publié:
- Mise à jour:
-
 Vous manquez des opportunités de trading :
- Applications de trading gratuites
- Plus de 8 000 signaux à copier
- Actualités économiques pour explorer les marchés financiers
Inscription Se connecterVous acceptez la politique du site Web et les conditions d'utilisation
Si vous n'avez pas de compte, veuillez vous inscrire -
 Besoin d'un robot ou d'un indicateur basé sur ce code ? Commandez-le sur Freelance
Aller sur Freelance
Besoin d'un robot ou d'un indicateur basé sur ce code ? Commandez-le sur Freelance
Aller sur Freelance
Multi-Timeframe FVG Depth Meter
Author: AKINYEMI AKINTOYE
The idea behind it
Fair Value Gaps get plotted constantly, but most tools only show them on the timeframe you happen to be looking at, and they don't tell you anything about how much unresolved imbalance is actually stacked up in the market at once. This indicator scans four timeframes you choose (defaults: M15, H1, H4, D1) for three-candle imbalances, keeps only the ones that haven't been traded through yet, and draws them straight onto your current chart as shaded zones — each one labeled by the timeframe it came from through the on-screen dashboard.
Alongside the multi-timeframe zones, the indicator also plots a two-color histogram in a subwindow: bullish gap depth (in points) above zero, bearish gap depth below zero, calculated bar-by-bar directly from your chart's own timeframe. This gives you a genuine historical record of local imbalance intensity, while the rectangles on the main chart give you the current, live picture of unfilled gaps sitting above and below price across the higher timeframes.
How to interpret it
- The gap definition — a Fair Value Gap forms when three consecutive candles leave a price region untouched: candle 1's high sits below candle 3's low (bullish gap) or candle 1's low sits above candle 3's high (bearish gap). Only gaps at least InpMinGapPoints wide are kept.
- The multi-timeframe zones — for each of the four selected timeframes, the indicator keeps up to InpMaxGapsPerTF of the most recent unfilled gaps and draws them as rectangles directly on the current chart, colored by direction so you can see at a glance where unresolved imbalance sits relative to price.
- The fill threshold — a gap is dropped once price has traded back through it by InpFillThresholdPercent. Set this below 100% if you want gaps to disappear on a partial retrace rather than a full fill.
- The local histogram — plotted in the subwindow, this is a true bar-by-bar calculation of gap depth on your current chart timeframe only, independent of the multi-timeframe zones above. Use it to see whether local imbalance has been skewed bullish or bearish recently.
- The dashboard — top-left corner of the chart, one line per timeframe showing live gap count and total point-depth, plus a running total. Clusters of unfilled zones stacking on one side of price often act as a magnet before trend continuation resumes.
External variables (inputs)
| Input | Default | Purpose |
|---|---|---|
| InpTF1 / InpTF2 / InpTF3 / InpTF4 | M15 / H1 / H4 / D1 | The four timeframes scanned for Fair Value Gaps. |
| InpLookbackBars | 200 | Number of bars scanned per timeframe when searching for gaps. |
| InpMinGapPoints | 50 | Minimum gap size, in points, required for a gap to qualify as valid. |
| InpMaxGapsPerTF | 12 | Maximum number of unfilled gaps kept and drawn per timeframe. |
| InpFillThresholdPercent | 100.0 | Percentage of the gap that must be traded through before it's considered filled and removed from the chart. |
| InpBullColor / InpBearColor | DodgerBlue / OrangeRed | Rectangle colors used for bullish (support-side) and bearish (resistance-side) gaps. |
| InpRectStyle | STYLE_SOLID | Border line style used for the gap rectangles. |
| InpShowDashboard | true | Toggles the on-chart summary dashboard on or off. |
| InpFontSize / InpFontName | 9 / Consolas | Font size and typeface used for the dashboard text labels. |
Recommended use
Works on any symbol and any chart timeframe — the logic is purely pattern-based and doesn't depend on a specific instrument's behaviour the way a session or volatility strategy would. That said, the multi-timeframe zones only update on a new bar of the chart you're attached to, so on very low timeframes the higher-timeframe rectangles will lag slightly behind the true close of those bars; this is expected and keeps the indicator lightweight. If you run it on multiple charts at once, be aware each instance maintains its own object set under a shared name prefix, so avoid attaching it twice to the same chart.
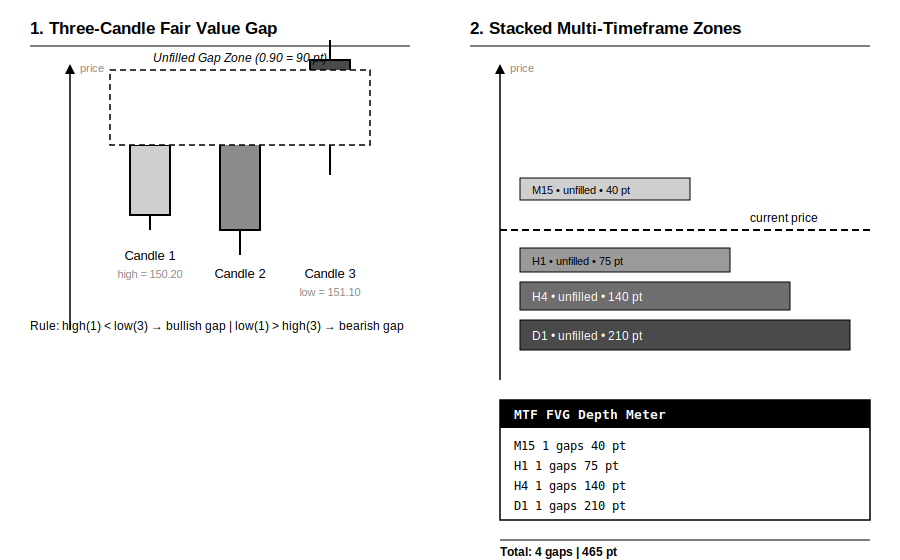
Fig. 1. Left: how a single bullish FVG is measured between candle 1 and candle 3. Right: unfilled gaps from each selected timeframe rendered as stacked zones on the current chart, summarized by the dashboard. Rendered in black and white per the Code Base image guidelines.
Session Sweep Reversal Detector
arks the prior session's high/low and flags liquidity sweeps that reverse back inside the range within a set number of bars." — category Other, or Trend if you'd rather group it that way.
 Broker Execution Diagnostics MT5
Read-only MT5 script reporting broker volume, price, stops, freeze, spread and execution constraints.
 Trade Transaction Trace Logger MT5
Read-only OnTradeTransaction logger that records MT5 order, deal and position lifecycle events to local CSV and the Experts Journal.
Stop Geometry Visualizer MT5
Read-only MT5 indicator that visualizes broker Stops Level and Freeze Level references on the chart.