 MetaTrader 5
 Experts
 Indicateurs
 Scripts
 Bibliothèque
 Stockage
Rejoignez notre page de fans

QBrain Execution Friction Monitor - indicateur pour MetaTrader 5

- Vues:
- 110
- Publié:
- Mise à jour:
-
 Vous manquez des opportunités de trading :
- Applications de trading gratuites
- Plus de 8 000 signaux à copier
- Actualités économiques pour explorer les marchés financiers
Inscription Se connecterVous acceptez la politique du site Web et les conditions d'utilisation
Si vous n'avez pas de compte, veuillez vous inscrire -
 Besoin d'un robot ou d'un indicateur basé sur ce code ? Commandez-le sur Freelance
Aller sur Freelance
Besoin d'un robot ou d'un indicateur basé sur ce code ? Commandez-le sur Freelance
Aller sur Freelance
QBrain Execution Friction Monitor
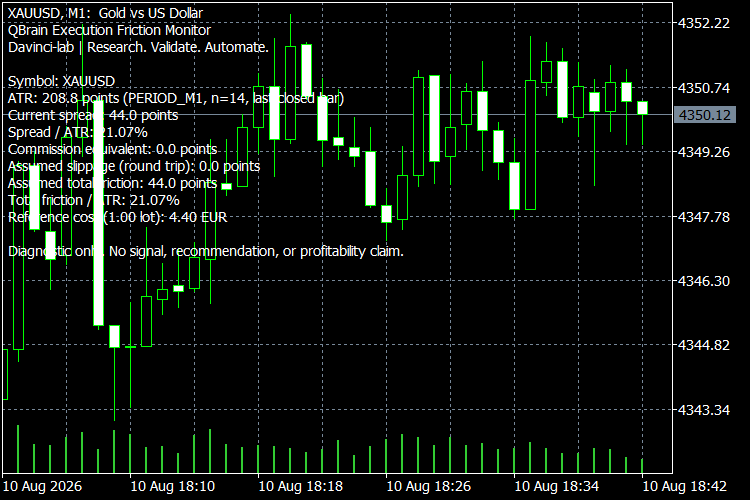
QBrain Execution Friction Monitor is a quantitative diagnostic indicator for MetaTrader 5 developed by Davinci-lab.
Its purpose is to measure assumed round-trip execution friction relative to observed market volatility.
In short-horizon trading, detecting a statistical signal is not sufficient. Spread, commission and slippage can consume a material fraction of the price movement available to a strategy.
The indicator evaluates:
Friction Ratio = (Spread + Commission Equivalent + Assumed Slippage) / ATR
It displays ATR in points, current bid/ask spread, Spread/ATR ratio, commission equivalent in points, assumed round-trip slippage, total assumed execution friction, Total Friction/ATR ratio and an estimated monetary friction for a configurable reference lot.
By default, ATR is calculated using the last completed bar rather than the still-forming bar.
Commission and slippage are user-defined assumptions because actual execution conditions depend on the broker, account type, instrument and market environment.
Interpretation
The indicator does not determine whether a strategy has an edge. It quantifies one component of strategy feasibility: the magnitude of execution friction relative to observed price movement.
A low friction ratio does not demonstrate profitability, and a high friction ratio does not prove that a strategy cannot work. The metric should be interpreted together with signal expectancy, holding period, market regime and execution characteristics.
Limitations
The indicator does not trade, generate BUY or SELL signals, predict market direction, estimate future profitability, or model market impact and order-book position.
It is intended for quantitative research, strategy diagnostics and execution-cost awareness.
Davinci-lab develops the technology. QBrain delivers the tools.
QBrain — Research. Validate. Automate.
 Scalping Dashboard
This indicator is a professional Scalping Dashboard utility designed specifically for MetaTrader 5 (MT5). It displays real-time vital market status information and scalping strategy conditions (based on Exponential Moving Arrows/EMAs), automatically computing spreads, momentum, and moving averages to output instant BUY/SELL SETUP visual signals.
Previous Week High Low Indicator
Plots the previous trading week's High and Low as horizontal reference levels across the current week, with optional multi-week history for context. No repainting, no discretion — the levels are read directly from the completed Weekly bar.
Swing Trading Dashboard
Swing Trading Dashboard is a visual indicator for MetaTrader 5 (it does not generate automatic trade signals — it only displays information on the chart). Essentially it's a "dashboard" panel that calculates the recent swing trading range and shows where the current price sits relative to it — mid-range, near a boundary, or already broken out.
XAUUSD MTF Liquidity OB Reversal Breakout
XAUUSD MTF Liquidity & Order Block Reversal Strategy A professional Smart Money Concepts (SMC) based MT5 indicator designed primarily for **XAUUSD (Gold)**. The strategy combines multi-timeframe liquidity, order blocks, liquidity sweeps, breakout/reversal confirmation, and M1 swing-based risk management to identify high-probability BUY and SELL opportunities. Strategy Features Multi-Timeframe Liquidity Detection The indicator identifies important liquidity and order-block levels from: * Best Day-wise Liquidity * H4 Liquidity & Order Blocks * M30 Liquidity & Order Blocks * M15 Liquidity & Order Blocks * M5 Liquidity & Order Blocks The strongest day-wise liquidity replaces simple Previous Day High/Low logic and searches historical daily candles for significant liquidity concentrations.