Rejoignez notre page de fans

Balance Graph HTML (MT4) - script pour MetaTrader 4

- Vues:
- 11456
- Note:
- Publié:
- Mise à jour:
-
 Vous manquez des opportunités de trading :
- Applications de trading gratuites
- Plus de 8 000 signaux à copier
- Actualités économiques pour explorer les marchés financiers
Inscription Se connecterVous acceptez la politique du site Web et les conditions d'utilisation
Si vous n'avez pas de compte, veuillez vous inscrire -
 Besoin d'un robot ou d'un indicateur basé sur ce code ? Commandez-le sur Freelance
Aller sur Freelance
Besoin d'un robot ou d'un indicateur basé sur ce code ? Commandez-le sur Freelance
Aller sur Freelance
Description:
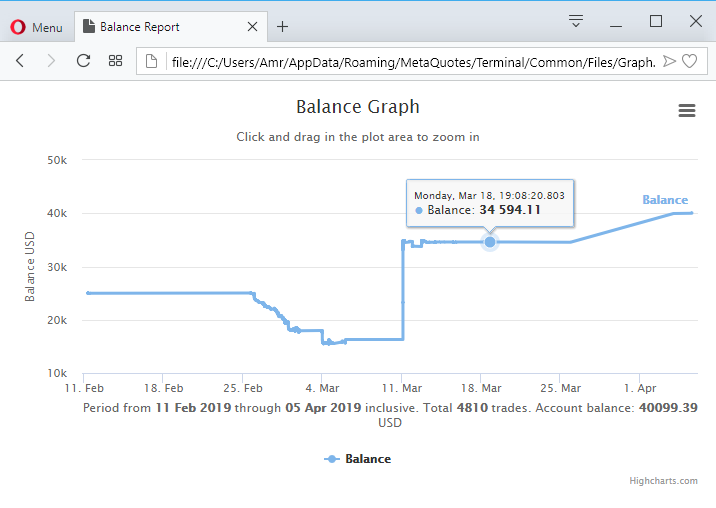
Display interactive HTML graph of the account balance inside the web browser.
The included template html file uses the HighCharts JavaScript library from https://www.highcharts.com/
Highcharts makes it easy for developers to set up interactive charts in their web pages.
Make your data come alive
How to use:
- Copy the files to the \Scripts folder
- Compile and run the script
- The web page should be displayed in your web browser.
The generated html file can be located at "%userprofile%\AppData\Roaming\MetaQuotes\Terminal\Common\Files\Graph.htm"
Tooltips showing the balance
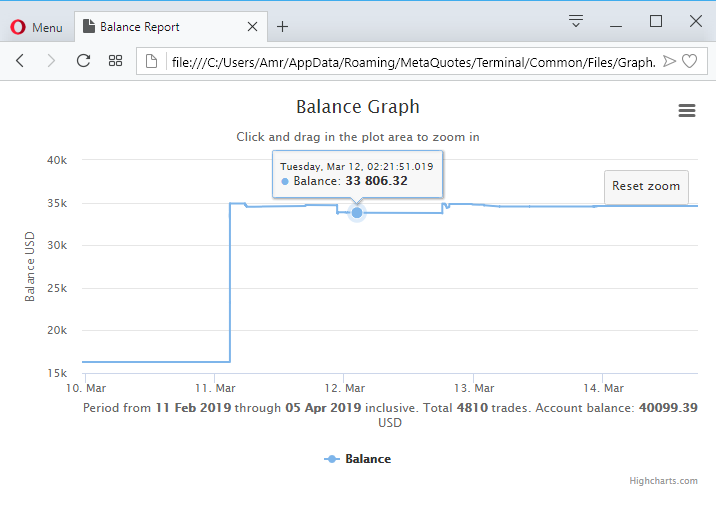
Zoom at specific points
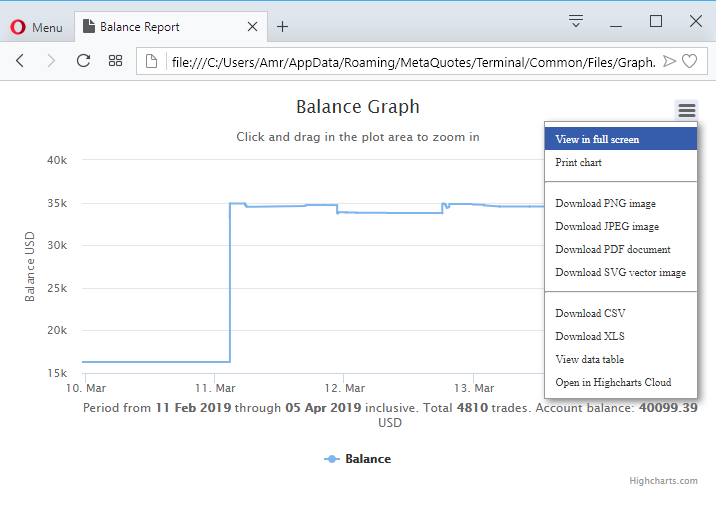
Other features:
 Triangle
"Triangle" EA draws 2 Trend Lines with fractals on chart and trades When a triangle is formed,has Trailing Stop Loss &Take Profit works with all time frames major forex pairs and stocks NASDAQ.
Trend Line By Angle
With "Trend Line By Angle" EA you can draw Trend Line By Angle on the chart and trade with price breakthrough or trend,has 3 buttons for manual trading and allows to predetermine trailing stoploss & take profit, open and close all trades at once.
ZeeZee Level
ZeeZee Level, One by One
 This ia an rainbow MA indicator based on SMA
This indicator uses various SMA to indicate a possible reversal point.