 MetaTrader 5
 Experts
 Indicateurs
 Scripts
 Bibliothèque
 Stockage
Voir comment télécharger gratuitement des robots de trading
Retrouvez-nous sur Telegram !
Rejoignez notre page de fans
Rejoignez notre page de fans
Vous avez aimé le script ? Essayez-le dans le terminal MetaTrader 5

Vervoort's crossover - tape - indicateur pour MetaTrader 5

- Vues:
- 8679
- Note:
- Publié:
- Mise à jour:
-
 Vous manquez des opportunités de trading :
- Applications de trading gratuites
- Plus de 8 000 signaux à copier
- Actualités économiques pour explorer les marchés financiers
Inscription Se connecterVous acceptez la politique du site Web et les conditions d'utilisation
Si vous n'avez pas de compte, veuillez vous inscrire -
 Besoin d'un robot ou d'un indicateur basé sur ce code ? Commandez-le sur Freelance
Aller sur Freelance
Theory :
Sylvain Vervoort's article in May 2008 issue of TASC , "The Quest For Reliable Crossovers," describes a trading system based on three functions: the triple exponential moving average (TMA), the heikin-ashi close (haC), and the "typical price" (TypicalPrice). Vervoort's strategy trades the crossover of the typical price and heikin-ashi TMAs
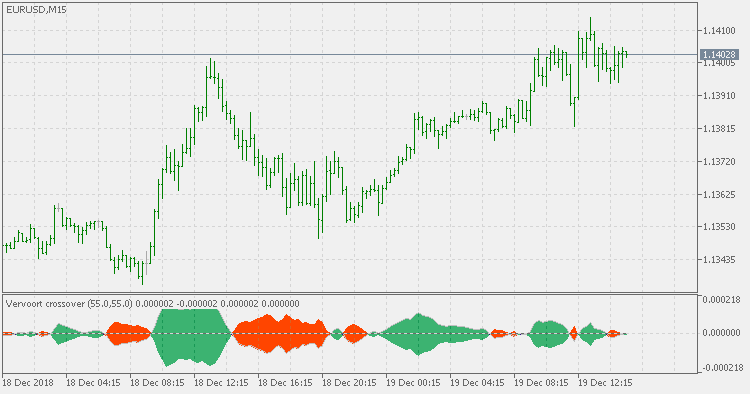
In order to make it easier to spot the trend changes, this version is made as a separate window tape indicator. It is showing the current trend state and it is indicating a sort of a "strength" of that trend
Usage :
You can use color changes as signals
PS:
The Vervoort's crossover indicator "counts" ion the lag of the heiken ashi "average: price, hence, if you re changing that some more experimenting with periods and different price types is advised. For the sake of being be to experiment the full set of heiken ashi prices is provided :
- Heiken ashi close
- Heiken ashi open
- Heiken ashi high
- Heiken ashi low
- Heiken ashi median
- Heiken ashi typical
- Heiken ashi weighted
- Heiken ashi average
- Heiken ashi median body
- Heiken ashi trend biased price
Vervort's crossover - histogram version
Vervort's crossover - histogram version
Vervoort's crossover
Vervoort's crossover
Vervoort's crossover - extended
Vervoort's crossover - extended
Adaptive Moving Average - AMA
Adaptive Moving Average - AMA - as described by Vitali Apirine