Rejoignez notre page de fans
- Vues:
- 32554
- Note:
- Publié:
- Mise à jour:
-
Besoin d'un robot ou d'un indicateur basé sur ce code ? Commandez-le sur Freelance Aller sur Freelance
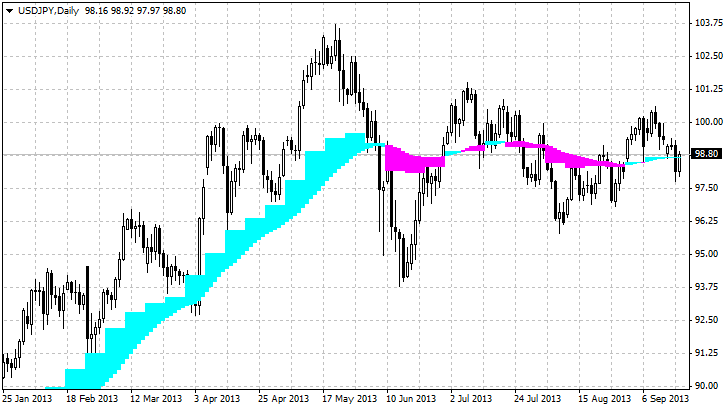
This indicator uses 2 Moving Averages.
One is current timeframe's, the other is upper timeframe's.
You can use this indicator to check the trend on current timeframe.
This indicator carries"Changing upper timeframe automatically when you change timeframe".

Recommendations:
- Please use default setting as possible.
- Attention ! You cannot use correctly on Monthly chart.
- Next upload is "Real Time Pivot" :D
 b Clock Plus
This is an updated version of b Clock.
 MoneyManagement visualizer
This is an indicator that uses horizontal lines for calculate lot size for next order. You can drag them up and down until you will get right numbers for your risk and money management that is based on your strategy scenarios.
 Advanced MTF RSI
With the MTF RSI Indicator you can easily identify the oversold/overbought levels on several different timeframes by using only one chart.
 eur/usd trend catcher
The idea of this robot is to catch long trends. Crossing the 15Min moving average triggers buy and sell orders.