Signalings
- Indicadores
- Versión: 2.0
- Activaciones: 5

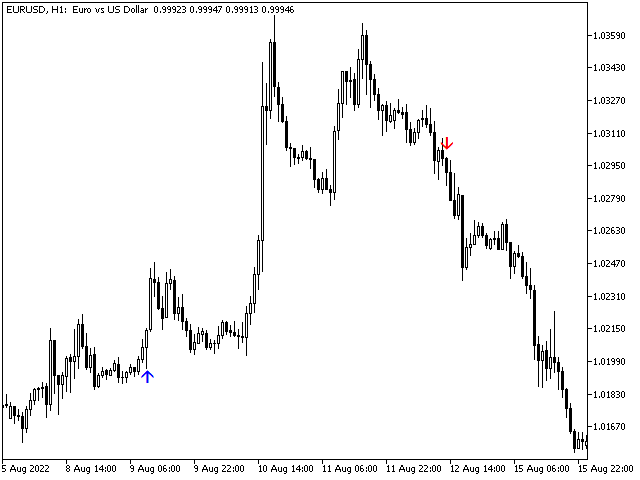
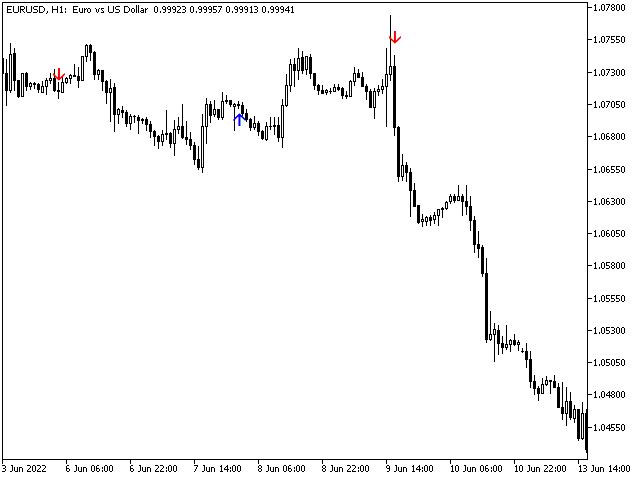
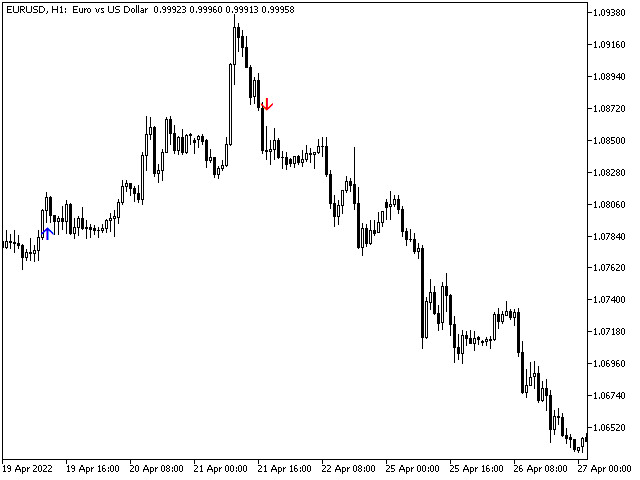
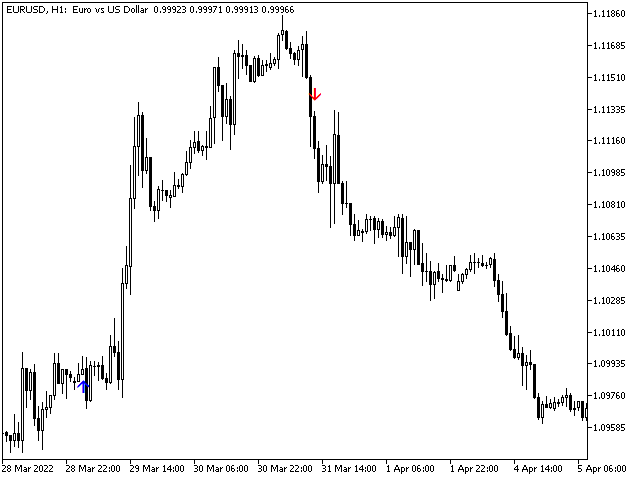
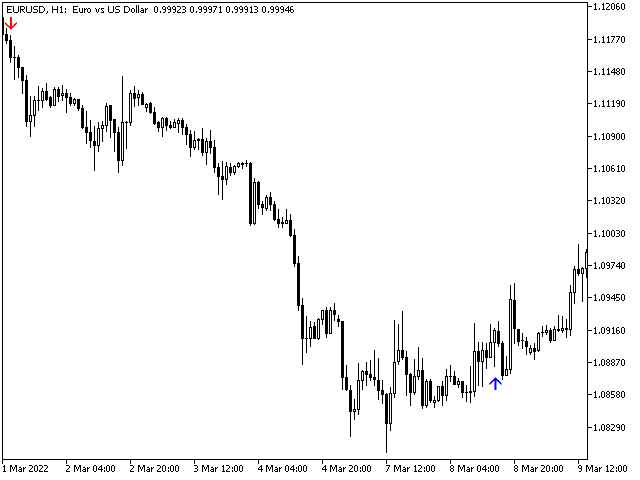
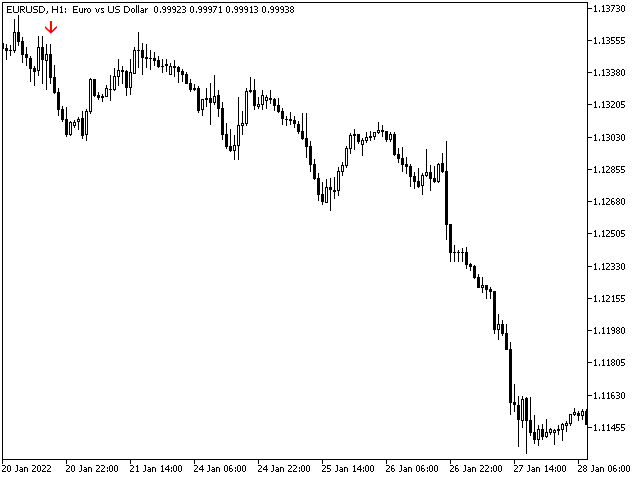
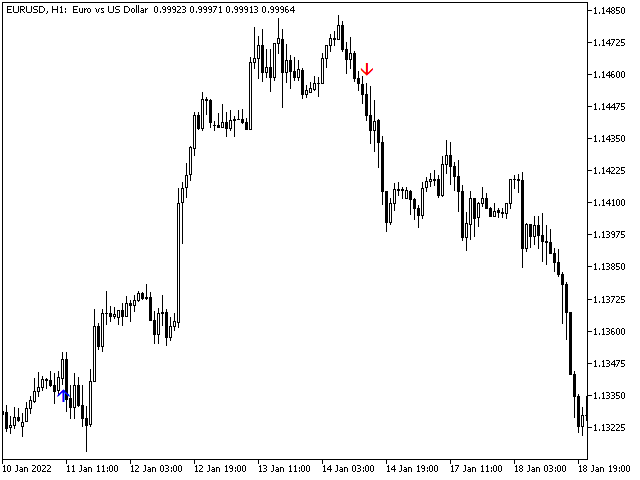
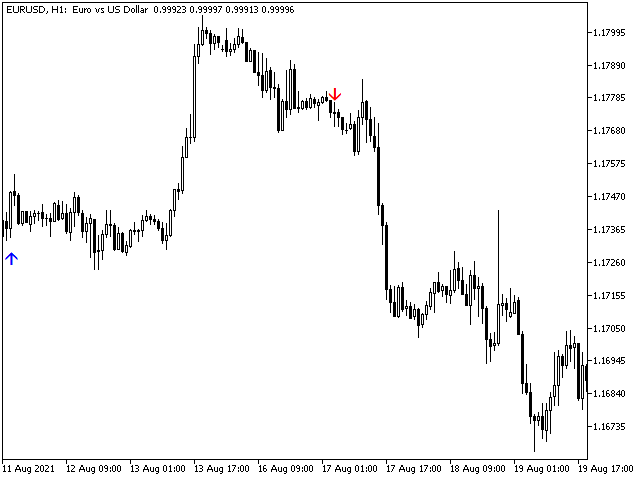
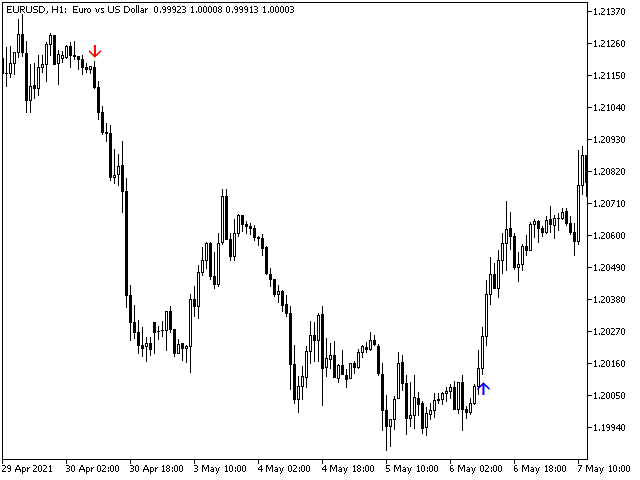
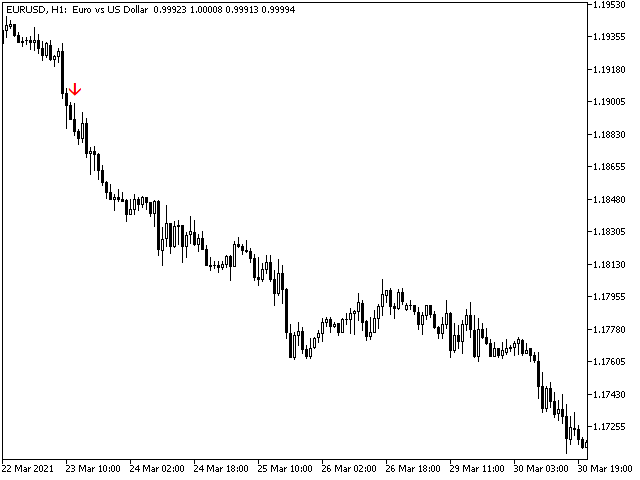
La señalización es un indicador de tendencia muy interesante. El indicador Destructor del Caos ayuda a identificar una tendencia nueva o ya existente. Una de las principales definiciones para el seguimiento del mercado de divisas es una tendencia, razón por la cual se creó este indicador. Sus señales se basan en un algoritmo fiable. Cuando se utiliza simultáneamente en múltiples marcos temporales, este indicador realmente "hace que la tendencia sea su amiga". Con él, puede seguir tendencias en múltiples marcos temporales en tiempo real. Una de las ventajas del indicador es que se reconstruye con bastante rapidez y reacciona a diversos cambios en el gráfico. El indicador fue creado sobre la base de los indicadores originales para la búsqueda de puntos extremos, el indicador es muy adecuado para determinar una inversión o un gran tirón brusco a uno de los lados, gracias a él usted sabrá cuando esto sucede, se le notificará con la aparición de un punto azul para comprar rojo para vender.