Sajiro Yoshizaki / Profile
- Information
|
4 years
experience
|
26
products
|
4
demo versions
|
|
0
jobs
|
0
signals
|
0
subscribers
|
Why Choose PracticeSimulator?
- No Risk, Unlimited Practice: Hone your trading skills without risking real money.
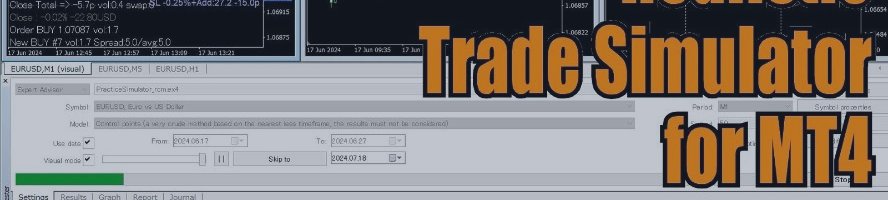
- Powerful Simulation Anytime: Test strategies under realistic market conditions, even on weekends.
- Beginner-Friendly & Skill-Enhancing: Simple for beginners, effective for refining advanced strategies.
Available Now on MQL5 Market
https://www.mql5.com/en/market/product/98348
Stay Connected!
Send me a Friend Request—I approve all! On MQL5, it works like following, so feel free to connect and stay updated.
SyncObjects is a tool that allows you to synchronize objects drawn on multiple charts in real-time within MetaTrader. Objects such as trend lines, horizontal lines, and text labels can be automatically reflected on other charts. It enables seamless analysis across different timeframes and currency pairs, enhancing the efficiency of your trading environment. Additionally, it works well with trade practice and testing tools like PracticeSimulator , allowing you to conduct chart analysis and
Chart Buddy: Your New Trading Buddy, But... Does It Actually Help?
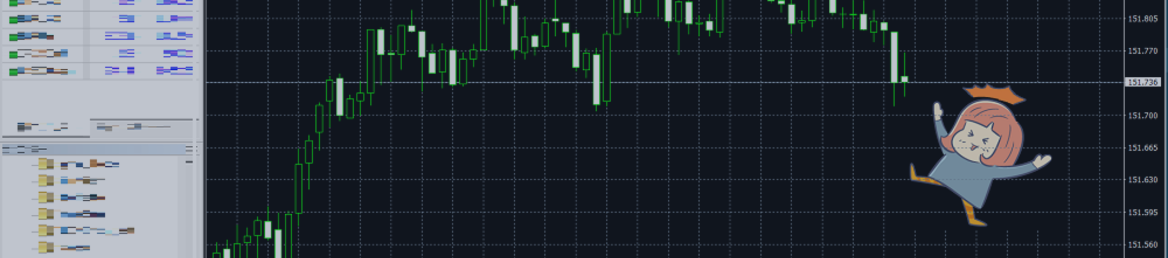
Chart Buddy is an entertainment tool designed to add fun to your trading charts. A character moves along the right side of the chart, giving the impression that it's cheering on the price movement, adding a unique and enjoyable touch to your trading experience. While it doesn't affect your trades directly, the animations provide a lighthearted distraction and make it feel like you have a personal supporter. Key Features: Price Movement Supporter : The character moves in response to price
The First Step to Becoming an Advanced Trader: Mastering Partial Close
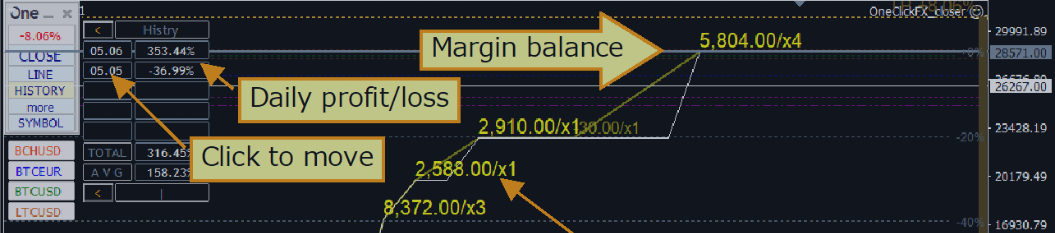
PL Graph Visualizer is a utility that displays real-time graphs of your account's profit and loss. The graph can be viewed separately by currency pair or by magic number, allowing you to see the changes in profit and loss of each position at a glance. This tool can be used in conjunction with the integrated close tool, which can be found here, to further enhance its functionality. https://www.mql5.com/en/market/product/116884 The real-time graphs show not only the total profit and loss of the
This tool does not work with the Strategy Tester. Test version: https://www.mql5.com/en/blogs/post/753244 This tool allows you to visualize account performance by showing key metrics based on your account balance. You can select the lines, drag and drop them to instantly see key metrics at different price points. If you ever want to return to the original position after moving the lines, simply double-click, and they will snap back to their original parameters. This tool can notify you when the