GT Direction Dashboard
- Indicators
- Version: 2.10
- Activations: 5

1. Executive Summary & Core Purpose
The GT Direction Dashboard is a multi-timeframe, multi-metric currency alignment dashboard built for MetaTrader 4. It is designed to solve one of the greatest challenges manual currency traders face: Analysis Paralysis and Information Overload.
Rather than manually switching across 6 or 8 timeframe charts ( MN1 down to M5 ) and adding 4 or 5 separate indicators (RSI, ADX, PBR, Volatility, ROC) to each chart, the GT Direction Dashboard aggregates all critical trend, momentum, volatility, and velocity data into a single, compact UI directly on your main chart.
Primary Trading Intent:
- At-a-Glance Market Conviction: Instantly evaluate whether a currency pair is in a high-probability institutional trend across timeframes or stuck in a choppy range.
- Eliminating the "No Alignment Trap": Using a Tiered Alignment System (Grade A vs. Grade B), the dashboard highlights early momentum breakouts before lagging trend filters (like ADX) delay your entry.
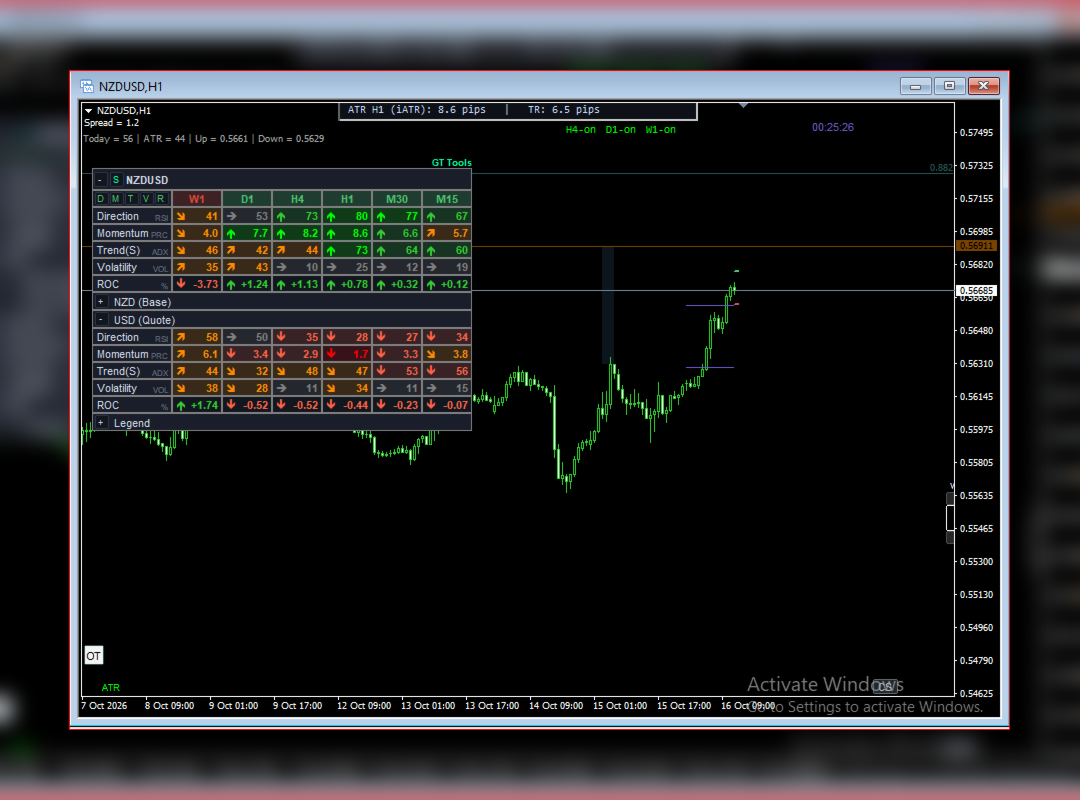
- Basket Dynamics: Optionally evaluates the underlying Base Currency and Quote Currency against their respective 7 major market pairs to confirm whether the move is driven by true currency strength/weakness or single-pair noise.
2. Key Indicators & Metrics Explained
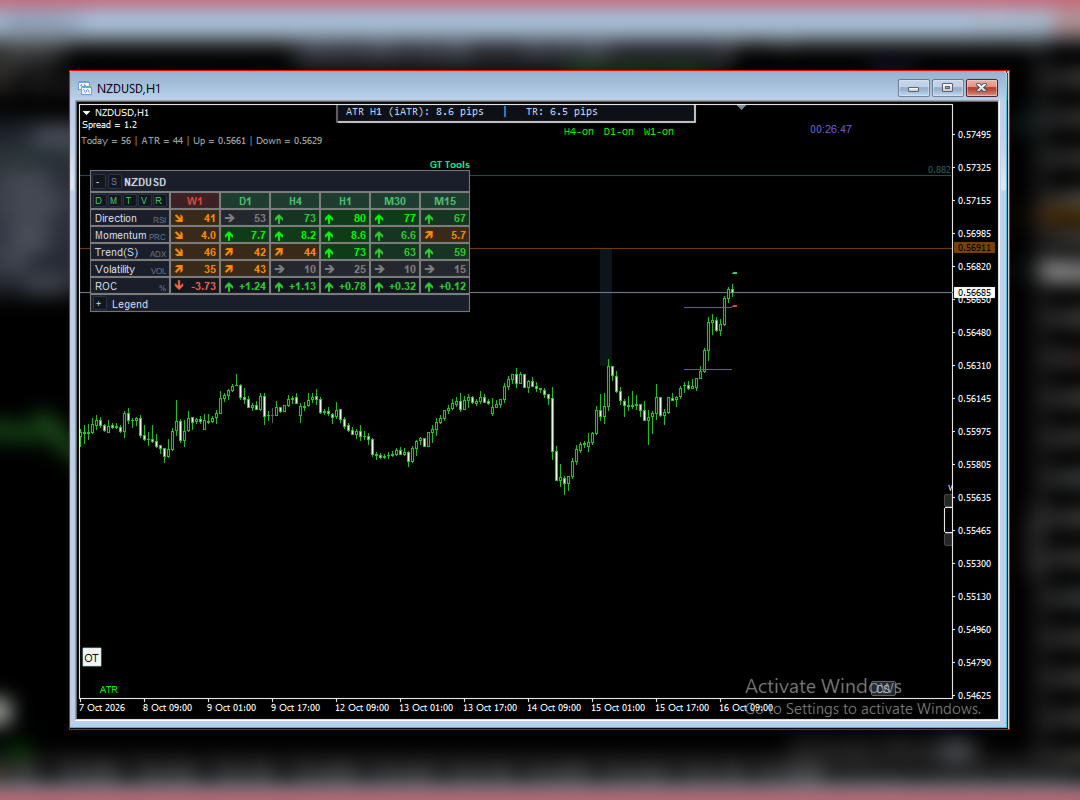
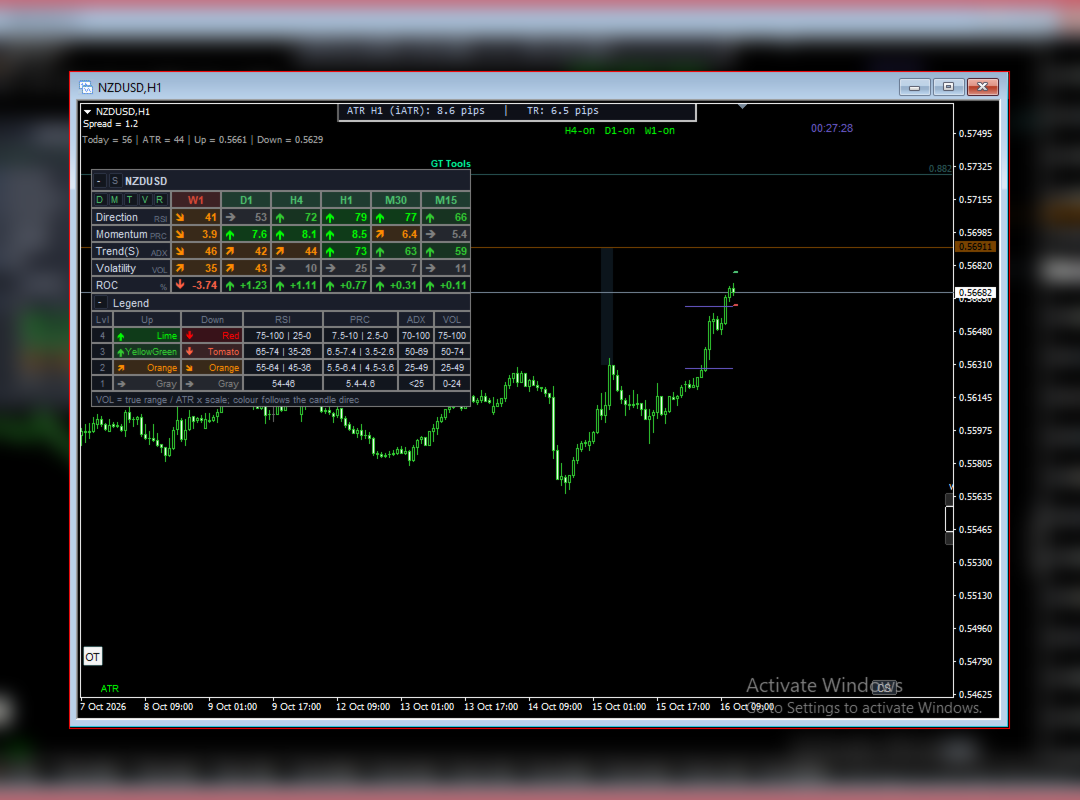
The dashboard compiles 5 core parameters for every visible timeframe:
1. Direction — Wilder’s Relative Strength Index (RSI)
- Sub-label: RSI (14-period)
- What it measures: The underlying directional momentum relative to 50 midpoint.
- Interpretation:
- $> 50$: Bullish bias (scored into levels based on distance from 50).
- $< 50$: Bearish bias.
2. Momentum — Dual Mode (Impulse EMA vs. PBR Range)
- Sub-label: PBR (Selectable in settings: MOM_IMPULSE_EMA or MOM_PBR_RANGE )
- Mode A — Impulse Momentum ( MOM_IMPULSE_EMA ):
- Measures price distance from a fast Exponential Moving Average (EMA 20) normalized by ATR(14).
- Usefulness: Highly responsive to real-time price acceleration. Smooths out minor noise while identifying strong trend expansion.
- Mode B — PBR Range Position ( MOM_PBR_RANGE ):
- Measures where current price sits within the $N$-bar High-Low range.
- Usefulness: Excellent for detecting proximity to recent support/resistance boundaries.
3. Trend — Average Directional Index (ADX)
- Sub-label: ADX (14-period)
- What it measures: Institutional trend strength regardless of direction.
- Coloring: Colored by the Direction side of 50 (Green if RSI $> 50$, Red if RSI $< 50$).
- Interpretation:
- $< 25$: Weak/Choppy trend.
- $25 - 49$: Developing trend.
- $50 - 69$: Strong trend.
- $> 70$: Extremely strong / parabolic trend.
4. Volatility — True Range / ATR Ratio with Net Body Delta
- Sub-label: VOL
- What it measures: Magnitude of current bar expansion.
- Net Body Delta Filter: Evaluates body-to-range ratio.
- Usefulness: Prevents false directional signals on long-wick rejection candles (e.g. Shooting Stars or Hammers), coloring them neutral when rejections occur.
5. ROC — Rate of Change (%)
- Sub-label: % (14-period)
- What it measures: Percentage price change over $N$ bars.
- Usefulness: Identifies mathematical velocity and sign agreement ($+$ vs. $-$).
3. The Tiered Alignment System
To ensure you never miss explosive moves while waiting for lagging indicators to catch up, the dashboard features a two-tier alignment architecture:
+-----------------------------------------------------------------------+ | GRADE A (Full Alignment) --> Solid Bright Green / Red Fill | | - All active rows agree (Direction, Momentum, ADX, Volatility, ROC). | | - Maximum conviction for position sizing or trend holding. | +-----------------------------------------------------------------------+ | GRADE B (Early Impulse) --> Tinted / Muted Green / Red Fill | | - Core Impulse parameters agree (Direction, Momentum, ROC). | | - Catches fast breakout turns BEFORE lagging ADX turns green. | +-----------------------------------------------------------------------+ | GRADE 0 (Neutral / Choppy) --> Dark Background | | - Mixed parameters; low probability for directional trades. | +-----------------------------------------------------------------------+
4. Advanced UI Features & Controls
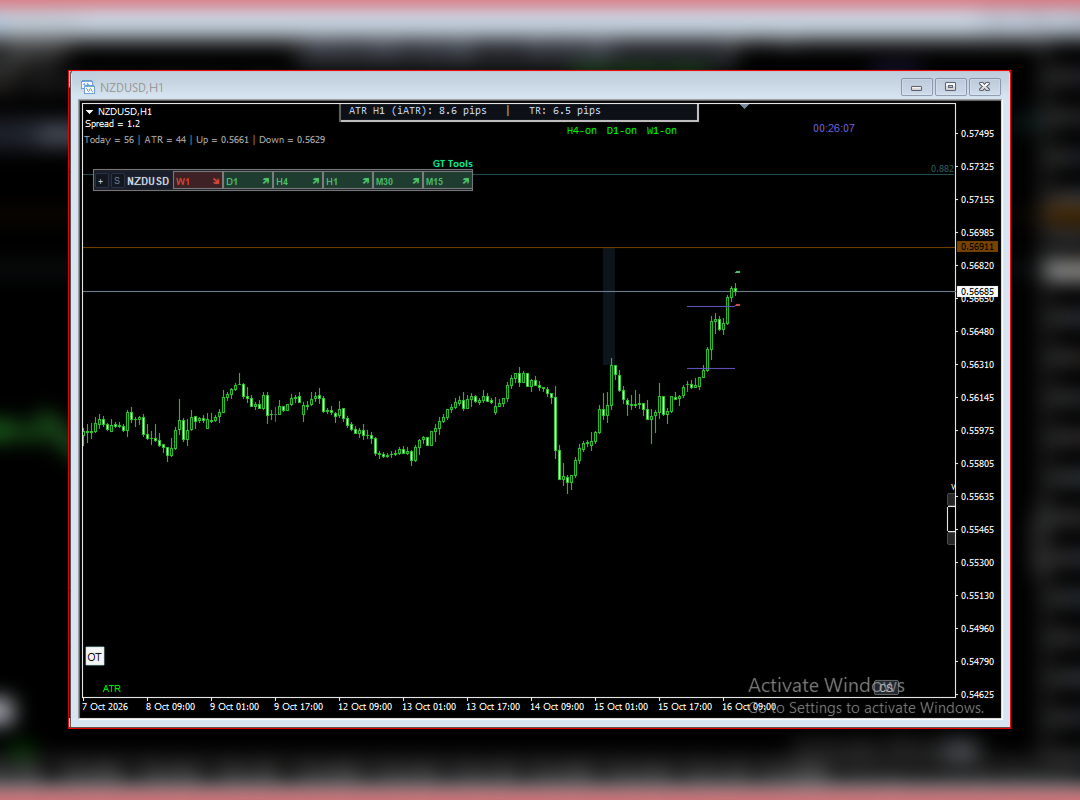
- Smart Collapsed Header:
- When the panel is toggled off ( - button), the header transforms into a compact alignment ticker bar.
- Displays all active timeframe cells with embedded arrow icons and color shades, allowing full market overview in just 22 pixels of vertical space.
- Sub-panel Toggle ( S Button):
- Instantly collapses or expands the Base and Quote currency basket sub-panels ( AUD and NZD ) directly from the header without opening settings.
- Mini Parameter Buttons ( D , M , T , V , R ):
- Located in the top-left cell below the pair name.
- Toggles individual row calculations on/off with clean text-color highlighting, instantly recalculating alignment for only your chosen parameters.
- Independent Column Width ( ColWidth ):
- Guarantees that timeframe column widths strictly obey your input preference regardless of panel scaling.
5. Advantages for Active Traders
- Speed & Execution Confidence: Reduces multi-timeframe analysis time from minutes to milliseconds.
- Early Entry Advantage: Grade B alignment alerts you to early impulse moves at the exact moment velocity starts.
- Wick-Rejection Protection: Net Body Delta filtering prevents buying into top-wick rejections or selling into bottom-wick spring rejections.
- Basket Validation: Verifies whether a move in NZDUSD is driven by genuine NZD strength across all major pairs, or just a temporary USD blip.
- Ultra-Lightweight Performance: Redraws only when chart data changes and skips calculations for hidden/collapsed sections.
6. Operational Limitations & Best Practices
- Low Volatility / Asian Session Consolidation:
- During tight, sideways ranges, lower timeframes ( M5 , M15 ) can trigger temporary Grade B impulse flips on tiny 3-pip moves.
- Best Practice: Use higher timeframes ( H1 , H4 , D1 ) as trend anchors and lower timeframes for execution timing.
- Uncached History on Attachment:
- On initial attachment to a new MT4 terminal, secondary timeframes may take 1-2 seconds to fetch historical bar data from the broker server.
- Best Practice: Allow the dashboard 1-2 ticks or switch chart timeframes once to ensure all multi-timeframe buffers are populated.
- Major Economic News Events:
- During high-impact news releases (NFP, CPI, Rate Decisions), spread widening and sudden two-way spikes can cause rapid alignment flips.
- Best Practice: Avoid entering new positions during high-impact news releases even if Grade A alignment flashes temporarily.
Note on Utility & Indicator Intent: The GT Direction Dashboard is an analytical software tool designed solely to quantify, organize, and visually display multi-timeframe price metrics, statistical momentum, and currency basket dynamics on MetaTrader 4 charts. It provides automated data calculation to support disciplined, efficient chart analysis and structured decision-making. All signals, alignment grades, and directional indicators reflect direct mathematical metrics derived from chart price history.