 MetaTrader 5
 Experts
 Indicators
 Libraries
 Utilities
 Widgets
 Rules
Watch the Market tutorial videos on YouTube
How to buy а trading robot or an indicator
Run your EA on
virtual hosting
virtual hosting
Test аn indicator/trading robot before buying
Want to earn in the Market?
How to present a product for a sell-through
Technical Indicators for MetaTrader 4 - 175
 Signals from technical indicators listed below play a crucial role in opening and closing deals in MetaTrader 4 platform.
The essence of indicators is a mathematical transformation of a financial symbol price aimed at forecasting price changes.

MTF DashboardX MTF DashboardX is a professional scanner panel for MetaTrader 5 that shows market structure state across multiple symbols and timeframes in one window. Automatically detects BOS (Break of Structure) and CHoCH (Change of Character) signals so you don't miss important events and don't waste time switching between charts. Built by a trader with 12 years of live experience. Helps see the whole market picture at a glance. What the indicator shows Table panel with rows (symbols) and

AE SMC Zones Signal Pro marks the footprints of big money on your chart: Fair Value Gaps , Order Blocks and Breaker Blocks . It shows an arrow only when price actually reacts to a zone with a false breakout, a pin bar or a pivot reversal. FVG + Order Block + Breaker in one tool Arrows on closed candles Higher-TF zones on your working chart D1 trend filter Alert / Push / Email Signals for EAs All my products · Message me after purchase for setup help and a ready template Built on S
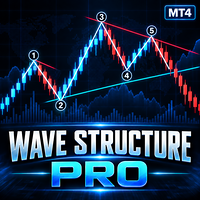
Wave Structure Pro is a technical analysis indicator for MetaTrader 4 designed to help traders identify market swings, wave structures, trend direction, dynamic trendlines and potential target levels directly on the chart. The indicator automatically analyzes price movement and presents the market structure in a clear visual format. It can be used on Forex, Gold, Indices, Commodities and other symbols available in MetaTrader 4. MAIN FEATURES • Automatic wave structure detection
• Automatic wave

AMD Nexus Prime - Market Structure & Liquidity Indicator
AMD Nexus Prime is a professional market structure indicator for MetaTrader designed to identify and visualize Accumulation, Manipulation, and Distribution (AMD) sequences directly on the chart.
The indicator processes confirmed bars, tracks range development, detects liquidity sweeps, and builds a reference trade model when a Distribution phase is confirmed.
Note: This is an analysis tool only. It does not open, modify, or close trad

VolatilityProX for MetaTrader 4 VolatilityProX is a professional indicator for MetaTrader 4 that combines three tools in one: Adaptive Supertrend — adaptive trend line Daily Range — yesterday's High/Low Pivot Points — classic R1, R2, S1, S2 levels Built by a trader with 12 years of live experience. Helps identify trend, key levels, and entry points — all in one window. What the indicator shows 1. Adaptive Supertrend Green line in uptrend, red in downtrend. Key difference from standard Supertr

MQL5 Blogs : https://www.mql5.com/en/blogs/post/776607 MT4 Version : https://www.mql5.com/en/market/product/198437 MT5 Version : https://www.mql5.com/en/market/product/198438
GRAVITY MAGNET [tambangEA] is an advanced market-structure and liquidity-attraction indicator designed to help traders understand where price may be drawn next and how strong the competing bullish and bearish liquidity forces are. Instead of relying on a single trend signal, Gravity Magnet analyzes multiple structural liq

WaveForce Mark is a panel indicator for manual chart markup and quick access to trading rules inside MetaTrader. Purpose
When market structure is already clear, you still need clean lines, labels, and a short checklist of rules. Mark keeps markup tools and text cards in one panel so you do not leave the chart. What you get Markup tab
Tools for drawing lines on the chart in a consistent panel style. Cleanup actions help you remove objects and keep the chart readable. Wave logic tab
Labels and hel

Ichi Nexus Prime - Adaptive Ichimoku Analysis for MT4
Ichi Nexus Prime is an advanced analytical indicator that combines the traditional Ichimoku framework with adaptive market calculations, multi-timeframe context, and structured risk visualization in one clean workspace.
Note: This is an analysis-only indicator and does not trade automatically.
CORE ENGINE The indicator operates in two calculation modes: - Classic Mode: Uses traditional, fixed Ichimoku periods. - Adaptive Mode: Dynamically

Divergence Indicator Pro X Divergence Indicator Pro X is a professional divergence indicator for MetaTrader 4 that automatically detects divergences between price and oscillator right on the chart. Full MT5-version functionality, adapted for MQL4. Works on any instrument and timeframe, no repaint. What the indicator shows 1. Regular Divergence — classic reversal signal: Bullish regular — price makes Lower Low, oscillator — Higher Low. Possible reversal up. Bearish regular — price makes

Volume Profile + CVD Volume Profile + CVD is a professional volume analysis indicator for MetaTrader 4 that displays volume distribution by price levels and cumulative volume delta.
Full MT5-version functionality, adapted for MQL4. One file — all volume analysis on the chart.
What the indicator shows 1. Volume Profile (right side of chart)
Horizontal histogram of volume distribution by price levels. Each bar's length = total volume traded at that level over the last N bars.
Blue bars

Nasdaq Signal Pro with Auto TP SL — MT4 Entries, profit targets and stop levels: Nasdaq trading information on one chart. Nasdaq Signal Pro is a discretionary trading indicator for Nasdaq-100 cash index CFDs on MT4. It displays BUY/SELL candidates, a reference entry price, take-profit (TP) and stop-loss (SL) levels on M5 and M15 charts. The blue panel brings together signals, market conditions and reference prices so you can review a setup before placing an order. This is the MT4 edition. The M

Hull Structure Pulse - Momentum & Market Structure System
Hull Structure Pulse is an analytical trading system that combines momentum (Hull Moving Average) with market structure (BOS and CHoCH). It provides 100% non-repainting signals, a multi-layered qualification engine, and an on-chart control panel.
SYSTEM OVERVIEW The indicator evaluates structural breakouts through a Qualification Engine. Signals are confirmed only when price meets strict criteria for momentum, volume, and targets. Mark

Crypto_Forex Indicator "CCI with Dynamic OverSold/OverBought zones" for MT4, No Repaint. - Commodity Channel Index (CCI) is excellent for Momentum trading into the trend direction. - It is great to take Sell entries from dynamic OverBought zone and Buy entries from dynamic OverSold zone into the direction of main trend. - This indicator is excellent to combine with Price Action entries as well. - Dynamic OverBought zone - above yellow line. - Dynamic OverSold zone - below blue line. - CCI oscil

Crypto_Forex Indicator "TREND Histogram" for MT4, No Repaint. - TREND Histogram indicator is much more sensitive and efficient than any standard Moving Averages cross. - Indicator can be in 2 colors: Yellow (gold) for bearish trend and Green for bullish trend (colors can be changed in settings). - TREND Histogram has built-in Mobile and PC alerts. - It is great idea to combine this indicator with any other trading methods: Price Action, VSA, other indicators. - This histogram is one of the top

TradeInfo Heatmap Edition es una herramienta profesional de análisis visual para MetaTrader 4, diseñada para transformar el seguimiento de tu rendimiento en una experiencia clara, rápida e intuitiva.
A diferencia de los informes tradicionales, este indicador consolida todo tu historial de trading en un panel gráfico dinámico directamente en tu gráfico, eliminando la necesidad de exportar datos a Excel o plataformas externas.
Funcionalidades Principales: • Matriz de Rendimiento Anual y Mensual

A complete Smart Money Concepts workspace for MT4: market structure (BoS/CHoCH), a Liquidity Engine with confluence scoring, FVG/Order Blocks, volume profile, multi-timeframe context and an on-chart brief - on any symbol.
SMC Master Structure turns raw price into a clean, rules-based read of market structure and liquidity. It marks the swings, breaks and imbalances that Smart Money Concepts traders watch for, scores each setup for confluence, and keeps the picture organized on one chart - so yo

ELLIOT NEXUS PRIME - Professional Multi-Degree Elliott Wave Analysis for MT4
Elliot Nexus Prime is an advanced Elliott Wave analytical indicator for MetaTrader 4, developed to transform complex wave structure into a clear, structured and actionable market map.
The indicator combines multi-degree Elliott Wave inference, structural analysis, Fibonacci projections, Primary/Alternate scenarios, market structure and two independent analytical signal frameworks inside one professional chart interfa

Crypto_Forex Indicator "Hammer and Shooting Star pattern" for MT4, No repaint, No delay. - Indicator "Hammer and Shooting Star pattern" is very powerful indicator for Price Action trading. - Indicator detects bullish Hammer and bearish Shooting Star patterns on chart: - Bullish Hammer - Blue arrow signal on chart (see pictures). - Bearish Shooting Star - Red arrow signal on chart (see pictures). - With PC, Mobile & Email alerts. - Indicator "Hammer and Shooting Star pattern" is excellent to com

Gann Pulse is a non-repainting trend signal indicator for MetaTrader 4. When a bar closes it shows a clear BUY or SELL arrow and immediately draws the entry price, the Stop Loss and three Take Profit levels. No theory is needed: attach it to a chart and follow the signals.
The idea Two of W. D. Gann's classic rules are "never trade against the trend" and "always protect a trade with a Stop Loss". Gann Pulse follows both. Its proprietary momentum engine detects the moment when the pulse of the

**Know exactly where your grid or martingale basket blows up – before you trade it.**
Grid and Martingale Risk Simulator is a visual what-if tool for traders who use grids, martingale, averaging or hedged baskets. Place virtual BUY and SELL orders directly on the chart, drag them to any price, and the indicator recalculates your simulated account in real time: Balance, Equity, Margin, Free Margin, Margin Level, the Margin Call price and the Stop Out price.
The indicator never opens, modifies

Gaps draws the levels that higher timeframes leave behind, on any chart you trade from. The map comes from the broker's daily candles, so a 1-minute chart and a 4-hour chart show the same levels in the same places. Four level families, on monthly, weekly and daily candles Fair value gaps, wick zones, imbalances and overlaps, each drawn as a zone on your chart. Levels come from closed candles only. They never repaint into the past. Monthly, weekly and daily levels keep a clear hierarchy, so the c

BBMA REENTRY — SNR + DOTLINE + FIBO MUSANG 1. Tentukan Arah Trend Pastikan setup Reentry yang dicari searah dengan Trend Filter pada Panel . Utamakan BUY saat trend bullish dan SELL saat trend bearish . Hindari Reentry yang berlawanan dengan trend utama. 2. Cari Reentry pada Time Frame Besar Cari titik BBMA Reentry ketika candle masuk atau menyentuh area MA5/10 High atau MA5/10 Low . Time Frame besar menjadi acuan utama untuk menentukan area Reentry. 3. Gunakan Time Frame Konfirmasi yang Lebi

Kelly Criterion Risk Management Panel for MT4
A position-sizing and risk-audit tool based on the Kelly Criterion. It reads your closed-trade history on the current symbol, computes your real win rate and payoff ratio, and converts them into three actionable numbers: maximum lots you may open, how wide your stop can be, and how much risk you are carrying right now. Display-only. It never places, modifies, or closes trades.
PANEL LABELS (Chinese → English)

Crypto_Forex Indicator MACD Signal METER for MT4. - Very useful MACD Signal METER indicator is showing current MACD value (above/below Signal line) for 7 timeframes simultaneously. - Green rectangle - MACD is above Signal line. - Red rectangle - MACD is below Signal line. - Forex Indicator MACD Signal METER can be used as trade entry filter for Multi Time Frame trading systems. Click here to see high quality Trading Robots and Indicators! This is original product which is offered only on this

SMC Scanner – User Guide
Overview
SMC Scanner is a multi-symbol, multi-timeframe dashboard for MetaTrader 5. Every cell shows the key Smart Money Concepts state of one symbol on one timeframe. You can scan the whole market at a glance instead of opening every chart.
The SMC engine inside the scanner uses the same calculation logic as the Smart Market Structure Concepts chart indicator. With the same settings, each cell shows what the chart indicator would show on that symbol and timeframe.

See the market's fear level on the chart you trade. VixChecker shows the VIX (the volatility index often called the fear index) in a sub-window as one bar per day, colored by level: normal (blue), caution (yellow, 20 or above by default) and fear (red, 30 or above). The current value, the change from the previous close and the time of the value are shown in a small panel, and the value can also be shown on the main chart. Where the VIX values come from (please read before buying) The indicator d

MQL5 Blogs : https://www.mql5.com/en/blogs/post/776740 MT4 Version : https://www.mql5.com/en/market/product/199000 MT5 Version : https://www.mql5.com/en/market/product/199001
SUPPORT RESISTANCE PROFILE [tambangEA] is an advanced market-structure indicator designed to identify, evaluate, and rank dynamic Support and Resistance levels using a combination of price structure, volume-profile analysis, volatility, rejection behavior, and level interaction statistics. Unlike conventional Support and

Round numbers on your chart, and a notice when the price gets close. RoundNumberAlert draws horizontal lines at round numbers (150.000, 150.500 ...) and watches them for you. When the price enters the touch range, only that line blinks and you get one notification. Major round numbers stand out in gold, and a small panel shows how many pips are left to the next round number above and below. Features Round-number lines: the step starts at 10 pips (for example 50 pips: 150.000, 150.500 ...). Major

Entry signals as finger marks: yellow for trend-following, pink for counter-trend. SignRAMB combines RSI, ATR, MACD, a moving average, Dow theory and the candles, and marks the places where the price may turn up or down, based on past chart patterns. A finger pointing up is a buy, pointing down is a sell. Signals are decided on closed bars and never repaint. Signals are not always right. Use them as one indicator, together with your own reading of the chart. They are meant for the move right aft

Welcome Please note that I am currently uploading all my precious indicators. (It takes time with all the files, names, pics etc.) Feel free to ask questions.
This indicator works on all TFs and instruments, from AUDCAD to Gold (Any vehicle).
When price runs into one of these lines, then we would assume a reversal might happen. For Binary Options:
Imagine there is 2min 23 sec remaining of the chart candle, price hit the S/R line, then trade the remainder time.this chart is an M5 chart when pr

Crypto_Forex Indicator Acceleration Bar Pro for MT4 - able to catch huge trends. - Indicator "Acceleration Bar Pro" is very powerful tool for Trend trading - market flat influence is minimized. - Bullish Acceleration Bar (blue) is bar on chart which has Max higher than max of previous 5 bars and which has Min lower than min of next 5 bars. - Bearish Acceleration Bar (red) is bar on chart which has Min lower than min of previous 5 bars and which has Max higher than max of next 5 bars. - With PC

MarketFlow Indies MarketFlow Indies is a clean MT5 chart indicator designed to help traders read directional flow, confirmed Buy/Sell signals, market structure, reaction zones, and spread information in one simple visual workspace. The indicator focuses on chart clarity. Signals are displayed directly on the main chart with compact Buy and Sell labels, colored flow lines, optional structure marks, and a small dashboard for quick signal review. Expert Version MT5 : https://www.mql5.com/en/market

Which currency is strong right now — in one panel. CurrencyStrength takes the RSI of the 28 pairs of USD, EUR, JPY, GBP, AUD, CHF, CAD and NZD, turns it into a score from −100 to +100 for each currency, and shows them as bars, strongest first. Features Strength ranking: strong currencies in green, weak ones in red, scored from −100 to +100. Automatic symbol detection: the pairs are found from each symbol's base and profit currency, so suffixes and prefixes (EURUSD#, EURUSD.pro, m.EURUSD, EURUSDm

Liquidity Hunter is a liquidity and market structure indicator for MT4 and MT5 that only keeps the levels nobody has taken yet. A swing high stops being drawn on the bar that trades through it. Yesterday's high disappears the moment price clears it. What's left on the chart is the stops that are still sitting there. That matters more than it sounds. On GBPUSD H1 from January 2020 to September 2026, 97.8% of daily highs and lows were taken out, and half of them within about 14 hours of the new da

Volume Divergence Pro shows whether volume confirms the trend and marks regular and hidden divergences on price and indicator. Volume Divergence Pro measures the direction of price with linear regression over a fast and a slow window, and checks whether trading volume is supporting that move or fading away from it. Swings in the indicator are compared with swings in price to find divergences, which are drawn both in the indicator window and directly on the candles. How it works
The fast regressi

CISD - Change in State of Delivery indicator for MetaTrader 4. In Smart Money Concepts (SMC) and ICT methodology, a Change in State of Delivery (CISD) marks the moment price stops delivering in one direction and starts delivering in the other. It is often the first confirmation of a market structure shift (MSS) or change of character (CHoCH), and it usually appears before a classic break of structure (BOS) forms. This indicator detects CISD objectively on any symbol and timeframe, and shows the

SMT Divergence Multi Pair compares the swing highs and swing lows of the chart symbol with up to two correlated symbols and marks the places where they disagree. This is the Smart Money Technique (SMT) divergence used in ICT and Smart Money Concepts analysis: one market moves beyond a previous high or low while its correlated market does not confirm the move. How it works The indicator finds confirmed swing highs and swing lows on the chart symbol and compares each new swing with the previous on

Wave Markers: adaptive swing map with a multi-timeframe dashboard See the real structure of the market, not just noise: confirmed swing highs and lows, trend lines through them, and the picture on every timeframe from M1 to W1 in one panel. What is it? Wave Markers is a chart-structure indicator for MetaTrader 5. It finds the turning points of price (swing highs and swing lows), marks them with clean arrows, and builds the analysis tools around them: trend lines, a multi-timeframe table, live s

Auction Flow Pro — Market Context, Clearly Presented Auction Flow Pro brings volume profile, market heat, liquidity zones and VWAP into a clean MetaTrader 5 workspace. It is designed for traders who want to assess market conditions, review potential opportunities and keep important price areas visible without filling their charts with unnecessary clutter. The product combines an informative chart display with a compact, adjustable dashboard. Essential readings remain easy to access, while intera

MQL5 Blogs = https://www.mql5.com/en/blogs/post/776873 MT4 Version = https://www.mql5.com/en/market/product/199357 MT5 Version = https://www.mql5.com/en/market/product/199358
Pressure Breakout [tambangEA] is a professional MetaTrader indicator designed to identify price-pressure formations, evaluate directional dominance inside the formation, and confirm breakouts using a structured combination of wick behavior, volatility, volume proxy, and price expansion. Instead of reacting to a single can

RSI Panel Pro is a multi-timeframe RSI indicator for MetaTrader 4 that combines the traditional RSI, RSI EMA Signal, Momentum, an EMA trend filter, and an MTF summary panel. Its goal is to provide a quick overview of momentum, RSI levels, multi-timeframe trends, and the latest signals without the need to constantly switch between timeframes.
This indicator is best suited as a tool for signal confirmation and market context filtering; a single RSI signal should not be used as the sole basis for

Headline. One Entry. No Guesswork.
Subheadline
Three EMAs confirm the trend. MACD filters the noise. The steepness arrow fires your entry. That arrow is the only signal you'll ever act on.
THE PROBLEM
You've been here before.
You see a trend forming. You enter. It reverses.
You wait for confirmation. The move is already gone.
You pile on indicators. You get more signals. You get more confusion. You get more losses.
The problem isn't you. The problem is you have too many signals and none o

### Vertex Pulse MT4: Precision HYBRID Indicator
**Vertex Pulse** is an institutional-grade hybrid indicator engineered specifically for MetaTrader MT4. A volatility-adapted hybrid indicator for MetaTrader MT4 (Vertex Pulse) that pairs Average True Range (ATR) volatility expansion bands paired with tick volume surge filters to signal high-probability swing and momentum entries with real-time multi-bar execution signals and on-chart signal markers and terminal alerts.
---
### Key Capabilities

Confluence Meter: one consolidated rating from 26 indicators Confluence Meter calculates the signals of 26 popular indicators and merges them into a simple sell / neutral / buy rating. You don't have to open dozens of windows and compare readings by hand. One glance at the panel is enough to see which way the market is leaning on the selected timeframe. MT5-version: https://www.mql5.com/en/market/product/199466
Our products: https://www.mql5.com/en/users/trendhunter/seller What you see on the

Similar to the Sieera chart, the channel indicator is quite good. It can be applied to foreign exchange, gold, silver, and stock index futures. Using a 30-day SMA cycle, the outer track is 1.8 and the inner track is 1.4. Similar to the Sieera chart, the channel indicator is quite good. It can be applied to foreign exchange, gold, silver, and stock index futures. Using a 30-day SMA cycle, the outer track is 1.8 and the inner track is 1.4.

1. Descripción general
OTT Awesome Oscillator Alarm es un indicador para MetaTrader 4 (MT4) diseñado para detectar y alertar sobre
señales alcistas y bajistas basadas en el Awesome Oscillator (AO). El indicador incorpora tres estrategias
clásicas: Zero Line Crossover, Saucer y Twin Peaks.
Además de las señales visuales mediante flechas, el indicador puede generar avisos mediante ventana
emergente, sonido y notificación Push. El sistema está pensado para trabajar con la última vela cerrada y

Welcome Please note that I am currently uploading all my precious indicators. (It takes time with all the files, names, pics etc.) Feel free to ask questions.
Smart Volatility Matrix is an advanced multi-preset technical indicator designed for MetaTrader 4, engineered to map out market volatility dynamics across 9 distinct parameter blocks simultaneously in a clean separate window.
Overview Navigating changing market conditions requires more than a single moving average or standard band. The

Trend Consensus turns ten moving averages into one clear vote on trend direction across two timeframes. When both agree, it marks a non-repainting entry with ATR-based TP1, TP2, TP3 and stop levels, and tracks how every past signal on your chart played out. Built in: history statistics, a multi-symbol scanner, push and e-mail alerts, and buffers ready for your Expert Advisor. How it works Trend Consensus asks ten simple moving averages (periods 5 to 14) one question on every bar: are you rising

My Trading Checklist helps you bring structure to one of trading’s most demanding tasks: following your own rules consistently when money and emotions are involved. Trading involves probabilities. There is no “holy grail” system that can guarantee a 100% win rate. Even a carefully researched strategy can produce losing trades and uncomfortable losing sequences. The aim is to combine a strategy with positive expected value after trading costs with disciplined money and risk management, then apply

Where the volume traded, day by day: a volume profile for each day or session with its POC, value area high and value area low , and the naked POCs the market has not been back to, drawn to the right edge with their dates and prices. Built from one-minute bars on every timeframe, so the levels are the same on M5 and on H4, and a finished day's levels do not move. What it draws A profile for each day , or for each trading session, drawn for the last 10 by default ("Profiles drawn on the chart"):

ALMA Trend Target is an ALMA-based trend identification system that combines slope-normalized momentum confirmation with standard deviation band validation to determine trend state, and automatically generates a complete position planning framework on each trend flip including a structure-derived stop loss, R-multiple take profit targets with proximity highlighting, and a risk zone visualization that tracks target hits and stop events throughout the position's active lifecycle. How It Works ALM

Welcome Please note that I am currently uploading all my precious indicators. (It takes time with all the files, names, pics etc.) Feel free to ask questions.
FX777 Markov Heatmap V35 is an institutional-grade analytical indicator designed for MetaTrader 4, built around advanced multi-factor quantitative modeling and Markov state transition matrices to map out market regime shifts in real time[cite: 12].
Core Logic & Strategy: How to Use It Professional price action and Smart Money traders k

Welcome Please note that I am currently uploading all my precious indicators. (It takes time with all the files, names, pics etc.) Feel free to ask questions.
FX777 QUANTUM RSI: Sovereign Quantum Stability v8.0 Overview Step into the next tier of institutional-grade technical analysis with FX777 Quantum RSI (v8.0) . Moving far beyond traditional, lagging indicator models, this subwindow masterpiece integrates dynamic volatility-based gates with an advanced Persistence Engine , filtering out f

Welcome Please note that I am currently uploading all my precious indicators. (It takes time with all the files, names, pics etc.) Feel free to ask questions.
FX777 Iceberg Reversal V3 – Sales Description Overview The FX777 Iceberg Reversal V3 is an advanced MetaTrader 4 indicator built upon the FX777 Master Trading Protocol . Designed for elite precision, it identifies institutional order flow absorption, liquidity traps, and dynamic mean reversion extremes to deliver high-probability revers

Momentum Intelligence — MT4 Is the move gaining strength or running out of momentum? Momentum Intelligence brings market momentum and local structure onto one chart. A smooth price-linked gauge shows the current state, a histogram shows how it develops, and BUY/SELL arrows mark confirmed local structure changes. Use it to follow the move and identify when price confirmation appears. What you see on the chart A gauge anchored to a historical candle and the current price makes direction and changi

Reversal Intelligence — MT4 Spotting a potential reversal and knowing when it is confirmed are two different tasks. Reversal Intelligence puts both on your chart: a preparation zone, BUY/SELL confirmation and the LOW/HIGH extreme boundary. Choose a more active search, classic selection or an additional embedded trained-model filter through three operating modes. What you see on the chart Preparation zones help you notice a developing reversal setup. BUY/SELL confirmation follows a candle close b

Market Projection Pro — MT4 Want to visualize how the price cycles in your chosen chart section could extend? Market Projection Pro analyzes a historical window you select, extracts cycle components and draws a composite projection to its right. You control the source window and forward horizon to compare the scenario with price structure and potential turning zones. What you see on the chart Interactive boundaries let you select a historical analysis window directly on the chart. Cycle componen

Reversal Edge System is a professional top-bottom reversal indicator built for MetaTrader 5. It identifies potential trend reversal zones and generates clear trade signals, filtered by multi-timeframe trend analysis to reduce false setups. The indicator displays market sentiment in real time: Strong Bullish Strong Bearish Bullish Bias Bearish Bias Bull-Bear Divergence Each signal comes with predefined Take Profit and Stop Loss levels for proper risk management. It includes signal backtest functi

Institutional Checklist You know your rules. The difficult part is following them when you want the trade. The market starts moving. One indicator looks convincing. Another disagrees. You feel the pressure to act—and suddenly, the conditions you carefully defined yesterday become negotiable today. Institutional Checklist brings your attention back to your process. This interactive indicator for MetaTrader 4 guides you through your own analysis, one component at a time, then combines your answers

Trendlines drawn for you — and a good shape kept as your basis. TrendLineSnap finds the swing highs and swing lows on your chart, joins them and draws one high trendline and one low trendline. Triangles, channels, wedges and horizontal levels used in line trading show up as lines. Automatic trendlines are redrawn whenever a new swing forms. When you see a shape you want to trade, save it. The saved line does not move. When the price comes near it again, show the saved line next to the current li

Where is the price inside the range — in one panel. BoxRangeSnap looks for price zones where the highs and lows touched the same top and bottom again and again, and draws them as a big box and a small box. The panel keeps showing the distance from the price to the top and bottom of the current box. Features Automatic range boxes: a big box and a small box, newest first. The current box is highlighted and extends to the last closed bar. Adjustable detection: minimum touches on the top and bottom,

Reversal Edge Prime Reversal Edge Prime is a comprehensive and highly visual trading tool designed to automatically identify high-probability Reversal and Continuation zones. What sets this indicator apart is its ability to provide a complete, ready-to-use trading plan right on your chart—showing you exactly where to enter, where to place your stop loss, and where to take profit. The indicator is strictly non-repainting (signals are confirmed on candle close) and is incredibly easy to use for bo

Crypto_Forex Indicator HTF MOVING AVERAGE for MT4. - Upgrade your trading methods with the professional HTF MA Indicator for MT4. HTF means - Higher Time Frame. - This indicator is excellent for Trend Traders with Price Action entries. - HTF MA Indicator allows you to attach Moving Average from Higher time frame to your current chart in order to follow the main trend direction. - Indicator shows the trend from higher time frame --> this is always profitable method. - HTF MA Indicator gives oppo

Advanced custom Crypto_Forex indicator "Adaptive Trend Oscillator" - efficient auxiliary Trading tool for MT4! No repainting. - This indicator is a New generation of Oscillators - see pictures to check how to use it in combination with Major Trends. - It has adjustable adaptive OverSold/OverBought zones. - This oscillator is an auxiliary tool to find exact entry points from OverSold/OverBought areas into the direction of main trend. - OverSold zone: below the Green line. - OverBought zone: abov

Price Action Scanner PRO is a multi-symbol and multi-timeframe candlestick pattern scanner for MetaTrader 4 . The indicator helps traders save time by monitoring multiple instruments and identifying recent Price Action formations from a single chart. Detected patterns are displayed in a compact dashboard , with direct navigation to the corresponding signal candles. Supported Price Action Patterns The scanner detects five candlestick formations: Pin Bar — bullish and bearish candles with a promi

テクニカル指標開発の第一人者であるトム・デマークが考案した TDシーケンシャルは、 トレンドの転換点を判断するのに有用なインディケータです。このインディケータは TDシーケンシャルを裁量およびEAで実際に利用してきた私自身の経験から、より手軽に、かつ効果的に活用できるよう作成された裁量トレード用サインツールです。
この TDシーケンシャルをSupply and Demandと合わせて利用できるのがこのツールの最大の特徴です。例えば価格がDemandゾーンにあるときに TDシーケンシャルのシグナルが出ればより高い精度で反発が期待できます。
また、強いトレンドが生じている際に多くのだましが生じるのはTDシーケンシャルの弱点と思われますが、これを克服するために強力なフィルターを装備しています。また、最も有効と思われるセットアップ9に絞ってサインを発信します。
全通貨ペア、全タイムフレームで利用できます。勝敗判定機能により、このインディケータの直近の相場環境に対する有効性を確認できます。
設定項目は下記のとおりです。 Long...Long方向のシグナルを有効にします。Go

FXB Confluence Engine follows the trend with a range filter and, each time that trend turns on a closed bar, scores how much of the market agrees with the new direction. Momentum and the EMAs, four other timeframes, a higher-timeframe bias, the same filter at two wider settings, volatility, RSI and volume each add points, and a choppy market takes points away. A BUY or SELL prints only when the score reaches your minimum and every filter you have switched on is open. A dashboard on the chart sh

Range Zones M30 draws zones on your chart where price was pushed back hard on the 30-minute timeframe. It works on any symbol and any chart timeframe, and reads only the prices your terminal already has. It does not use any server, does not send anything out, and does not open or change orders. What It Shows A resistance zone above the market and a support zone below it, as filled rectangles that start at the open of the swing candle that formed them and run to the right. At any moment there is

Angora Patterns finds, draws and tracks chart patterns for you. It recognises 23 classic chart patterns, 8 harmonic patterns and 13 candlestick patterns, and gives every pattern a breakout level, a target, an invalidation level, a state and a quality score. Chart patterns: Double Top and Bottom, Triple Top and Bottom, Head and Shoulders, Inverse Head and Shoulders, Rounding Top and Bottom, Ascending, Descending and Symmetrical Triangle, Rising and Falling Wedge, Rectangle, Ascending and Descend

### Crossfire Pro MT4: Precision HYBRID Indicator
**Crossfire Pro** is an institutional-grade hybrid indicator engineered specifically for MetaTrader MT4. A volatility-adapted hybrid indicator for MetaTrader MT4 (Crossfire Pro) that pairs Average True Range (ATR) volatility expansion bands paired with tick volume surge filters to signal high-probability swing and momentum entries with signals evaluated strictly on closed bars to prevent repainting and on-chart signal markers and terminal alert
The MetaTrader Market is the only store where you can download a free demo trading robot for testing and optimization using historical data.
Read the application overview and reviews from other customers, download it right to your terminal and test a trading robot before you buy. Only on the MetaTrader Market you can test an application absolutely free of charge.

You are missing trading opportunities:
- Free trading apps
- Over 8,000 signals for copying
- Economic news for exploring financial markets
Registration
Log in
You agree to website policy and terms of use
If you do not have an account, please register