Смотри обучающее видео по маркету на YouTube
Как купить торгового робота или индикатор
Запусти робота на
виртуальном хостинге
виртуальном хостинге
Протестируй индикатор/робота перед покупкой
Хочешь зарабатывать в Маркете?
Как подать продукт, чтобы его покупали
Бесплатные технические индикаторы для MetaTrader 4 - 12
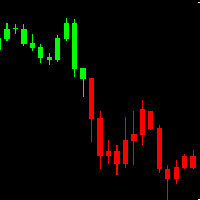
AH Candles MT4 AH Candles MT4 is a new product that allows identifying the current market phase (uptrend and downtrend ).
This indicator paints bars in different colors depending on the current state of the market trend ( Green and Red )
AH Candles MT4 is use for trading currencies
Advantages Suitable for intraday and swing trading. The indicator base on EMA method to calculate Period Parameters It can be used as a standalone tool or together with other indicators.
How to use
FREE
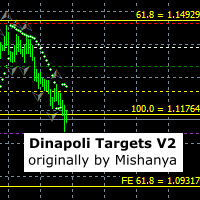
This indicator sets stop, start and target 1, 2 and 3 levels based on detected market swings on multiple timeframes. It was originally written by Mishanya and has been updated by Ramoletane to move with the price and automatically update the levels. A trade can be placed when price has crossed the white start line and stop loss placed on the red stop line. The lot size can be reduced at the green target 1 level, the yellow target 2 level and the position finally closed at target 3. Most of the t
FREE
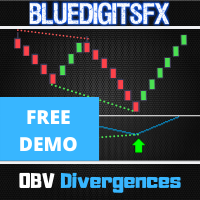
NOTE : This Free version only works for the EURUSD & AUDUSD Symbol !
MT4 Version Available Here: https://www.mql5.com/en/market/product/48040
MT5 Version Available Here: https://www.mql5.com/en/market/product/50538
Telegram Channel & Group : https://t.me/bluedigitsfx
V.I.P Group Access: Send Payment Proof to our Inbox
Recommended Broker: https://eb4.app/BDFXOsprey
* Non-Repainting Indicator To Trade Divergences for any Newbie or Expert Trader ! BlueDigitsFx's OBV Divergence
FREE

Индикатор полностью основывается на классическом индикаторе MFI. Рекомендую посмотреть моего советника - Night Zen EA В нем заложены две базовые стратегии торговли: Выход линии MFI из зон перекупленности/перепроданности. Вход линии MFI в зоны перекупленности/перепроданности. Стрелки рисуются после подтверждения сигнала по стратегиям и не перерисовываются. Также прописаны оповещения: Алерты Push-уведомления в мобильный терминал email Подпишись на мой telegram канал, ссылка в контактах моег
FREE

Данный индикатор включает в себя различные виды скользящих средних. Индикатор содержит в себе следующий набор скользящих средних: CA (Кумулятивная скользящая средняя) MIN (Минимум за период) MAX (Максимум за период) SMA (Простая скользящая средняя) EMA (Экспоненциальные скользящее среднее) DMA (Двойное (двукратное) экспоненциальное скользящее среднее) TMA (Тройное (трёхкратное) экспоненциальное скользящее среднее) LWMA (Взвешенное скользящее среднее) SMM (Простая скользящая медиана) SMMA (Сглаже
FREE

Индикатор уровней на основе индикатора Zig-Zag - это высокоточный инструмент для торговли на Forex, который поможет вам улучшить вашу стратегию и принимать более точные решения. Он использует алгоритм Zig-Zag для определения различных уровней поддержки и сопротивления на рынке, исходя из чего можно определить, когда лучше всего войти или выйти из сделки. Этот индикатор обладает высокой производительностью и точностью в расчете уровней, что позволяет трейдерам получать максимальную прибыль при ми
FREE

Key Features: Type of Indicator: Line Break Chart Indicator Usage: Identifying trend reversals and potential market turning points. Input Parameters: The primary input parameter is 'Lines_Break,' which represents the number of lines the price needs to move to create a new line in the opposite direction. How it works: The indicator draws green and red histogram bars to represent the line break chart. Green bars indicate an upward trend, and red bars indicate a downward trend. The indicator calcul
FREE

ON Trade Индикатор свечного паттерна Марубозу Паттерн Марубозу — мощный и прямолинейный свечной паттерн, который может предоставить ценную информацию о настроениях рынка и потенциальных разворотах тренда. Он характеризуется свечой с очень маленькой или отсутствующей тенью (килец) на одном конце и длинным телом, простирающимся в направлении текущего тренда. Этот паттерн указывает на сильный дисбаланс между покупателями и продавцами, что подразумевает, что движение на рынке сильно одностороннее. О
FREE

KF Trix V1.00 The triple exponential average (TRIX) indicator is an oscillator used to identify oversold and overbought markets and is also a momentum indicator. The triple smoothing of moving averages is designed to filter out price movements that are considered insignificant or unimportant. About Software details and MQL login link Copyright 2022, Forex KRAL
FREE

Broken Trends - индикатор для скальперов и интрадейщиков. В режиме реального времени он подбирает и показывает на графике трендовые линии. Индикатор реагирует на импульсы цены: поиски трендов начинаются как только амплитуда импульса превысит порог, задаваемый специальным параметром. Также индикатор может подавать звуковые сигналы при пересечении ценой актуальной трендовой линии. В обычном режиме индикатор показывает только по одному (последнему найденному) восходящему и нисходящему тренду, но им
FREE

This indicator is designed to find the difference in MOMENTUM price and indicator. This indicator shows the price and indicator difference on the screen. The user is alerted with the alert sending feature. Our Popular Products Super Oscillator HC Cross Signal Super Cross Trend Strong Trend Super Signal Parameters divergenceDepth - Depth of 2nd ref. point search Momentum_Period - Second calculation period indAppliedPrice - Applied price of indicator indMAMethod - MA calculation method findEx
FREE
Highly configurable RSI indicator. Features: Highly customizable alert functions (at levels, crosses, direction changes via email, push, sound, popup) Multi timeframe ability Color customization (at levels, crosses, direction changes) Linear interpolation and histogram mode options Works on strategy tester in multi timeframe mode (at weekend without ticks also) Adjustable Levels Parameters:
RSI Timeframe: You can set the current or a higher timeframes for RSI. RSI Bar Shift: you can set
FREE
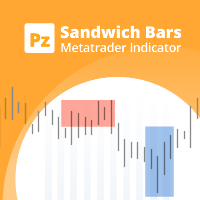
Данный индикатор определяет паттерны Sandwich Bars по нескольким диапазонам, весьма надежные паттерны пробоя. Просто и эффективен в использовании Настраиваемые диапазоны баров Настраиваемый выбор цвета В индикаторе предусмотрены визуальные/почтовые/push/звуковые уведомления. Индикатор не перерисовывается и не рисует на истории Паттерн Sandwich состоит из одного бара, поглощающего несколько прошедших баров, пробивая и отклоняя весь ценовой диапазон. Синяя рамка - бычий пробой Красная рамка - медв
FREE

MASi Three Screens основан на торговой стратегии Доктора Александра Элдера. Данный индикатор является сборником алгоритмов. Алгоритмы основаны на анализе графиков нескольких таймфреймов. Вы можете применить любой из предоставленных.
Список версий алгоритмов ThreeScreens v1.0 - Простая реализация, с анализом MACD линии; ThreeScreens v1.1 - Простая реализация, с анализом MACD гистограммы; ThreeScreens v1.2 - Совмещение двух первых алгоритмов в одной версии; ThreeScreens v1.2.1 - В алгоритм внедр
FREE

Целью этой новой версии стандартного MT4 индикатора, входящего в поставку платформы, является отображение в подокне нескольких таймфреймах одного и того же индикатора. См. пример, приведенный на рисунке ниже. Однако индикатор отражается не как простой индикатор MTF. Это реальное отображение индикатора на его таймфрейме. Доступные настройки в индикаторе FFx: Выбор таймфрейма для отображения (от M1 до MN) Установка ширины (количество баров) для каждого окна таймфрейма Всплывающее оповещение/звуков
FREE
Easily track and trade with the trend using this indicator. Uses a circle and line to indicate the trend direction. Excellent for channels. Features alert function.
Parameter TrendPeriod can be changed to your preference. How to use: Simply attach to any chart. Blue circle plus blue line cross below price = Buy. Red circle plus red line cross above price = Sell. Best results when taking higher time frames into consideration before entering a trade. (Hint: Wait for the radar/circle to appear on
FREE

Chart Time — очень простой индикатор, но он может быть очень важным помощником для контроля времени перед открытием сделки вручную. В индикаторе есть три варианта отображения времени на графике.
Входные параметры Show Time : выбор вариантов отображения времени. Local Time (локальное время компьютера), Server Time (время сервера брокера) или GMT. Рекомендации: Индикатор надо запускать на каждом необходимом графике.
FREE

The Flag Streamer Pattern indicator is an indicator designed to find flag and pennant patterns. When the legend finds patterns, it draws lines on the graph screen. Magenta lines represent the streamer pattern. Aqua colored patterns represent the flag pattern. You can change the pattern colors according to your request. Our Popular Products Super Oscillator HC Cross Signal Super Cross Trend Strong Trend Super Signal Parameters fs- =======Channel Trend Setting===== Channel - Channel period setting
FREE

MACD divergence Simple edition 原始MACD计算方式,升级为双线MACD,使判断更加直观更加贴合大宗交易平台的研究习惯,同时还会自动用实线标出背离,不用再从0开始苦学钻研。
同时,我还提供了提醒服务,在你忙于家务无暇顾及的时候只需要打开音响,一旦达成背离,第一时间就会让你知晓。
这是一款简单版的看背离指标,MACD的九天均线被称为“信号线”,然后绘制在MACD线的顶部,它可以作为买入和卖出信号的触发器。当MACD越过信号线时,交易员可以买入操作,当MACD穿过信号线以下时,交易者可以卖出或做空操作。移动平均收敛-发散(MACD)指标可以用几种方法解释,但更常见的方法是交叉、散度和快速上升/下降。
FREE

Индикатор основан всего на одной Moving Average, указанного вами периода. Анализируя движение цены относительно этого MA, а так же отслеживая все обновления максимумов и минимумов ценой за тот же период что и период MA - рисует свою картину тренда, избегая вечно переламывающихся линий MA. По этому, если тренд идёт вверх, то и линия смотрит вверх и не меняет своего направления, даже на небольших коррекциях, позволяя поймать почти весь тренд, если вы вошли правильно. Закрывать позиции рекомендуетс
FREE

The "Trend Edges" indicator determines whether the trend is rising or falling. It is suitable for any time frame (tested on DAX).
The indicator should be treated like Bollinger Bands, meaning that if it breaks out upwards, you can buy with a stop loss below the lower edge.
Find a trending pair, index or CFD. Additionally :
-Sound alert on trend change.
-Alert Notification
-Alert Notification on your mobile phone Check my other indicator "Trend Edges histogram"
FREE

Key Price Levels Indicator Indicator that shows the highs and lows for the significant price levels for past periods that could be potentially considered as reaction levels. The indicator displays the following price levels: Yesterday high and low The day before yesterday high and low Two days back high and low Last week high and low Last month high and low Last three month high and low (Quarter) Last year high and low
FREE

EMA Separation рисует 2 экспоненциальные скользящие средние, и заполняет пространство между ними. Цвет заполнения выбирается в зависимости от направления тренда: восходящий (EMA с коротким периодом выше EMA с длинным периодом) или нисходящий (EMA с коротким периодом ниже EMA с длинным периодом) Это небольшой инструмент для помощи в визуализации разницы между средними с длинными и короткими периодами. Надеемся, он вам понравится. EMA Separation также можно сочетать с бесплатным инструментом EMA S
FREE
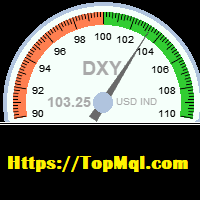
This indicator is used to calculate the dollar index according to the formula of currency pairs(EURUSD ,GBPUSD,USDJPY,USDSEK,USDCHF,USDCAD)Even if the broker does not have the dollar symbol. this Indicator displays the dollar index chart in a separate window at the bottom of the chart. It also displays the current dollar index graphically. In this indicator, it is possible to set the minimum and maximum value of the indicator as well as its size scale on the chart as an input parameter, and it
FREE

Введение в алгоритм GARCH Improved Nelder Mead GARCH - это сокращение от Generalized Autoregressive Conditional Heteroskedasticity (Обобщенная авторегрессионная условная гетероскедастичность). Представляет собой модель прогнозирования волатильности, обычно применяемую в финансовой сфере. Модель GARCH впервые появилась в работе датского экономиста Тима Петера Боллерслева (Tim Peter Bollerslev) в 1986 году. Лауреат Нобелевской премии 2003 года Роберт Ф. Энгл внес огромный вклад в усовершенствовани
FREE

Moving Average Dashboard Bars ago - это уникальная мультивалютная, мультитаймфреймовая панель. Эта панель очень проста. Выбираете две скользящие средние, инструменты и таймфреймы После этого, панель Moving Average Dashboard Bars показывает сколько баров назад скользящие средние совершили бычье или медвежье пересечение. Он также в реальном времени показывает наличие бычьего или медвежьего пересечения. Индикатор рисуется в подокне. Панель Moving Average Dashboard Bars ago может быть полезна при то
FREE
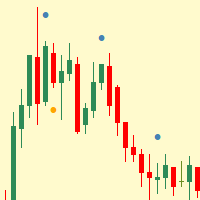
Simple indicator that shows internal (inside) bars.
Internal bars are probably one of the best price action setups to trade Forex with. This is due to the fact that they are a high-chance Forex trading strategy. They provide traders with a nice risk-reward ratio for the simple reason that they require smaller stop-losses compared to other setups. They can also be successfully utilised as reversal signals from key chart levels. Inside bar is a series of bars contained within the range of the c
FREE

Индикатор на основе (Williams` Percent Range) анализирует касания сигнальной линии по стенкам канала и формирует зоны для принятия решения о направлении хода цены. Для удобства встроена функция оповещения. Также можно включать и отключать искомые зоны. На одном графике можно использовать несколько индикаторов с разными настройками. Это поможет подобрать оптимальную стратегию.
FREE

1. Месячные, недельные и дневные опорные точки рассчитываются с начальными и конечными данными для каждого периода.
2. Это обеспечивает простую линию на графике, чтобы определить, где находятся опорные точки и уменьшить погрешность расчета.
3. Индикатор поможет очень быстро определить основные опорные точки инструмента, даже если вы не понимаете, как рассчитать опорные значения.
4. Вы также можете сравнивать недельные и дневные пивоты, чтобы лучше понять положение цены.
5 Этот индикатор
FREE

The Sextet is an MT4 indicator that displays 6 levels of Moving Averages, where the second is the moving average of the first, the third of the second, and so on. It gives a signal when all the moving average levels align in order. Get a Free Sextet EA, and read discussions about using The Sextet Indicator on Forex Factory:
The Sextet EA @ Forex Factory Check out the The Sextet Scalper Pro for a more elaborate scalping strategy also with Free EA . Key Features: Is a Moving Average of a Movi
FREE

RaysFX StochRSI Presentiamo un indicatore MQL4 sviluppato da RaysFX, un rinomato sviluppatore nel campo del trading algoritmico. Questo indicatore è una combinazione semplice ma potente di due indicatori popolari: RSI e Stocastico. Caratteristiche principali: RSI : Un indicatore di momentum che misura la velocità e il cambiamento dei movimenti dei prezzi. Stocastico : Un indicatore di momentum che confronta il prezzo di chiusura di un titolo con la gamma dei suoi prezzi durante un certo periodo
FREE

Suitable for multi time frame market direction prediction. Green and red color indicate the buy and sell call respectively. Green indicator is denote buy call and Red indicator denote the sell call. push notification is available to send instant message to you when green or red indicator will be appear. you have to activate the option at the time of mapping this indicator to you chart
FREE

Линия безубыточности от MMD
Линия безубыточности является полезным индикатором для людей, использующих стратегии, допускающие одновременные сделки в обоих направлениях, такие как методология MMD. Этот индикатор полезен при игре статистических моделей и усреднении позиций в зонах накопления и распределения. Индикатор строит уровни, суммируя позиции в три группы: позиции входящие в ПОКУПКУ, позиции входящие в ПРОДАЖУ и все включенные позиции.
Описание функционала:
Show BUY BELine - показыва
FREE

Удобное рисование параболических каналов по четырем точкам (два нижних и два верхних экстремума).
Дополнительные клавиши управления:
N (New) - Начать рисовать новый канал. С (Clear) - Удаление текущего канала. По умолчанию текущий канал - это последний канал. Но можно кликнуть на линию любого канала, чтобы он стал текущим.
Нажимайте на шестеренке в правом верхнем углу, чтобы установки некоторых параметров всех каналов или текущего канала.
Вся работа видна из анимационного Gif.
Не заб
FREE

BuySell Volume is an indicator that approximates Buy and Sell volumes based on price movement. Input Description: applied_model: Choose the applied model. In low reversal mode, price is considered receive low bearish pressure during bullish candle's creation (high bearish pressure on high reversal model. In other words, Bullish Marubozu candles has really high Buy Volumes in low reversal model than in high reversal one.
Output Description: Buy and Sell Volume: Determines how many Buy and Sell v
FREE
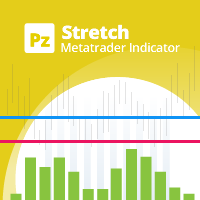
Индикатор Stretch – ценовая модель Тоби Крэйбела (Toby Crabel), которая находит минимальное среднее значение ценового движения/отклонения от цены открытия в определенный период времени и рассчитывает два уровня прорыва для каждого торгового дня. Расчет производится с помощью 10-периодной простой скользящей средней (SMA), представляющей собой абсолютную разницу между ценой открытия и ценовым максимумом или минимумом (в зависимости от такого, какое из значений меньше). Полученный результат использ
FREE

Introducing MACD Jurik—an advanced indicator designed to enhance your forex trading strategy by integrating custom moving averages based on the Moving Average Convergence Divergence (MACD) with the MetaTrader 4 indicator, MACD.
Jurik moving averages are renowned for their accuracy and reliability in analyzing price movements in the forex market. They offer traders smoother representations of price action, reducing noise and providing clearer signals for identifying trends and potential revers
FREE

KFX SMA: Symbol Changer + Moving Average (3x) + ATR + RSI + Candle Timer.
This indicator allows you to create a Symbol list and change between symbols of the current chart or Timeframe by selecting the appropriate button. On Chart there are three(3) multi timeframe Moving Averages shown (selected by you), ATR Value MTF ( selected by you - helps with setting SL and TP), RSI Value MTF (selected by you) and a Candle Timer. Features: - Symbol Changer : Change Symbol and Timeframe of Chart. (
FREE

Индикатор отображает бары в системе High-Low-Close ( HLC ). Имеется возможность выделять бары с увеличенным объемом. Простые понятные настройки цвета, толщины баров. Входные параметры Width Line – толщина баров. Color Down Bar – цвет медвежьего бара. Color Up Bar – цвет бычьего бара. Color Undirected Bar – цвет ненаправленного бара. Volume Level (0-off) – уровень объема для показа бара с увеличенным объемом (0-отключено). Color Volume Bar – цвет бара с увеличенным объемом.
FREE

A simple and highly effective Strength and Weakness currency indicator that can be used to aid your fundamental and technical analysis for winning trade decisions.
The indicator is very easy to use and can be applied to all time frames.
FX Tiger uses an advanced algorithm to calculate a score table for all major currencies. Each major currency will have a score from 7 to -7. A score of 5 and above indicates currency strength and a score of -5 and below indicates currency weakness. Once you
FREE

RaysFX Market Trend Histogram Il RaysFX Market Trend Histogram è un indicatore personalizzato per la piattaforma di trading MetaTrader 4. Utilizza il Commodity Channel Index (CCI) per identificare le tendenze del mercato e visualizza queste informazioni in un istogramma intuitivo. Caratteristiche principali: Identificazione delle tendenze: L’indicatore calcola il CCI per ogni periodo di tempo e lo utilizza per determinare se il mercato è in una tendenza al rialzo o al ribasso. Visualizzazione
FREE

Signals and Alerts for AMA (Adaptive Moving Average) indicator based on these MQL5 posts: Adaptive Moving Average (AMA) and Signals of the Indicator Adaptive Moving Average . Note : this tool is based on the code of AMA indicator developed by MetaQuotes Software Corp.
Features The signals are triggered at closing of last bar/opening of a new bar; Any kind of alerts can be enabled: Dialog Box, Email message, SMS notifications for smartphones and tablets, and Sound alerts; Customizable
FREE

Pattern Explorer – надежный инструмент для применения всех возможностей самых популярных свечных паттернов . Для подтверждения всех паттернов используются алгоритмы машинного обучения. Выберите тейк-профит и стоп-лосс и нажмите кнопку Backtest your strategy (протестировать стратегию на истории) для тестирования стратегии на истории в реальном времени и увидеть следующие данные (в зависимости от настроек): Общее число сигналов Сигналы, достаточно надежные для тестирования Прибыльные сигналы (%) У
FREE

SmartChanelFree - универсальный индикатор для всех типов рынка. Данный индикатор должен иметь в своем арсенале каждый трейдер, так как он представляет собой классический подход к анализу цены торгового инструмента и является готовой торговой стратегией. Индикатор формирует верхний, средний предел движения цены. Внимание !!! Эта версия индикатор ознакомительная и работает только на графике с периодом M1. Полную версию индикатора можно посмотреть по адресу: https://www.mql5.com/ru/market/product/3
FREE

Индикатор Special Trend Oscillator обнаруживает изменения тренда и измеряет силу текущего тренда. Продукт представляет собой разновидность MACD. Индикатор располагает двумя каналами. Синий канал обозначает верхнюю линию восходящего тренда. Красный - нижнюю линию нисходящего тренда. Покупайте, когда трендовая линия достигает красной линии. Продавайте, когда трендовая линия достигает синей линии.
Параметры Fast_Period - быстрый период. Slow_Period - медленный период. Channels - расстояние между
FREE
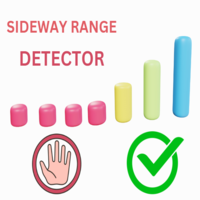
This indicator uses a formula based on bollinger bands to determine if the market is in Range or not. It can be used to filter entries and not operate in a sideways market.
It has a minimum value of 0.2 from which it could be operated, although you can modify it in the options to adjust it to your trading style or the market you use.
If the histogram below is red, the market is in range, if it is green, volatility is higher.
FREE

It's a simple indicator based on Moving Average. It's still a beta version. Good for a Day trader to identify market movement. No Repaint but It doesn't mean that all signals should be a win. There are no trading rules which you can gain 100%. You have to accept the losses.
Recommendations: 5 or 15 Min Any Pair Try to switch the timeframe 5 or 15 to find out best TF for your pair. Tips - Don't forget to set SL and TP. Thank you.
FREE

ATR Moving Average draws a moving average of the standard Average True Range( ATR ) in the same window.
Settings Name Description ATR period
Set Price per iod for ATR calculation
ATR level Set ATR value for thresholding( only whole number, ignore leading zeros e.g. 0.00089 = 89 ) MA Period Set moving Average Period MA Method Set moving average method( Simple, Exponential, Smoothed and Linear Weighted ) MA Shift
Set moving average shift
Enable Alerts ? Generate Alert when ATR Cr
FREE

EMA Separation Coefficient отражает разделение между краткосрочным и долгосрочным сопротивлением тренда экспоненциальной скользящей средней, а также направление текущего движения. Обратите внимание на потенциальные точки пересечения при приближении коэффициента к нулю. Это может свидетельствовать о предстоящем пробое или развороте. Ждите подтверждения тренда перед открытием сделки, а выходите, когда коэффициент образует максимум (для колл) или минимум (для пут). Это небольшой инструмент для помо
FREE

FZR indicator determines fractal zigzag reversal pattern of all the time frames of the chosen symbol and shows the information in the Info label. Indicator draws the detected pattern in the chosen time frame and also you can select in the menu to draw the trend line according to FZR peaks. What it is FZR? See the first picture in the screenshots. As you can see for every peak of FZR the AO indicator must cross zero line. FZR indicator determines the trend direction.
How to use FZR for trading?
FREE

"Drivers Road Bands" indicator that is designed to be used in the 1H, 4H and 1D timeframes in the most ideal way. If we compare timeframes to roads and streets; main streets and highways with high traffic volume are similar to high-time timeframes in technical analysis. If you can interpret the curvilinear and linear lines drawn by this indicator on the graphic screen with your geometric perspective and develop your own buy and sell strategies; you may have the key to being a successful trader.
FREE

Fibonacci SR Indicator Индикатор рисует линии поддержки и сопротивления. Продукт основан на уровнях коррекции и расширения Фибоначчи (Fibonacci Retracement and Extension levels). Индикатор учитывает многочисленные комбинации уровней Фибоначчи и рисует линии поддержки/сопротивления. При этом в расчетах используются значения вершин и оснований, построенных индикатором ZigZag. При необходимости ZigZag также может быть отображен на графике. Индикатор учитывает многочисленные комбинации предыдущих то
FREE

Panda Oscillator - новый авторский индикатор предназначенный для скальпинга . Индикатор дающий сигналы на основе показаний целого комплекса стандартных и авторских инструментов.
Основные характеристики Panda Oscillator : Аналитические функции Может использоваться на любых валютных парах и тайм-фреймах; Индикатор не перерисовывается; Отлично подходит дополнением к другим индикаторам; Графические возможности Занимает минимальное кол-во места на графике; Гибкие настойки; Легкий в усвоении;
FREE

Ska ZigZag Line indicator determines the overbought and oversold regions within a trend. The indicator determines the overbought region by the candlestick high and the oversold region by the candlestick low in a form of a line. To utilize the full strategy i recommend using "Ska ZigZag Line" together with "Ska ZigZag BuySell". NOTE: This indicator is a line based indicator. HOW TO USE: Sell Signal; Place a sell trade when the Ska ZigZag BuySell indicator arrow appear on top of the Ska ZigZag Lin
FREE

SKAN This indicator helps you to scan all symbols which are in the Market Watch window and filter out a trend with alerts. It works on five most effective indicators which are used by most of traders for trading: Moving Average Super Trend (ST) Bolinger Band (BB) OPRC BFD It calculates two bars for scanning. When box colour changes to coral or royal blue colour, it indicates you for trend change for long and short entry. And also you will get alert on screen. When it changes to royal blue, it
FREE

Индикатор предназначен для расчета стоимости пунктов в указанных размерах лота. Версия для MT5 здесь https://www.mql5.com/ru/market/product/29230 Построчное описание Строка 1 - валюта депозита. Строка 2 - размер лота (10 входных параметров) . Далее весь расчет стоимости ведется в столбец, под каждым лотом. Строка 3 - расчет стоимости для одного пункта. Строка 4 - расчет стоимости для спред. Все последующие строки - расчет стоимости для пунктов (20 входных параметров) . Все, что Вам нужно сделат
FREE

I was looking for a lean symbol changer. I could not find any. Normally other products hide lot's of screen space. So I developed a very lean symbol changer Just click on the 2 currencies you want to combine. The order does not matter. If you miss some pairs, you can add up to 5 custom symbols. Please make sure, your broker support your custom symbols. Drag an drop the panel with the green button.
In future I plan to include suffix and prefix als well.
FREE

С помощью данного инструмента теперь нет необходимости проверять волатильность интересующих вас валютных пар на сторонних вебсайтах с целью определения среднего диапазона движения цены. Индикатор Truly Volatility предназначен для определения волатильности и расчета среднего движения цены в часовой, либо дневной период. Данные отображаются в отдельном окне в виде гистограммы и текстовых значений. Использовать индикатор можно как альтернативу тому же ATR, но возможностью более детального анализа.
FREE

Supertrend Moving Average A combination of Supertrend and Moving Average to create a converging trade setup Input parameters: signal mode: set it to true if you want to plug it into STAT (Signal Tester and Trader) arrow shift: distance between fast EMA line to arrow on chart turn on moving average signal for converging setup supertrend period ATR multiplier Moving average period Averaging method Pricing You can find the best setting for 4 hour EURUSD on this video
FREE

Th3Eng Panda trend is a powerful indicator that works perfectly for scalping trades as well as swing trades. Th3Eng Panda trend is not just an indicator, but a very good trend filter. You can setup it on H4/H1 to Find the main trend and start scalping on M5/m15/m30 Time Frames. Works with all pairs and all Time Frames.
Inputs:
Section #1 History : Maximum number or bars to draw the last signals. (Default 5000) Draw Candles : Draw red candle when sell signal and green when buy signal. (tr
FREE

Highly configurable CCI indicator. Features: Highly customizable alert functions (at levels, crosses, direction changes via email, push, sound, popup) Multi timeframe ability Color customization (at levels, crosses, direction changes) Linear interpolation and histogram mode options Works on strategy tester in multi timeframe mode (at weekend without ticks also) Adjustable Levels Parameters:
CCI Timeframe: You can set the current or a higher timeframes for CCI . CCI Bar Shift: you can se
FREE

Search for an entry with low risk for trading by Lisek Waves Indicator. Using Lisek Waves Indicator can improve your trading performance. In it’s simplest form, this trading tool make it easy to s earch for an entry with low risk and to manage your trade and risk. Lisek Wave analysis is based on the notion that markets follow specific patterns called waves which are the result of a natural rhythm of crowd psychology that exists in all markets. You can avoid the loss from taking trades that are
FREE

the AK CAP toolbox free to use;
it includes the same indicators we use for our daily trading and we think the simpler the better. Lightweight indicator for use on all timeframes. that includes VWAP with vwap value indicator on top right. 3 EMA: FAST, MEDIUM, SLOW the candle timer to show how much time left in a candle.
colors and positions are fully customizable.
enjoy
FREE

This indicator allows you to overlay three different moving averages on the chart simultaneously. Each of these moving averages has additional settings such as: -Time frame
-Shift
-MA method
-Applied price
Using this indicator, you can easily set up three moving averages and find the one that suits you the best. You can also use this indicator to determine the trend when the moving averages cross.
FREE

Этот индикатор способен отображать 1-2 индикатора MACD на разных таймфреймах и с разными настройками. В расчетах используется EMA. Активные индикаторы могут подавать визуальные и звуковые оповещения при пересечении нулевого уровня, если эта функция включена пользователем. Оповещения могут быть установлены для одного или обоих активных индикаторов, даже если у них отличаются таймфреймы и периоды. При установке оповещений для обоих, две гистограммы MACD должны иметь одинаковое значение нулевого ур
FREE

The Stochastic RSI indicator (StochRSI) is essentially an indicator of an indicator. It is used in technical analysis to provide a stochastic calculation to the RSI indicator. This means that it is a measure of RSI relative to its own high/low range over a user defined period of time. The Stochastic RSI is an oscillator that calculates a value between 0 and 1 which is then plotted as a line. This indicator is primarily used for identifying overbought and oversold conditions.
FREE
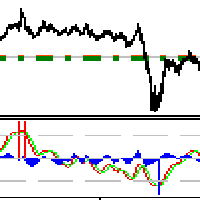
Check out other great products from https://www.mql5.com/en/users/augustinekamatu/seller
This indicator is the best so far at estimating reversal points especially on high time frames. It does not repaint and is based on a combination of moving averages computed using custom functions. No inputs required, it is simple plug and play. The principles used ensure that it can be used on CFDs, Commodities and Stock with incredibly great results. With proper money management and portfolio balancin
FREE
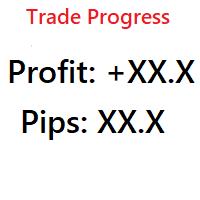
Simple indicator that shows your history in pips and profit. You can use it to follow your progress on the positions. It shows you the trade progress only for the symbol that the indicator is on and only for your trade history. Label text is updated when order is closed. The text can be displayed on each corner, it is in the parameters.
Basic input parameters: Label color Font size Conrner position Anchor position Note: corner and anchor have to be the same position.
FREE

Lisek Stochastic oscillator indicator with Alarm, Push Notifications and e-mail Notifications. The Stochastic indicator is a momentum indicator that shows you how strong or weak the current trend is. It helps you identify overbought and oversold market conditions within a trend. The Stochastic indicator is lagging indicator, which means it don't predict where price is going, it is only providing data on where price has been !!!
How to trade with Stochastic indicator: Trend following: As lon
FREE

Определяет экстремумы. Данный индикатор состоит из двух частей: Первая рисует линии на графике, обозначающие низкую волатильность относительного дневной активности рынка. Вторая отвечает за определение экстремума и дает сигналы на покупку или продажу. Данная система подходит для любых инструментов. Рекомендуется использовать таймфрейм от м15 до н4. Перед использованием необходимо подобрать настройки под себя. Настроить отклонение линий. Указать коэффициент волатильности. Подпишись на мой telegr
FREE
MetaTrader Маркет - торговые роботы и технические индикаторы для трейдеров, доступные прямо в терминале.
Платежная система MQL5.community разработана для сервисов платформы MetaTrader и автоматически доступна всем зарегистрированным пользователям сайта MQL5.com. Ввод и вывод денежных средств возможен с помощью WebMoney, PayPal и банковских карт.
Вы упускаете торговые возможности:
- Бесплатные приложения для трейдинга
- 8 000+ сигналов для копирования
- Экономические новости для анализа финансовых рынков
Регистрация
Вход
Если у вас нет учетной записи, зарегистрируйтесь
Для авторизации и пользования сайтом MQL5.com необходимо разрешить использование файлов Сookie.
Пожалуйста, включите в вашем браузере данную настройку, иначе вы не сможете авторизоваться.