Watch the Market tutorial videos on YouTube
How to buy а trading robot or an indicator
Run your EA on
virtual hosting
virtual hosting
Test аn indicator/trading robot before buying
Want to earn in the Market?
How to present a product for a sell-through
Free Technical Indicators for MetaTrader 4 - 19

Aroon and Moving Average A combination of Supertrend and Moving Average to create a converging trade setup Input parameters: signal mode: set it to true if you want to plug it into STAT (Signal Tester and Trader) arrow shift: distance between fast EMA line to arrow on chart turn on price line filter turn on moving average signal for converging setup aroon period MA period MA averaging method MA pricing method upper level limit (Aroon) lower level limit (A roon ) You can find the best setting
FREE

Lampropeltis is a trend indicator. The algorithm of calculation is based on data from the standard indicators included in the MT4 package and interpretation of patterns formed by these indicators. The settings include a minimum set of parameters: Slow MA - slow MA period; Slow MA method - slow MA smoothing method; Fast MA - fast MA period; Fast MA method - fast MA smoothing method. Change of the signal color to red indicates the possibility of opening a Sell order. Change of the signal color to
FREE

EMA Above Below Bid price Технический индикатор в помощь трейдеру. Данный индикатор, показывает расположение пяти ЕМА,
пяти средних скользящих, относительно цены формирующей японские свечи или бары (цена Bid ).
О понятии ЕМА.
Скользящая средняя (moving average, MA) — это дополнительная линия на графике цены актива.
Внешне она повторяет график цены, но с небольшим запозданием и более гладко, без колебаний. Основные характеристики:
1. Показывает тренды. Если скользящая устрем
FREE

KFX SMA: Symbol Changer + Moving Average (3x) + ATR + RSI + Candle Timer.
This indicator allows you to create a Symbol list and change between symbols of the current chart or Timeframe by selecting the appropriate button. On Chart there are three(3) multi timeframe Moving Averages shown (selected by you), ATR Value MTF ( selected by you - helps with setting SL and TP), RSI Value MTF (selected by you) and a Candle Timer. Features: - Symbol Changer : Change Symbol and Timeframe of Chart. (
FREE

Introduction and Description
The indicator displays an arrow whenever a " Bearish Engulfing " is detected. The latter usually indicates the beginning of a downward trend. A bearish engulfing pattern is a technical chart pattern that signals lower prices to come. The pattern consists of an up candlestick followed by a large down candlestick that eclipses or "engulfs" the smaller up candle. The pattern can be important because it shows sellers have overtaken the buyers and are pushing the price m
FREE

This indicator continuously, smoothly changes the color of candlestick edges and bodies, as well as the color of volumes in real time like a lamp. The indicator is easy to use. The palette of colors is diverse. This product is a graphical solution, so it is difficult to describe what it does by text, it is easier to see by downloading it, besides the product is free. The indicator is suitable for bloggers who want to create a beautiful picture of a chart for video editing or traders who want to
FREE

iCC in iMA is indicator to change color in iMA if iCCI crosses level up (up trend) or crosses level down (down trend). It is a useful tool to track when the upside and the downside iCCI on iMA.
You can to get source code from here .
Parameters MA_Periods —Period for iMA. MA_Method — Method for iMA. CCI_Periods —Period for iCCI. CCI_ApliedPrice — Price used for iCCI. CCI_LevelsUp — Level iCCI for up trend. CCI_LevelsDN — Level iCCI for down trend. BarsCount — How many bars will show the line.
FREE

Engulfing candlestick patterns are comprised of two bars on a price chart. They are used to indicate a market reversal. The second candlestick will be much larger than the first, so that it completely covers or 'engulfs' the length of the previous bar.
By combining this with the ability to look at trend direction this indicator eliminates a lot of false signals that are normally generated if no overall trend is taken into consideration
FREE

Active Price Lines
Indicator gives you full custom control over the Bid and Ask price lines, both color and style. Color control is also customizable based on increased or decreased price by the tick.
Options include: Show both the Bid line and the Ask line Set unique color for each Set unique line style for each Set unique color for increased price (by the tick) Show only Bid line Show only Ask line
Rider Capital Group
FREE

Rua Power Currency This is an indicator that measures the strength of each currency based on current data. Indicator allows selecting timeframe to calculate the power of money. High timeframes like H4, H1, D1 are often used to identify trends. Smaller timeframes are often used to fight Scalping. Input parameters: Seconds: Time to refresh the data x: coordinates x y: y coordinates Timeframe: timeframe retrieves data Period: Period A product of Ruacoder.
FREE

Double Exponential Moving Average (DEMA) is a well-known trend indicator. DEMA was developed by Patrick Mulloy and published in February 1994 in the "Technical Analysis of Stocks & Commodities" magazine. It is used for smoothing price series and is applied directly on a price chart of a financial security. Besides, it can be used for smoothing values of other indicators. The advantage of this indicator is that it eliminates false signals at the saw-toothed price movement and allows saving a posi
FREE

The “ Ticks Overcome Signal ” indicator, as outlined in your provided code, is a custom tool designed for use with MetaTrader 4 (MT4), a popular platform for Forex trading. This indicator seems to focus on tracking the momentum and direction of price movements by counting consecutive up and down ticks. Here’s an overview of the psychological aspects, logic benefits, and usage instructions for this indicator on MT4: Decision Support : Traders often face psychological challenges in decision-making
FREE

The Moving Average Slope (MAS) subtracts the moving average level n-periods ago from the current moving average level. This way, the trend of the moving average can be drawn on the moving average line.
Features Observe uptrends and downtrends at a glance. The indicator is non-repainting. Returns buffer values for the trend of the moving average to be used as part of an EA. (see below)
Inputs Moving Average Period : The period of the moving average (MA). Slope Period : Number of periods betwe
FREE
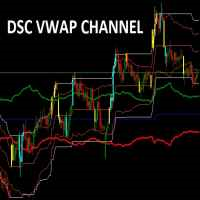
Corretora recomendada para usar esse indicador: https://tinyurl.com/5ftaha7c
Indicador usado para sabermos os pontos de suporte de resistência no gráfico. Funciona em todos ativos e timeframes.
Acerte exatamente os pontos de entradas e saídas das suas operações. SEE OUR RESULTS ON INSTAGRAM: https://www.instagram.com/diogo.cansi/ TELEGRAM GROUP = https://t.me/robosdsc More information by email dscinvestimentos@gmail.com or by Whatsapp 55-991372299
FREE

A multi-currency, Multi-time frame indicator that allows you to see the trend based on the intersection of 2 EMA without additional clicks, it searches for the last intersection on all timeframes at once and writes in the upper left corner in which direction the trend of the open currency pair is directed, as well as how long ago the last intersection was.
Based on this indicator, you can open orders if most of the trends are directed in the 1 direction and exit trades when the situation chan
FREE

The indicator is a 15-minute signal indicator for all types of traders. Meaning, you could make lots of profits trading two different signals in one indicator.
NOTE: Both indicators are channels for achieving the same result. RED ARROW -- Sell Signal BLUE ARROW -- Buy Signal
Purchase now to be part of our community. We offer standard chart setups for both novice and intermediate traders. Trade with ease!
FREE

RSI Color and Notification Setting Usages :: 1. Set value Oversold and Overbought 2. Set period RSI 3. Set Color 4. Notify to Alert, Email and Mobile.
For Trading :: Forex and Binary option 1. When the color alarm occurs in the OVB area, do the preparation. To enter a Sell order 2. When the color alarm occurs in the OVS area, do the preparation. To enter a Buy order 3. When RSI is between OVB and OVS, consider another indicator to trade.
FREE

Latest Changes in 1.6 : Added Signal Modes input. Mode 1 : HPF positive go long blue, HPF negative go short red. Mode 2 : slow envelope only, HPF above upper envelope go long blue, HPF below lower envelope go short red. Mode 3 : HPF above both upper envelopes - go long blue, HPF below both lower envelopes go short red. Mode 4 : Go long blue if HPF crosses above upper slow, but fast upper should be below slow upper at the time, exit when HPF crosses below upper fast, reverse logic for short re
FREE

The indicator is based on a single Moving Average of a user-defined period. By analyzing the price movement of the price relative to this MA, and also by tracking all updates of the price Highs and Lows over the same period as the MA period, the indicator draws its own picture of the trend, avoiding the ever-breaking MA lines. Therefore, if the trend goes up, the line will also point upwards and will not change its direction even on small retracements, allowing to capture almost the entire trend
FREE

This indicator is designed based on the Moving Origin indicator
When the moving origin indicator breaks the price, this indicator gives a signal
It is useful for better viewing of signals and analysis on them
Attributes: Can be used in all symbols Can be used in all time frames Too many signals Simple and quick settings Easy way to work
Settings: period: like moving average settings alarmShow: If you want to receive an alert in Metatrader after receiving the signal, enable this setting
a
FREE

This indicator uses Moving Average to detect markets trend. It's a very useful tool for manual trading. If line is Midnight Blue, indicator detect up trend. If line is Dark Violet, indicator detect down trend. The readings are very simple to use and understand. Indicator works best on H1 timeframe. You can use this indicator with FollowLine to have more accurate signals.
You can to get source code from here .
Parameters BarsCount —How many bars used to show the line. MAperiods —Period of Mov
FREE

Полная версия индикатора находится здесь .
Индикатор предназначен для торговли внутри дня. Строит канал по пробою крайних уровней которого вы можете открывать ордер на покупку или продажу. Во флетовом рынке работа ведётся на отбой от этих уровней. Для фильтрации входов используется цветная гибридная скользящая средняя. Настройки по умолчанию предназначены для терминального времени GMT +3 (подходит для большинства брокеров) и для терминалов с пятизначными котировками. Индикация канала и уровней
FREE

This indicator displays each bar's volume in points as a histogram. The second version of the indicator. Now it is represented as an oscillator. It is more informative and functional. At that it does not load the main chart. GitHub It displays: bar's volume in points as a histogram (buffer 0) average value of the volume for the whole period (buffer 1) bars upper than the client average value with another color (buffer 2) average value of the amount of bars set by a user (buffer 3) Also: setting
FREE

Support/Resistance Percent Rank
SR Percent Rank helps to see how many times the current close price has been in the past price range. SR Percent makes a loop over x bars into the past and calculates the percentage of times the current closing price has been between the high and the low price in the x bars before that. So we can determine if the current price is moving at supports or resistance that was formed in the past. I use the indicator when creating strategies with the StrategyQuant X p
FREE
The ZoomChart indicator displays data from other timeframes on the current chart in the subwindow, acting as a magnifying glass or, conversely, shrinking the chart to display larger timeframes.
The ZoomChar indicator automatically tracks the current outermost bar on the chart and moves with the chart as it shifts.
The indicator can display data from another financial instrument, not limited to the main chart instrument.
The robot carries the function of “mirroring” - The ability to conver
FREE

Introducing Round Range 5, a versatile and dynamic indicator designed to optimize your trading strategies on MT4. Let's explore how this indicator can revolutionize your trading experience by adapting round number levels to suit the unique characteristics of each instrument.
In the fast-paced world of financial markets, round numbers play a crucial role. These price levels, ending with multiple zeros or other significant digits, often act as psychological barriers that influence market sentim
FREE

Индикатор отображает скользящие средние на заданном количестве баров ( Count bar for show MA ). Данный способ отображения упрощает анализ, так как график не загромождён лишними линиями. Так же имеется текстовая метка с отображением текущей цены скользящей средней и периода графика. Горячие клавиши служат для упрощения использования индикатора.
Настройки индикатора: Moving average #1 - скользящая средняя #1 Period - период усреднения Mode - метод сглаживания Price - используемая цена для расч
FREE

Session Average Date Range: Analyze and average the low - high of specific trading sessions within custom date ranges, offering insights into price movements and market behavior over selected periods. The "Session Average Date Range" tool is an advanced analytical utility designed to empower traders and analysts by allowing them to dissect and evaluate the high and low range of specific trading sessions within a user-defined date range. This tool provides a flexible and precise approach to analy
FREE
Индикатор Free Pro Level предназначен для автоматического построения уровней поддержки и сопротивления. Преимущества индикатора: подходит как для опытных трейдеров, так и для новичков; простота в использовании; уровни не перерисовываются; вероятность реакции цены при касании уровня более 80%; бесплатный. Индикатор Free Pro Level имеет всего 5 пунктов входных параметров: Минимальная длина свечи в пунктах по 5 знаку - основной параметр, на основании которого происходит анализ и поиск уровней по
FREE

This indicator will show week and monthhigh low, very useful to understand the market sentiment. To trade within the range/ break out. Low- can act as support- can used for pull back or break out High- can act as resistance- can used for pull back or break out Breakout strategy refers to the day trading technique that provides traders with multiple opportunities to go either long or short . The main idea is to identify the trend in its most juicy state followed by a trending move.
FREE

Day Points
Indicadtor that shows the points considered important for X days. (Open,Close, High, Low) Used a lot by those who do day trade. These points can be used for decision making by a trader. You will choose the amount of days ago for it to show.
Settings High/Low/Close/Open Show - True/False. Days - Number of days that will show on the chart. Color - Line Color. Style - Line Style.
FREE

a novel indicator by the maker of velvet.
FREE

Trend is Friends is an line Indicator used as an assistant tool for your trading strategy. The indicator analyzes the standard deviation of bar close for a given period and generates a buy or sell trend if the deviation increases. It good to combo with Martingale EA to follow Trend and Sellect Buy Only/Sell Only for EA work Semi-Automatic. You can use this Indicator with any EAs in my Products.
FREE

The indicator draws lines the the price highs and lows. Break through the high or low usually indicates trend change (or continuation). Once the price moves through a line, and the candlestick closes, the indicator draws an appropriate arrow (also, you can enable alerts). A deal should be conducted in the breakthrough direction immediately or after a slight rollback. It is best to trade following the trend on a larger timeframe. This indicator is easy to use, but nevertheless, there are many tra
FREE
Простой, но полезный индикатор для контроля волатильности при внутридневной торговле. Индикатор наносит на текущий график уровни средней волатильности (ATR) за указанное количество дней. На текущем торговом дне уровни динамические и перемещаются в зависимости от минимума и максимума цены текущего дня в режиме "реального времени". Во входных параметрах мы задаем: - количество дней для расчета и отрисовки уровней среднего АТР - цвет линий уровней среднего АТР - толщину линий уровней среднего АТР
FREE

It's a simple but useful tool for creating a grid based on Envelopes.
Only 2 parameters can be set: 1) "Period" - the period of all visible Envelopes (i.e. 4) and 1 Moving Average (Envelopes axis), 2) "Deviations Distance" - the distance between Envelopes.
Naturally, the colors of all 9 lines can be changed as desired. It works with everything that is available in your Market Watch.
Good luck!
FREE

The implementation of the impulse system described by Dr. Alexander Elder. The indicator colors the bars according to the following pattern: Moving average and MACD histogram increase - green bar, it is forbidden to sell; Moving average and MACD histogram have different directions - blue bar, the ban is removed; Moving average and MACD histogram decrease - red bar, it is forbidden to buy.
Indicator Parameters EMA - period of the indicator's moving average MACD Fast - period of the fast moving
FREE

This is a multitimeframe RSI indicator defining trends, oversold/overbought zones, as well as all intersections of signal lines from different timeframes on a single chart using arrows and audio alerts. When working with standard RSI, we often need to examine data from all necessary timeframes simultaneously. RSI 7TF solves this issue. If you are only interested in audio signals when signal lines are crossed, then have a look at RSI Alerts . Attention! The indicator uses seven timeframes - M5, M
FREE

Multiple RSI indicator works based on the standard RSI indicator. This indicator will display the RSI indicator from different timeframes on one screen. You will see the RSI indicator for all timeframes on one screen. This indicator saves you from constantly changing charts. At the same time you can analyze the operations of other graphs relative to each other.
Features This indicator shows the RSI graph of the timeframe you are working on and the upper timeframe graphs. For example, if you ru
FREE

Check out other great products from https://www.mql5.com/en/users/augustinekamatu/seller
This indicator finds the entry points based on divergences of common indicators and does not repaint . The principles used ensure that it can be used on CFDs, Commodities and Stock with incredibly great results. With proper money management and portfolio balancing the Indicator can be applied to any trading strategy to generate consistent profits. A Winning Trading Strategy This article describes the co
FREE
Vertical Lines for Hour - Time-Based Trading Indicator The Vertical Lines for Hour indicator allows you to mark up to 4 vertical lines at specific times on your chart. Simply enter the hour without considering the minutes, and you can also choose the color for each line. This indicator is useful for identifying session ranges or implementing custom trading strategies. It provides a straightforward solution for your trading needs. Key Features: Mark up to 4 vertical lines at specified times. Sele
FREE

The indicator marks the volatile areas of price movement on the chart according to the specified settings.
Settings TrendPips - filter value in points TrendBars - filter value in the amount of bars signal_shift - shift relative to the current bar by the specified number of periods back, for signals CountBars - the number of bars to display the indicator Color_1 - one of the rectangle alternation colors Color_2 - the second color of the rectangles Alerts - show a dialog box containing custom da
FREE

CCI Trend Finder indicator with different colors at levels 0, 100 and -100. The cross is a signal for "123 Exit" as presented by MPlay and used in Woodies CCI system. This exit signal is effective especially in short-term breakout trades, because it prevents early exiting at small corrections. This indicator is great for having it as an extra tool for your analysis.
FREE

SuperTrend AM is an indicator that allows you to open a position at the very beginning of a significant price movement. The second most important quality of the indicator is the ability to follow the trend as long as possible in order to obtain all potential profits while minimizing potential losses. This indicator does not repaint or not recalculate. A version of this indicator with advanced settings and signal notifications is SuperTrend 3 AM .
Signal of the indicator: red arrow appearing a
FREE

*This is tradingview indicator converted to mql4*
The CM Slingshot System Indicator is a trading tool that aims to identify potential trade setups based on market volatility and price action. It is designed to help traders spot entry and exit points in trending markets. The CM Slingshot System Indicator combines multiple indicators and techniques to generate trading signals. Here are the key features and components of the indicator: Bollinger Bands: The indicator incorporates Bollinger Bands,
FREE
Strong and weak Pairs is a trend following indicator to help you choosing the pairs to trade based on the currency score. Strong and weak Pairs is comparing currencies position to the moving average for all major pairs then display the position score from Zero (0) to Seven (7) with two lines on the chart. 7 is the strongest currency and zero is the weakest currency. Additionally there is a dashboard displaying all the currencies score to choose the pair you will trade. Strong and Weak Indicator
FREE

The Moving Averages On-Off let you control the indicator using the keyboard or a button . You can choose if you want the indicator always shown or always hided while switching among different time frames or financial instruments . ---> This indicator is part of Combo Indicator OnOff
It's possible to use three Moving Averages , defined as Short , Medium , Long or Raimbow MA 5,10,20,50,100,200.
Input MOVING AVERAGES
You can customize the price type used for calculation : close,
FREE
We offer indicators that will meet your needs more. >> MT Sideway Filter <<
MT Focus Session : It is an indicator used to look at the session time of interest by focusing only on the market opening to closing time only. It is recommended to set Open session LONDON and End session USA, because it was a time graphs tend to have very high volume.
TRADE: Forex
TIME FRAME: M5 M15 M30 H1
SYMBOL PAIR: All Symbol
SETTINGS: FOCUS SESSION Open Session Time: Start time of t
FREE
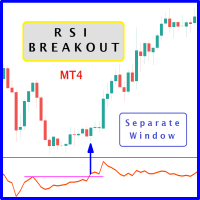
The likelihood of farther price movement increases when the Relative Strength Index oscillator "RSI" breaks through its historical resistance levels in conjunction with prices breakout of resistance levels. It's strongly encouraged to confirm price breakout with oscillator breakout since they have comparable effects to price breaking support and resistance levels; similar perception is applied to short trades. Concept is based on find swing levels which based on number of bars by each side to co
FREE

The principle of this indicator is very simple: detecting the candlestick pattern in D1 timeframe, then monitoring the return point of graph by using the pullback of High-Low of D1 Candlestick and finally predicting BUY and SELL signal with arrows, alerts and notifications. The parameters are fixed and automatically calculated on each time frame. Example:
If you install indicator on XAUUSD, timeframe D1: the indicator will detect the reversal, pullback, price action on this timeframe (for exa
FREE

There is a very simple and surprisingly effective indicator called Pi Cycle, which starts to give the first warning. It is worth a look, so as not to miss the giant elephant in the living room!))
What is Pi Cycle?
Pi Cycle is a very simple indicator created by analyst Philip Swift . It takes into account two (DMA biased moving averages ): 350-day average x 2 111-day average Both can be considered long-term indicators. The second one is obviously more sensitive to current market changes, sin
FREE

Based on a combination of indicators, PS Acid Fulx is an excellent indicator for knowing when to buy or sell on any asset and temporaryity. The indicator myself I have used it as a tool for my analysis when trading Forex. It is a useful and easy-to-understand trend indicator. If you combine it with your own analyses you will surely get a good result in your operation.
FREE
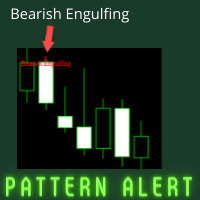
Welcome to pattern alert indicator page. This indicator designed for alerting purpose of Bullish and Bearish engulfing pattern alert. This stuff is suitable for 1 hour, 4 hour and 1 day time frame. high winning ratio is tested. Buy Alert: when the bullish engulfing pattern alert is noticed. Sell Alert: when the bearish engulfing pattern alert is noticed. See the attached screenshots for more clarity. Happy trading !!! Open Account (Get $15 cash back for each and every 1 lot trades has done) : ht
FREE

The indicator My Big Bars can show bars (candles) of a higher timeframe. If you open an H1 (1 hour) chart, the indicator puts underneath a chart of H4, D1 and so on. The following higher timeframes can be applied: M3, M5, M10, M15, M30, H1, H3, H4, H6, H8, H12, D1, W1 and MN. The indicator chooses only those higher timeframes which are higher than the current timeframe and are multiple of it. If you open an M30 chart (30 minutes), the higher timeframes exclude M5, M15 and M30. There are 2 handy
FREE
This indicator gives the highest and lowest information of the currency you have selected and the day you selected. It also shows the average. In this way, you can find out the profit / loss probability of your transactions for the same days. Reported: Average points per week Average points per year Lifetime average points Note: It does not provide you with buy / sell signals. Shows average points only
FREE

This indicator shows in a subwindow the trend in M1, M5, H1, D1 timeframes based on MA, MACD, Stochastic This way you could see in once in different timeframes what happening. This is my first free indicator. Please follow I will put here some more. Thank you for you attention. . . . . .
lfknglkslksnlgslgnsflgjrpoesv ,msv lkrjpfjésmdg sd.npo4wsmdglknsp4jwpkeégmfs.lkmp Thank you
FREE

ADR 10 mostra l'intervallo medio di pips di una coppia Forex, misurato su un numero di 10 giorni . I traders possono utilizzarlo per visualizzare la potenziale azione dei prezzi al di fuori del movimento medio giornaliero.
Quando l'ADR è al di sopra della media, significa che la volatilità giornaliera è superiore al normale, il che implica che la coppia di valute potrebbe estendersi oltre la sua norma.
L'ADR è utile anche per il trading di inversioni intraday. Ad esempio, se una coppia di
FREE
Simple Market Line Price Color
This indicator allows you to see the market's aggregation by buying or selling on the price line.
when it is attacked the sale turns into a color when it is attacked the purchase takes on another color
Indicator Parameters
indicator_colorUP - Color of UP price aggregation indicator_colorDown - Color of Down price aggregation indicator_WIDTH - WIDTH Line in chart
Good Trades
FREE

Description This scanner uses 3LZZ TRO ex4 and scans for Semafors at given “Shift” bar.
Scanner Detailed Settings: https://www.mql5.com/en/blogs/post/747456
Other Settings: Set Periods for Semafor 1,2,3 Set alerts on/off for Semafor 1,2,3 Shift bar (Bar on which semafor is scanned) Refresh After Ticks (Number of ticks when dash is refreshed) This scanner is pretty simplistic version. And a more detailed version with a different strategy is available here: https://www.mql5.com/en/market/produ
FREE
Future WPR - or backward WPR - is a special modification of WPR: it uses standard formula, but applies it in reverse direction. The indicator calculates WPR from right to left, that is from the future to the past. It 'knows' and uses the future price movements at any bar where the right-side history provides sufficient number of "forthcoming" bars, that is period bars or more. Conventional WPR is also shown for reference. Both WPR and backward WPR are normalized to the range [0..1] as a more con
FREE

Our team has finally achieved the expected result.
We have created artificial intelligence for binary options trading. Don't believe? Many users have already rated it positively. The results will surprise you too. This indicator broadcasts signals for a binary option through a telegram channel. All signals are reliable and of high quality.
Read more !!! ATTENTION !!!
You didn't dream !!! HOW TO EARN RIGHT NOW? The most successful signal channel for binary options Students,
FREE

The Candle High Low Exit indicator uses the highest high and the lowest low of a range to draw trailing stop lines (orange under buys, magenta over sells) that advance with the trend until the trend changes direction. Moreover, the trailing stop lines are generated to support the order’s trend direction (long or short): In an upward trend, the long trailing stop line (orange line under buy) appears and advances upward until the close crosses under the line.
In a downward trend, the short tra
FREE
Binary Options Assistant (BOA) CHILL Signals Indicator provides signals based on Katie Tutorials Binary Options Strategy. Indicators: 3 Moving Averages & RSI
Use any of the BOA Signals Indicators with the Binary Options Assistant (BOA) Multi Currency Dashboard so you can:
Stop missing trade set-ups Stop jumping from chart to chart looking for trade set-ups Get all the signals on 1 chart All BOA Signal Indicator settings are adjustable to give you more strategy combinations. The signals ca
FREE
Highly configurable Relative Vigor Index (RVI) indicator.
Features: Highly customizable alert functions (at levels, crosses, direction changes via email, push, sound, popup) Multi timeframe ability Color customization (at levels, crosses, direction changes) Linear interpolation and histogram mode options Works on strategy tester in multi timeframe mode (at weekend without ticks also) Adjustable Levels Parameters:
RVI Timeframe: You can set the lower/higher timeframes for RVI. RVI Bar Shift:
FREE

O Afastamento da Média Móvel, é uma poderosa ferramenta de análise técnica projetada para fornecer uma representação visual do afastamento entre o preço atual e uma média móvel específica. Este indicador, desenvolvido para o MetaTrader, oferece aos traders uma perspectiva clara das mudanças na dinâmica de preço em relação à tendência de médio prazo. Versão MT5: https://www.mql5.com/pt/market/product/111704
FREE
Fractals Direction ST Patterns MT4 is a modification of Bill Williams' Fractals indicator, which allows you to specify any number of bars for finding a fractal. In the settings, it is also possible to set the number of points for determining the trend direction. The upward direction is determined if the last upper fractal is higher than the penultimate upper fractal. The downward direction is determined if the last lower fractal is lower than the penultimate lower fractal. This simple indicator
FREE
Highly configurable Average True Range (ATR) indicator.
Features: Highly customizable alert functions (at levels, crosses, direction changes via email, push, sound, popup) Multi timeframe ability Color customization (at levels, crosses, direction changes) Linear interpolation and histogram mode options Works on strategy tester in multi timeframe mode (at weekend without ticks also) Adjustable Levels Parameters:
ATR Timeframe: You can set the lower/higher timeframes for ATR. ATR Bar Shift: y
FREE

This indicator is designed to find the difference in MOMENTUM price and indicator. This indicator shows the price and indicator difference on the screen. The user is alerted with the alert sending feature. Our Popular Products Super Oscillator HC Cross Signal Super Cross Trend Strong Trend Super Signal Parameters divergenceDepth - Depth of 2nd ref. point search Momentum_Period - Second calculation period indAppliedPrice - Applied price of indicator indMAMethod - MA calculation method findEx
FREE
TIRED OF HAVING TO CALCULATE THE LOTSIZE EVERY TIME?
This indicator will do it for you, WHATEVER ASSET YOU CHOOSE in 10 seconds !!!
INSTRUCTIONS
The things to do in order to activate this indicator will take around 10 seconds once you understand how to use this indicator properly.
Here are the steps to follow:
Place the indicator on the chart of the asset you want to trade on.
Go to " Inputs ".
Enter where you want to set the stop loss .
Choose risk in $ .
You can also
FREE

Based on a combination of indicators, E13 Acid Fulx is an excellent indicator for knowing when to buy or sell on any asset and temporaryity. The indicator myself I have used it as a tool for my analysis when trading Forex. It is a useful and easy-to-understand trend indicator. If you combine it with your own analyses you will surely get a good result in your operation.
FREE
The MetaTrader Market is a unique store of trading robots and technical indicators.
Read the MQL5.community User Memo to learn more about the unique services that we offer to traders: copying trading signals, custom applications developed by freelancers, automatic payments via the Payment System and the MQL5 Cloud Network.
You are missing trading opportunities:
- Free trading apps
- Over 8,000 signals for copying
- Economic news for exploring financial markets
Registration
Log in
If you do not have an account, please register
Allow the use of cookies to log in to the MQL5.com website.
Please enable the necessary setting in your browser, otherwise you will not be able to log in.