Forecast for Q4'16 - levels for US Dollar Index
Forum on trading, automated trading systems and testing trading strategies
Sergey Golubev, 2016.09.30 20:27
Dollar Index Daily Technicals: ranging within 100-day SMA/200-day SMA for direction; 95.95 is the key resistance for the bullish reversal (based on the article)
Daily price is located below 200 SMA and above 100 SMA for the ranging bearish market condition.
"The clearest section of recent DXY price action is the 3 wave rally from
the May low. That alone suggests that the path of least resistance is
lower. Of course, weakness from the July high isn’t impulsive either
(but could be motive), which leaves the wave picture unclear. Pay
attention to the rising trendline just below price. Weakness below would
be the best signal yet that a breakdown is underway. Downward slope is
defined by the December-January trendline and also serves as the bearish
invalidation level."
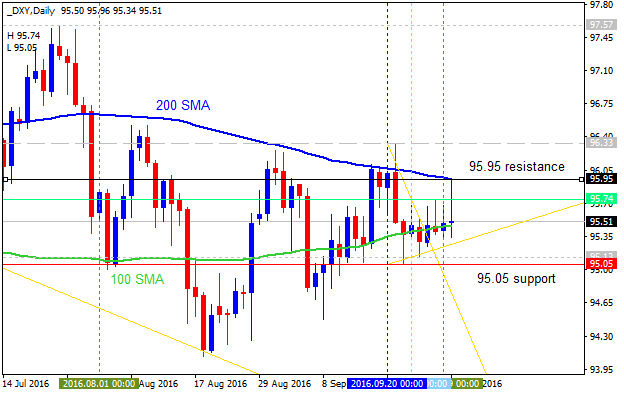
If the price breaks 95.95 resistance on close daily bar so the bullish reversal will be started.
If the price breaks 95.05 support level on close daily bar so the primary bearrish trend will be resumed.
If not so the price will be on bearish rangging within the levels.
Forum on trading, automated trading systems and testing trading strategies
Sergey Golubev, 2016.10.08 10:50
Weekly Fundamental Forecast for Dollar Index (based on the article)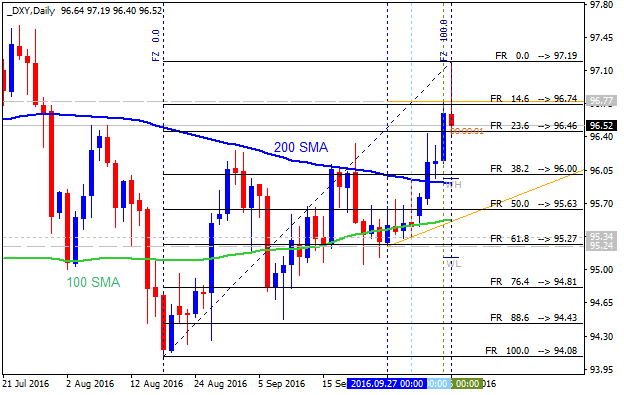
Dollar Index - "While the warning on risk trends may seem threadbare at this point, it is nevertheless a market catalyst that could systemically change market and financial structure conditions. Benchmarks like the S&P 500 have worked their way back into extraordinarily tight rangeswhile liquidity continues to bleed away yet volatility lingers. The crumbling of confidence in monetary policy (market-born) and fading outlook for growth (generally accepted after the IMF’s updates) represent a transfer of risk squarely onto the shoulders of the complacent market participant. It is not a question of ‘if’ but ‘when’. And, the transition from losing yield advantage to an outright demand for absolute haven will happen quickly for the Greenback in such an event."
Forum on trading, automated trading systems and testing trading strategies
Sergey Golubev, 2016.10.14 10:57
Dollar Index Overview: breaking 98.13 resistance for 98.33/58 bullish target (adapted from the article)
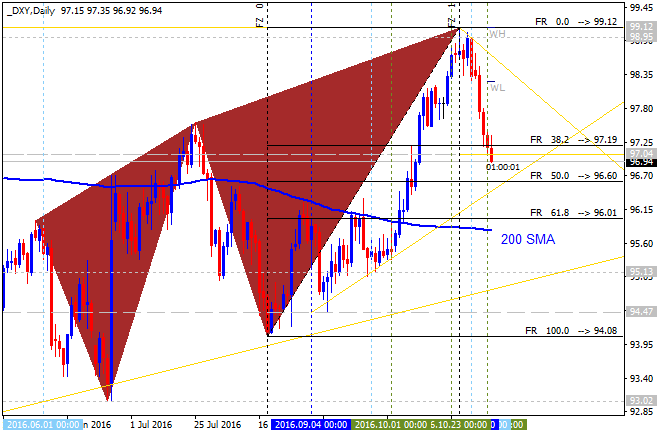
D1 price is located above SMA with period 100 (100 SMA) and SMA with the period 200 (200 SMA) for the bullish market condition. The price is on breaking 98.13 to above for the bullish trend to be continuing with 98.33/58 bullish target.
- "Focus remains towards an estimated channel top above 99.00 although I’d be aware of horizontal levels at 98.33/58 as near term roadblocks. These horizontal levels are defined by the August 2015 and March 2016 highs. There is one interesting tidbit worth mentioning regarding the EUR/USD and DXY relationship."
- "Non-confirmations between these 2 markets (EUR/USD accounts for 57% of DXY) warn of ‘traps’ or false breakouts and non-confirmation is precisely the order of the day as DXY has surpassed its July high but EUR/USD remains above its July low."
If the price will break 98.13 resistance level so we may see the bullish trend to be continuing.
If price will break 95.69 support so the reversal of the daily price movement from the bullish to the primary bearish trend will be started.
If not so the price will be ranging within the levels.
| Resistance | Support |
|---|---|
| 98.13 | 95.69 |
| N/A | 95.05 |
Forum on trading, automated trading systems and testing trading strategies
Sergey Golubev, 2016.10.22 12:13
Weekly Fundamental Forecast for Dollar Index (based on the article)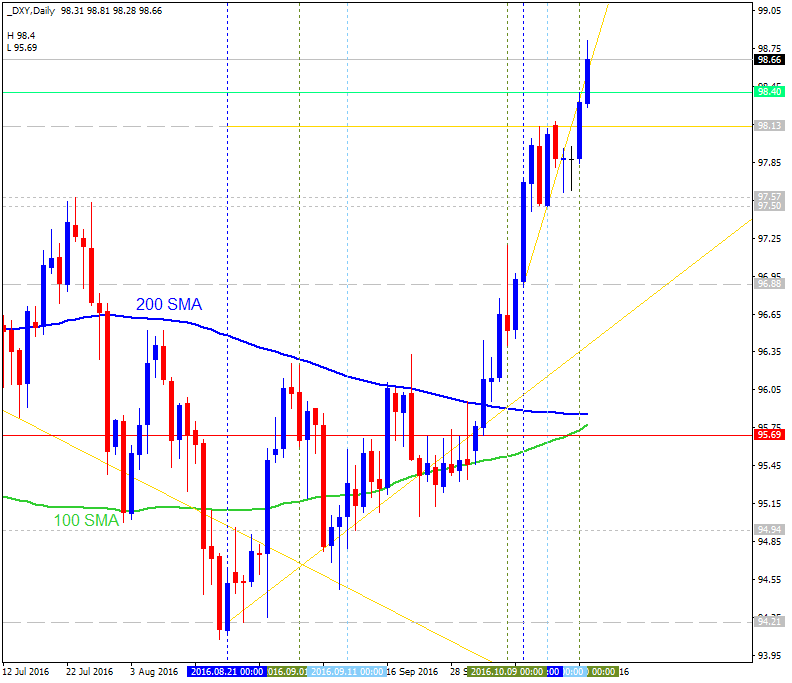
Dollar Index - "Other fundamental fodder to move the rate view and/or the Dollar include a host of Fed speeches penciled in. The terms of this policy group’s tone is changing with remarks like those made by San Francisco Fed President John Williams who said they should have hiked in September and low rates can lead to a recession. Another indicator to keep tabs on is the Conference Board’s consumer sentiment survey. Both the headline and components are valuable forecasting for economic activity moving forward."
Forum on trading, automated trading systems and testing trading strategies
Sergey Golubev, 2016.10.29 10:44
Weekly Fundamental Forecast for Dollar Index (based on the article)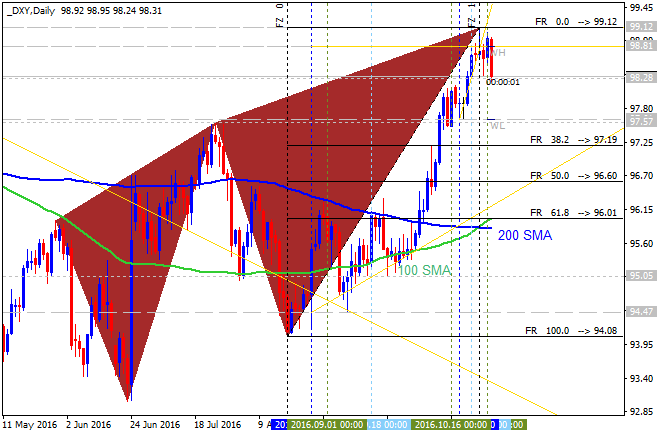
Dollar Index - "Though there are a lot of direct fundamental sparks to move the Dollar in the week ahead, we should still keep sight of the crosswinds. Much of the Greenback’s movements these past weeks have come on the basis of weakening counterparts. Motivated counter currencies can keep the pressure – bullish or bearish – on the Dollar moving forward. Themes of Brexit, China devaluation, faltering Eurozone stability and BoJ capitulation stand ready to move the needle."
Forum on trading, automated trading systems and testing trading strategies
Sergey Golubev, 2016.11.05 10:42
Weekly Outlook: 2016, November 06 - November 13 (based on the article)
US Presidential Election, Crude Oil Inventories, Unemployment Claims, Prelim UoM Consumer Sentiment, Rate decision in New Zealand. These are the main highlights of this week.
- US Presidential Election: Tuesday. US Presidential election attracts worldwide attention offering many surprises and uncertainties. The question is how the election would impact the economy and the markets. History suggests that the markets respond better to predictable outcomes than to uncertainties. The fact that Obama isn’t running may create a void badly affecting financial markets. Investors are not familiar with the candidates’ ability to “run the show”. Furthermore the party affiliation does not offer easy clues about which candidates might help or hurt investments. However, markets are expected to respond well to proposals from a front-runner to reduce U.S. corporate tax rates, which at the current 39% are the highest in the developed world. Moreover, analysts may look forward to a possible haven in 2017, after a new president takes over.
- US Crude Oil Inventories: Wednesday, 15:30. Analysts do not expect imports will remain strong in the coming weeks.
- NZ rate decision: Wednesday, 20:00.
- US Unemployment Claims: Thursday, 13:30. The number of new claims are expected to register a 267,000 gain.
- US Prelim UoM Consumer Sentiment: Friday, 15:00. U.S. consumer confidence is expected to rise to 87.4 this time.
- Stephen Poloz speaks: Friday 15:00. BOC Governor Stephen Poloz will speak in Santiago. In a recent talk, Poloz said risks from household debt and the housing market will be better addressed by macroprudential policies than by adjusting interest rates.
Forum on trading, automated trading systems and testing trading strategies
Sergey Golubev, 2016.11.07 11:14
Weekly Fundamental Forecast for Dollar Index (based on the article)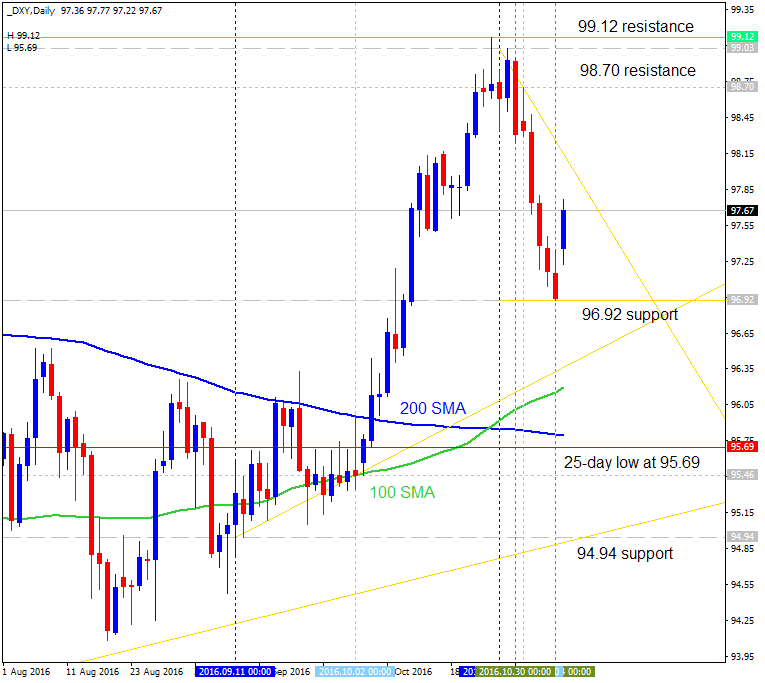
Dollar Index - "Two, four, eight weeks after the US election passes; we will likely see the impact of the event fade into a more subtle promotion of the prevailing trend. There is certainly capacity for the change in leadership to contribute to the bigger picture bearings on speculative positioning; but sentiment’s drive will likely draw from more elemental sources. That means other drivers will likely return to the forefront for global markets and even the Dollar itself. The probability of a December 14th FOMC hike is a factor that is likely to regain its sway over the market after this event passes. According to Fed Funds futures the chances of a hike before year end stand at 78 percent through Friday which is a significant gain over the previous few weeks. Yet the Dollar slid. That is evidence not of a broken fundamental driver, but the market prioritizing. When the risk factor passes, that theme will return. After the Fed’s statement and the strong wage growth in NFPs this past week, a rate hike looks like a high probability. So long as risk doesn’t subvert those chances, a refocus could support the Greenback."
Forum on trading, automated trading systems and testing trading strategies
Sergey Golubev, 2016.11.11 07:30
US Dollar Index Daily Technicals: ranging bullish (based on the article)

"Charts don’t predict. Rather, the interpretation of trend and identification of price levels aid in tactics. The most recent comments for DXY were “the major trend defining test is the May-August trendline (channel bottom) and 200 day average (currently 95.82).” The reaction low after the election was 95.89. Did the chart ‘predict’ that the market was going there? Of course not. But, if you had this chart on hand Tuesday night, you’d be aware of the potential for big support on the drop. 1 day later and DXY is already nearing channel resistance."
Daily price is located above 100-day SMA/200-day SMA revcersal levels on the bullish area of the chart: the price is on ranging within 99.12 "bullish continuation" resistance level and 95.89 "bearish reversal" support level.
Most likely midterm scenario for the daily price movement is the following: the price will be continuing with bullish ranging within 99 resistance and 95 support levels.
Forum on trading, automated trading systems and testing trading strategies
Sergey Golubev, 2016.11.19 07:40
Weekly Outlook: 2016, November 20 - November 27 (based on the article)
The US dollar continued marching forward, accompanied by clear hints of a rate hike. US Durable Goods Orders, UK GDP and the all-important FOMC Meeting Minutes stand out in the week of Thanksgiving. These are the major events on forex calendar.
- Mario Draghi speaks: Monday, 16:00. ECB President Mario Draghi will testify before the European Parliament, in Strasbourg.
- US Durable Goods Orders: Wednesday, 13:30. Economists expect durable goods to rise 1.2% in September, while core goods to rise 0.2%.
- US Unemployment Claims: Wednesday, 13:30. The number of jobless claims is expected to reach 241,000 this time.
- US Crude Oil Inventories: Wednesday, 15:30.
- US FOMC Meeting Minutes: Wednesday, 19:00. These are the minutes from the November meeting, in which the Fed left rates unchanged but argued that the case for raising rates has “continued to strengthen”.
- German Ifo Business Climate: Thursday, 9:00. German business climate is expected to register 110.6 in November.
- UK GDP data: Friday, 9:30. The second estimate is expected to confirm the first one, but changes are not uncommon.
Forum on trading, automated trading systems and testing trading strategies
Sergey Golubev, 2016.11.23 09:41
Quick Technical Overview - Dollar Index: daily bullish with 101.48 resistance (adapted from the article)
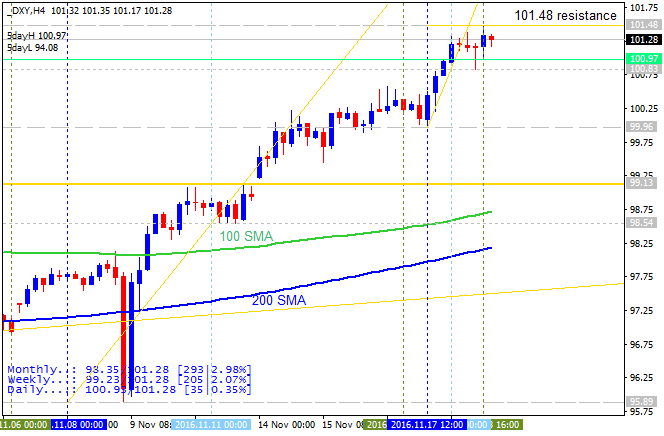
Dollar Index daily chart: bullish. The price is located far above 100 SMA/200 SMA in the bullish area of the chart. The price is testing 101.48 resistance level for the bullish trend to be continuing, otherwise - ranging bullish.
- "Recent comments noted that “Monday’s (11/14) close settled above channel resistance, indicating potential for upside acceleration (could be a ‘blow-off’). The importance of the break through resistance is accentuated by the fact that channel resistance (former now) was support earlier this week (on 11/17 dip).” DXY hasn’t disappointed, having traded through the 2015 highs. Former highs at 99.83 and 101.51, along with former channel resistance, should be watched for support."
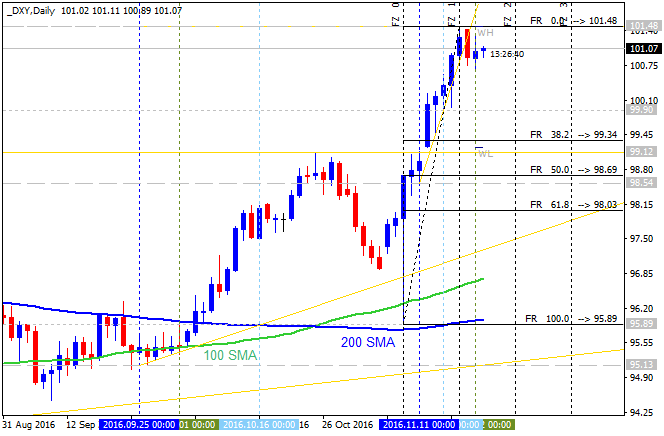
| Resistance | Support |
|---|---|
| 101.48 | 98.69 |
| N/A | 95.86 |
- Free trading apps
- Over 8,000 signals for copying
- Economic news for exploring financial markets
You agree to website policy and terms of use
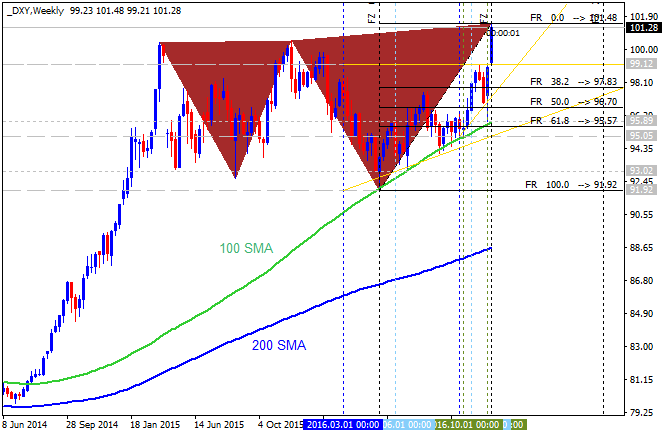
Dollar Index October-December 2016 Forecast: bearish ranging near weekly bullish reversal
W1 price is on ranging to be near and below Ichimoku cloud on the border between the primary bearish market condition to be started. The symmetric triangle pattern was formed by the price to be crossed for the direction of the trend: for the bullish reversal or to the bearish trend to be resumed.
Chinkou Span line is located near and below the price for the ranging bearish condition by the direction, Absolute Strength indicator is estimating the trend to be ranging as well, and Tenkan-sen line is above Kijun-sen line for the possible bullish reversal to be started on the secondary ranging way for example.
Trend:
W1 - ranging for the bullish reversal or for the bearish trend to be resumed