Forecast for Q3'16 - levels for Hang Seng Index (HSI)
Forum on trading, automated trading systems and testing trading strategies
Sergey Golubev, 2016.07.12 08:41
Foreign Exchange post-Brexit Vote - China's Economy: Between a Rock and a Hard Place (based on the article)
- "The Chinese economy appears to be stuck in an uncomfortable and unsustainable quasi-equilibrium in which growth is just about stopped from falling further through continued central-bank and financial regulator-promoted credit growth and selective fiscal stimulus, funded by local governments borrowing and debt issuance by SOEs and other large corporates. This interruption of the decline in China’s growth rate is achieved through means that increase the likelihood of an eventual larger decline in growth, commonly referred to a “hard landing”. Adding debt to the already over-leveraged balance sheets of local governments and non-financial corporates and adding productive capacity in sectors already plagued by excess capacity are the wrong kind of counter cyclical demand stimulus."
- "The RMB has depreciated ~8% from ~6.2 to ~6.7 RMB/USD in one year, weakest since Oct 2010. The risk of a resumption of capital outflows driven by expectations of near-term RMB weakening is therefore rising. The official FX reserve figures of over $3.1 trillion overstate the amount of ammunition available to defend the RMB, as $1 trillion or more of these reserves may be encumbered through forward and futures interventions. (When selling FX forward to stop the RMB weakening, one will have to deliver the FX at a future date. So we need to subtract that the future FX delivery from the current stock of reserves.)"
- "The strengthening of the US dollar in response to the Brexit vote on June 23rdputs further pressure on the RMB. The key advanced industrial regions of the world (North America, the EU and Japan) are unlikely to match last year’s growth this year as a result of rising policy uncertainty including the political tensions and banking sector weakness in Europe and the forthcoming US elections."
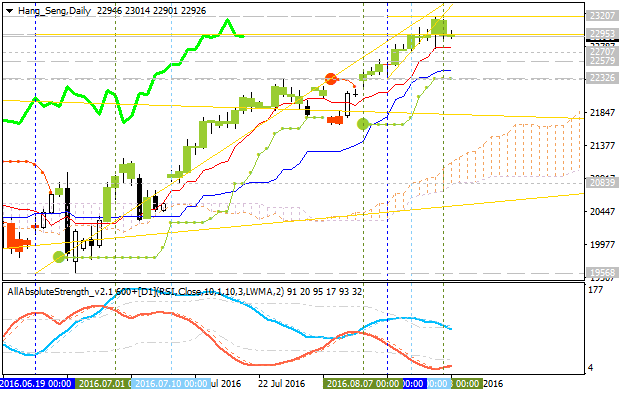
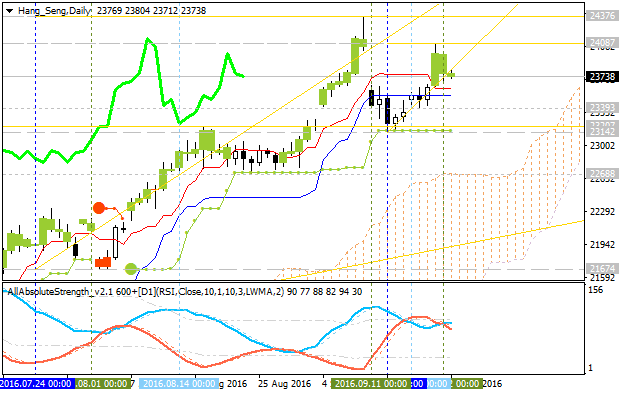
Daily price is located above Ichimoku cloud and Senkou Span line which is the virtual border between the primary bearish and the primary bullish trend on the chart.
- Symmetric triangle pattern was broken the price to above for the bullish trend to be continuing.
- Chinkou Span line broke the price to above (on open bar for now) for good possible breakout in the near future.
- The price is breaking 21,101 resistance level to above with 21,199 level to re-enter for the bullish breakout to be started.
Absolute
Strength indicator is still estimating the ranging condition so there are 3 main scenarios for the price movement for the year:
- Bullish Breakout: the daily price is breaking 21,199 resistance to above on close bar.
- Daily Bearish Reversal: the daily price is breaking 20,285 support to below.
- Ranging Bullish: the price will be on ranging within 21,200/20,200 area.
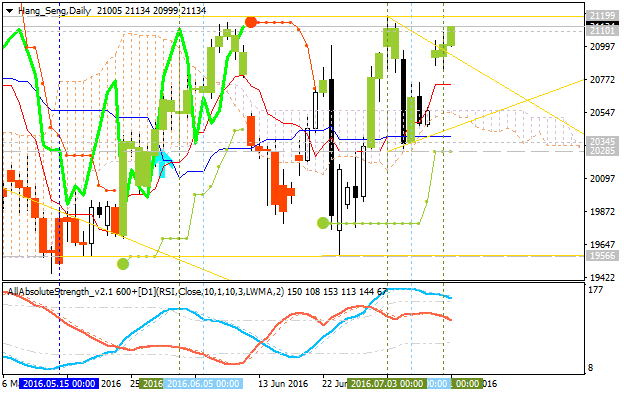
| Resistance | Support |
|---|---|
| 21,101 | 20,285 |
| 21,199 | 19,566 |
Hang Seng Index (HSI) Technical Analysis: new daily resistance on the way to the bullish continuation
Daily price is continuing with the primary bullish trend with new 'top' to be formed for the bullish trend to be continuing. The price is located within the following support/resistance levels:
- 22,087 key resistance level located far above Ichimoku cloud in the primary bullish area of the chart, and
- 21,558 key support level located above Ichimoku cloud in the beginning of the secondary correction to be started.
Absolute
Strength indicator is estimating the ranging bullish condition, and
Chinkou
Span line is located above the price for the primary bullish trend to be continuing in the future.
If D1 price breaks 21,558
support level on close bar so the local downtrend as the secondary correction within the primary bullish market condition will be started.
If D1 price breaks 22,087
resistance level on close bar so the bullish trend will be continuing.
If not so the price will be on ranging within the levels.
| Resistance | Support |
|---|---|
| 22,087 | 21,558 |
| N/A | 20,999 |
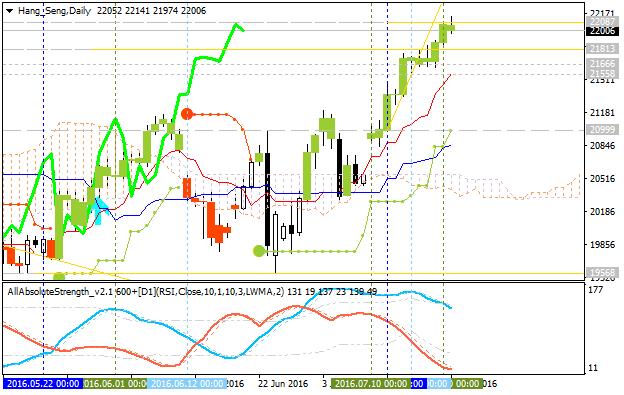
SUMMARY : bullish
Hang Seng Index: End Of Week Technicals - secondary correction is going to be started
This trading week ended with some interesting results so let's describe some of the interesting moments for HSI.
------------------
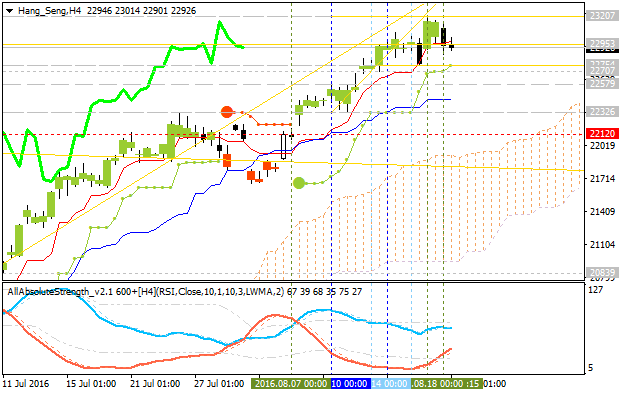
D1 price and H4 price are located on the bullish area of the chart with the ranging within key narrow s/r levels. The secondary correction is going to be started if the price breaks 21,841 support level to below on close bar with 21,666 target to re-enter, otherwise - ranging bullish trend will be continuing.
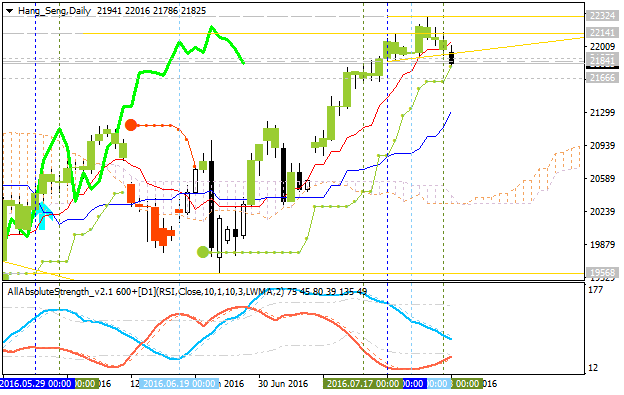
Chinkou Span line is located above the price indicating the correction to be started in the near future for both timeframes, and Absolute Strength indicator is estimating the local downtrend in the secondary ranging way within the primary bullish market condition.
If H4 price breaks 21,841
support level on close bar so the local downtrend as a secondary correction within the primary bullish market condition will be started with 21,666 target to re-enter.
If H4 price breaks 22.324
resistance level on close bar from below to above so the primary bullish trend will be resumed.
If not so the price will be on ranging bullish within the levels.
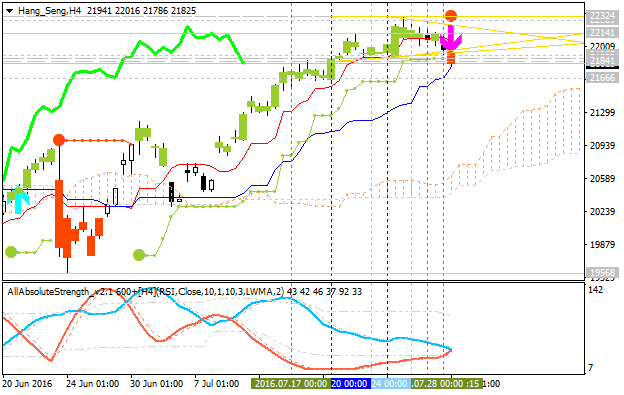
| Resistance | Support |
|---|---|
| 22.324 | 21,841 |
| N/A | 21,666 |
SUMMARY : bullish
Weekly
price is located near and below 100 period SMA (100 SMA) and 200 period SMA (200
SMA) for the secondary bear market rally with the possible bullish reversal. Price is located to be
within the following key support/resistance levels:
- 22,579 resistance level located near 200 SMA on the border between the primary bearish and the primary bullish trend on weekly chart, and
- 20,285 support level located far below 100 SMA/200 SMA in the primary bearish area.
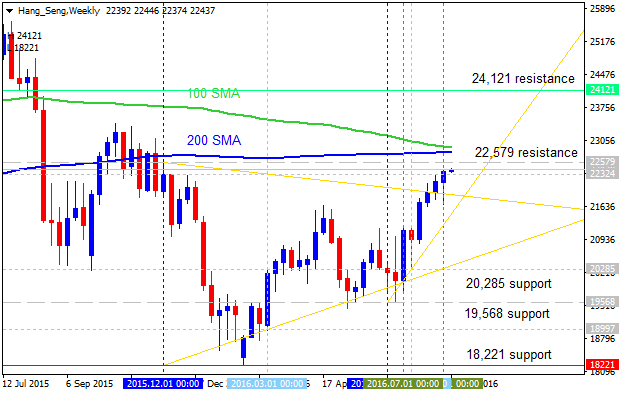
Ascending triangle pattern was formed by the price to be broken to above for the possible bullish reversal to be started in the future.
- If the price breaks 22,579
resistance level so the reversal of the price movement from the bearish to the primary bullish market condition will be started with 24,121 level asa nearest bullish target.
- If price breaks 20,285 support so the primary bearish trend will be continuing with 19,568 target to re-enter.
- If not so the price will be ranging within the levels.
| Resistance | Support |
|---|---|
| 22,579 | 20,285 |
| 24,121 | 19,568 |
Hang Seng Index (HSI): End Of Week Technicals - Bullish Ranging With Narrow Levels
This trading week ended with some results concerning HSI so, let's describe some of the interesting moments.
---------
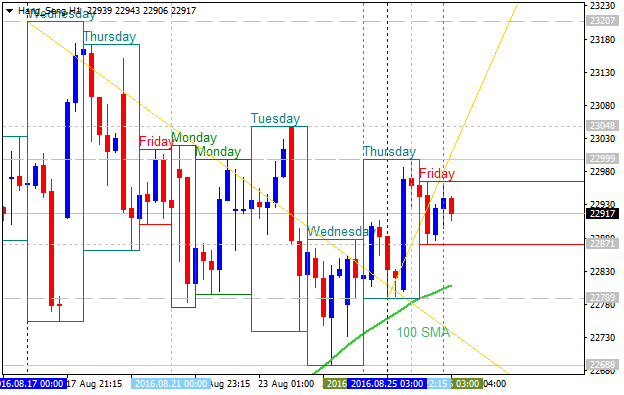
D1 price is on primary bullish market condition with the ranging to be started yesterday: the price is located within 23,207 resistance level and 22,953 support level. Price is testing 22,953 support to below for the ranging area to be expanded.
H4 price is on bullish condition located within s/r levels with the secondary ranging trend to be started:
- Chinkou Span line is located above the price for the ranging bullish trend to be continuing.
- Absolute Strength indicator is estimating the trend to be on ranging condition.
- The price is breaking 22,953 support level to below for the 22,754 level as a nearest target to re-enter.
- The nearest resistance level for the bullish trend to be resumed is 23,207.
- Nearest support levels are 22,754 and 22,120.
If H4 price breaks 23,207 resistance level so the primary bullish trend will be resumed.
If H4 price breaks 22,754 support so the local downtrend as the secondary correction within the primary bullish trend will be started.
If H4 price breaks 22,120 support so we may see the bearish reversal to be started for the intra-day price movement.
If not so the price will be ranging within the levels.
| Resistance | Support |
|---|---|
| 23,207 | 22,754 |
| N/A | 22,120 |
SUMMARY : bullish
Forum on trading, automated trading systems and testing trading strategies
Sergey Golubev, 2016.08.27 12:09
Stocks end mostly lower after Yellen speech (adapted from the article)
"Major U.S. indexes initially climbed after a speech by Fed Chair Janet Yellen that was bullish on the economy but gave no timetable for future rate increases. Then investors began to have second thoughts, wondering if an increase was possible as early as next month, and buyers turned to sellers."
- "Yellen's speech on Friday notwithstanding, not everyone is convinced a rate hike is coming soon."
- "She suggests the economy is improving, but the GDP numbers for the past three quarters are closer to 1 percent than three percent," said Bruce Bittles, chief investment strategist at R.W. Baird. "That is very anemic."
- "A report early in the day from the Commerce Department showed GDP, or gross domestic product, for the second quarter rose by a revised 1.1 percent, slightly lower than initially forecast."

"The S&P 500 slipped 3.43 points, or 0.2 percent, to 2,169.04. The Dow Jones industrial average fell 53.01 points, or 0.3 percent, to 18,395.40. The Nasdaq composite rose 6.71 points, or 0.1 percent, to 5,218.92."
"In Asia, Japan's Nikkei 225 fell 1.2 percent after consumer prices fell the most in three years in July. Hong Kong's Hang Seng index rose 0.4 percent."
Hang Seng Index (HSI) Pivot Points Analysis - bullish weekly reversal
W1 price is on bear market rally to the bullish reversal: the price is breaking Central Yearly Pivot at 23,408.
- The price is breaking 23,408 Central Pivot level to above on open weekly bar for the bullish reversal.
- Ascending
triangle pattern was formed by the price to be broken to above together
with 23,621 resistance for the bullish trend to be started.
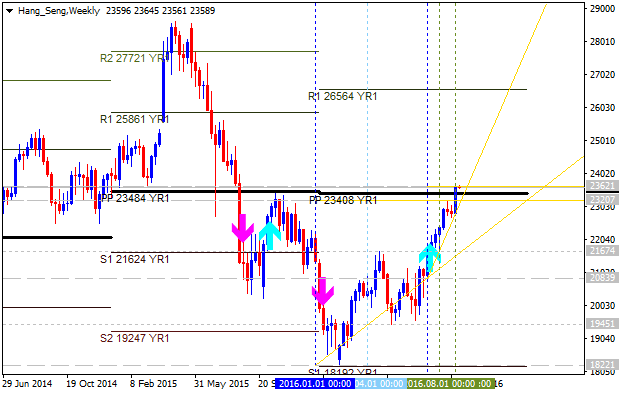
| Instrument | S1 Pivot | Yearly PP | R1 Pivot |
|---|---|---|---|
| HSI | 18,192 | 23,408 | 26,564 |
Trend:
- D1 - bear market rally
- W1 - bullish reversal
- MN1 - bullish reversal
Forum on trading, automated trading systems and testing trading strategies
Sergey Golubev, 2016.09.17 10:38
Weekly Outlook: 2016, September 18 - September 25 (based on the article)

The US dollar had a positive week, resisting unconvincing data. Now comes the biggest test: the Fed decision. In addition, we have US Building Permits, rate decisions in Japan and in New Zealand, as well as other events. These are the main events for this week.
- US Building Permits: Tuesday, 12:30. The number of new residential permits is expected to rise to 1.17 million in August.
- Stephen Poloz speaks: Tuesday, 17:45. BOC Governor Stephen Poloz will speak in Quebec.
- Japan rate decision: Wednesday.
- US Crude Oil Inventories: Wednesday, 14:30.
- US Fed Decision: Wednesday: statement and projections at 18:00, Yellen’s press conference at 18:30.
- NZ rate decision: Wednesday, 21:00. Governor Graeme announced new lending restrictions for property investors to cool the housing market and enable further rate cuts in the coming months.
- US Unemployment Claims: Thursday, 12:30. Economists expect the number of claims will reach 261,000 this week.
Hang Seng Index (HSI): End Of Week Technicals - bullish continuation or the correction to the bearish reversal
This trading week is ended with some results concerning HSI: the price was continuing with the daily bullish condition and started to be ranging within narrow support/resistance levels for the direction of the bullish continuation or the correction to the bearish reversal.
---------
D1 price is located to be above Ichimoku cloud for the primary bullish market condition with the ranging within the following s/r levels:
- 24,087 resistance level located far above Ichimoku cloud in the bullish area of the chart, and
- 23,142 support level located in the beginning fo the ranging secondary correction to be started.
H4 price is on bullish within s/r levels with the secondary ranging market condition:
- Chinkou Span line is located above the price for for the possible breakdown in the near future.
- Absolute Strength indicator is estimating the ranging condition to be continuing.
- Ascending triangle pattern was formed by the price to be broken to above for the bullish.
- The nearest resistance levels for the bullish trend to be resumed are 24,087 and 24,376.
- Nearest support levels for the bearish reversal are 23,393 and 23,207.

If H4 price breaks 24,087 resistance level so the primary bullish trend will be resumed with 24,376 possible bullish target.
If H4 price breaks 23,393 support so the local downtrend as the secondary ranging correction within the primary bullish trend will be started.
If H4 price breaks 23,207 support so we may see the bearish reversal to be started for this intra-day price movement.
If not so the price will be ranging within the levels.
| Resistance | Support |
|---|---|
| 24,087 | 23,393 |
| 24,376 | 23,207 |
SUMMARY : bullish
- Free trading apps
- Over 8,000 signals for copying
- Economic news for exploring financial markets
You agree to website policy and terms of use
Quick Technical Overview: Technical Targets for Hang Seng Index - intra-day/daily breakout with bullish reversal
H4 price broke 100 SMA/200 SMA reversal area once once again after Brexit brekdown on Friday: the price broke 200 SMA to above for the primary bullish market condition. Price is testing 21.001 resistance level to above for the bullish trend to be continuing with 21,160 resistance as a nearest bullish target.
Daily price was almost recovered: price broke 200 SMA with 21,001 resistance to be tested for 21,160 bullish target.