Forecast for Q4'16 - levels for Hang Seng Index (HSI)
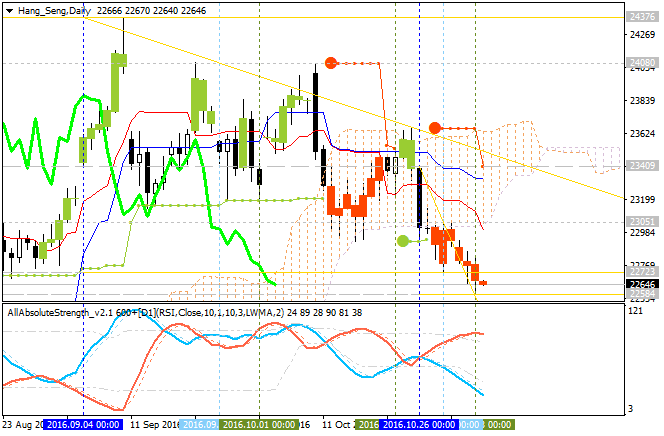
Hang Seng Index Daily Technicals: bullish ranging inside s/r channel
Daily price is on ranging within the following key support/resistance levels:
- 23,911 resistance located above Ichimoku cloud, and
- 23,204 support level located inside Ichimoku cloud in the beginning of the bearish reversal to be started.
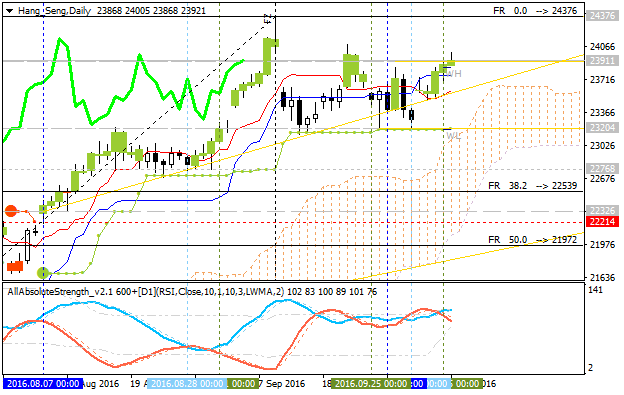
If the price breaks 23,911 level to above on close daily bar so the bullish trend will be resumed.
If the price breaks 23,204 support level on close bar to below so we may see the bearish reversal of thee daily price movement.
If not so the price will be on bullish ranging within the levels.
Hang Seng Index: End Of Week Technicals - key resistance level to be tested for the bullish reversal
This
trading week is ended with some results concerning Hang Seng Index: the price
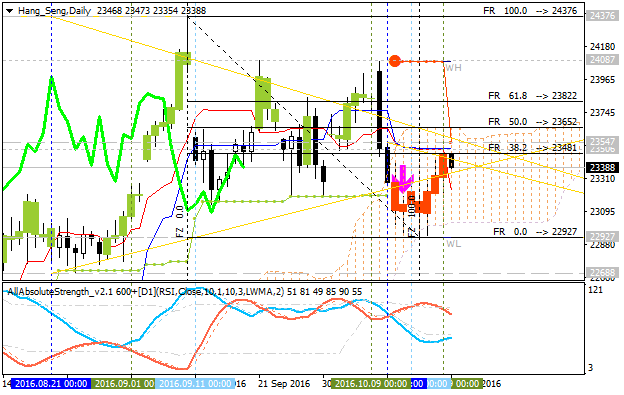
was bounded from the lower band of Ichimoku cloud to the Senlou Span line which is the virtual border between the primary bearish and the primary bullish trend on the chart. If the price breaks Senkou Span together with 23,652 resistance level to above so the daily bullish reversal will be started.
D1 price is located to be inside Ichimoku cloud for the ranging market condition with the secondary rally to be going on for whole the week for example. The price is located within the following key reversal s/r levels:
- 23,652 resistance level located on in the beginning of the bullish trend to be started, and
- 22,927 support level located near and below Ichimoku cloud for the primary bearish trend to be resumed.
H4 price is on local uptrend as the secondary rally within the primary bearish market condition:
- Chinkou Span line is located near and below the price for the ranging bearish condition by the direction.
- Absolute Strength indicator is estimating the rally to be continuing.
- Symmetric triangle pattern was formed by the price to be crossed for the direction of the trend.
- The nearest resistance level for the bullish reversal is 23,652.
- The nearest support level for the bearish trend to be resumed is 22,927.
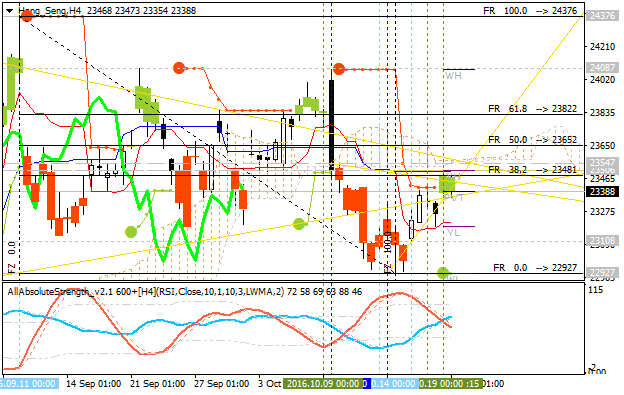
If H4 price breaks 23,652 resistance level so the reversal of the price movement from the ranging bearish to the primary bullish market condition will be started.
If H4 price breaks 22,927 support so the primary bearish trend will be resumed.
If not so the price will be on bearish ranging within the levels.
| Resistance | Support |
|---|---|
| 23,652 | 23,108 |
| N/A | 22,927 |
SUMMARY : bearish
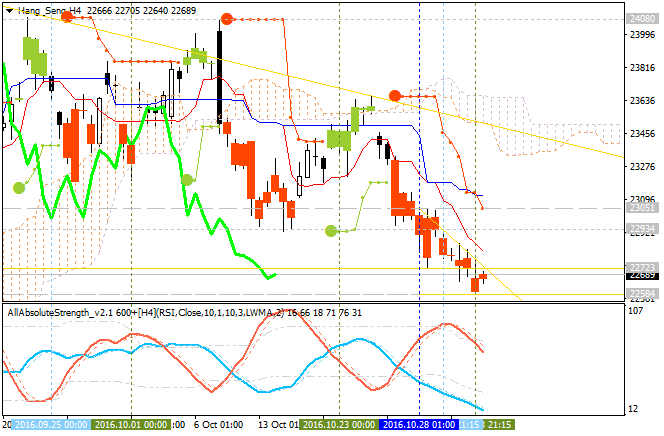
Hang Seng Index: End Of Week Technicals - bearish breakdown reversal
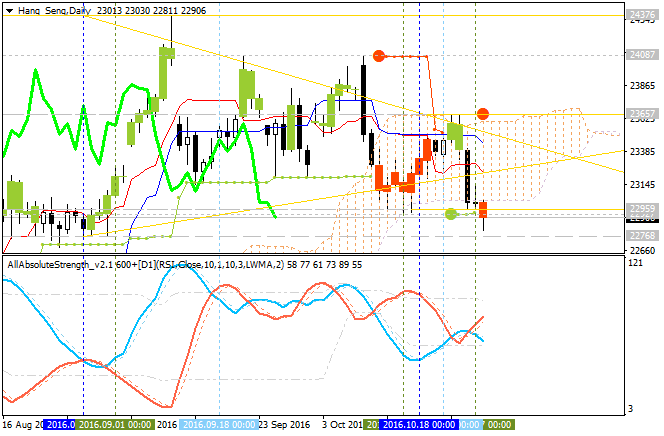
This trading week is ended with some results concerning Hang Seng Index: the price broke Ichimoku cloud to below to be reversed from the ranging bearish market condition to the primary bullish trend. The price is breaking 22,927 support level to below for the bearish trend to be continuing with 22,768 daily bearish target to re-enter.
---------D1 price is located below Ichimoku cloud for on the bearish area of the chart to be located within the following key s/r levels:
- 23,657 resistance level located on in the beginning of the bullish trend to be started, and
- 22,768 support level located below Ichimoku cloud for the primary bearish trend to be resumed.
H4 price is on berish breakdown to be below Ichimoku cloud: the price is breaking 22,927 support level to below for the bearish breakdown to be continuing:
- Chinkou Span line is below the price for the bearish breakdown by the direction.
- Absolute Strength indicator is estimating the bearish trend to be continuing.
- The nearest resistance level for the bullish reversal is 23,652.
- The nearest support level for the bearish trend to be resumed is 22,927.
If H4 price breaks 23,657 resistance level so the reversal of the price movement from the ranging bearish to the primary bullish market condition will be started.
If H4 price breaks 22,927 support so the primary bearish trend will be resumed.
If not so the price will be on bearish ranging within the levels.
| Resistance | Support |
|---|---|
| 23,464 | 22,927 |
| 23,657 | 22,768 |
SUMMARY: bearish
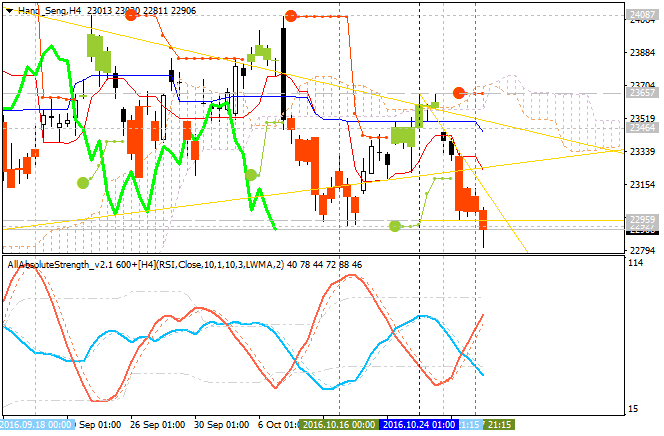
Hang Seng Index: End Of Week Technicals - breakdown with 22,584 support
This trading week is ended with some results concerning Hang Seng
Index: the daily bearish breakdown is going to be continuing for the week with 22,584 support level to be broken for the bearish breakdown to be resumed.
D1 price is located below Ichimoku cloud for on the bearish area of the chart to be located within the following key s/r levels:
- 23,409 resistance level located on in the beginning of the bullish trend to be started, and
- 22,584 support level located below Ichimoku cloud for the primary bearish trend to be resumed.
H4 price is on bearish breakdown to be below Ichimoku cloud: the price is breaking 22,584 support level to below for the bearish breakdown to be continuing:
- Chinkou Span line is below the price for the bearish breakdown by the direction.
- Absolute Strength indicator is estimating the ranging condition to be started within 22,584/22,723 narrow levels.
- The nearest resistance level for the local uptrend as the secondary rally within the primary bearish is 23,051.
- The nearest resistance level for the bullish reversal is 23,507.
- The nearest support level for the bearish trend to be resumed is 22,584.
If H4 price breaks 23,507
resistance level so the reversal of the price movement from the ranging
bearish to the primary bullish market condition will be started.
If H4 price breaks 22,584 support so the primary bearish trend will be resumed.
If not so the price will be on bearish ranging within the levels.
| Resistance | Support |
|---|---|
| 23,051 | 22,584 |
| 23,507 | N/A |
SUMMARY: bearish
Hang Seng Index: End Of Week Technicals - ranging with narrow levels waiting for direction
This trading week is ended with some results concerning Hang Seng
Index: the daily price was bounced from 21,903 support level to above for the ranging condition to be started within the primary bearish trend.
D1 price is located below Ichimoku cloud for the ranging within the following key s/r levels:
- 22,487 resistance level located in the beginning of the local uptrend as the bear market rally to be started, and
- 21,903 support level located far below Ichimoku cloud for the primary bearish trend to be resumed.
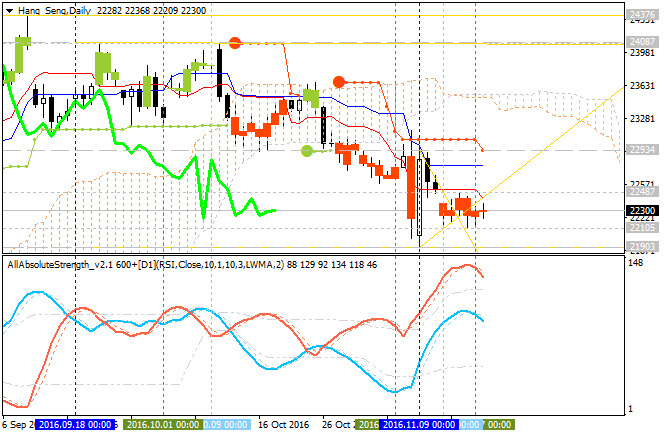
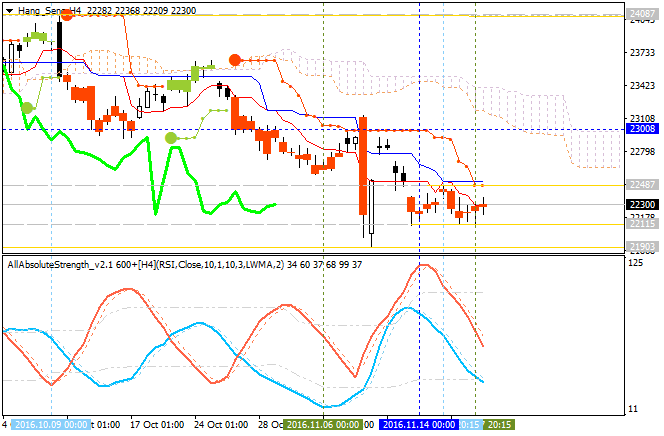
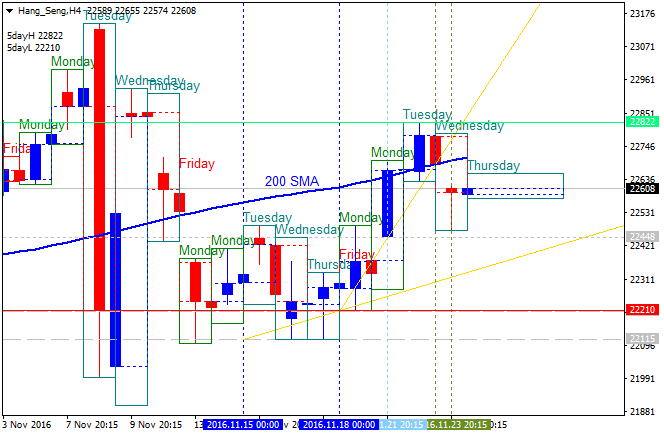
H4 price is on located on the bearish area of the chart for the ranging within the narrow s/r levels waiting for direction:
- Chinkou Span line is below the price indicating the ranging bearish trend in the near future.
- Absolute Strength indicator is estimating the flat.
- The nearest resistance level for the local uptrend as the secondary rally within the primary bearish is 22,487.
- The nearest resistance level for the bullish reversal is 23,008.
- The nearest support levels for the bearish trend to be resumed are 22,115 and 21,903.
If H4 price breaks 22,487
resistance level to above on close bar so the local uptrend as the bear market rally will be started.
If H4 price breaks 23,008
resistance level to above on close bar so we may see the reversal of the price movement from the bearish to the primary bullish market condition.
If H4 price breaks 22,115 support on close bar so the primary bearish trend will be resumed with 21,903 bearish target to re-enter.
If not so the price will be on bearish ranging within the levels.
| Resistance | Support |
|---|---|
| 23,051 | 22,115 |
| 23,507 | 21,903 |
SUMMARY: bearish
Forum on trading, automated trading systems and testing trading strategies
Sergey Golubev, 2016.11.24 10:46
China's stocks were higher; Hang Seng index dropped 0.4 percent (based on the article)
- "China's stocks were higher on Thursday, with the blue-chip CSI300 index on track to rise for the fourth day as raw material shares powered ahead on the back of soaring metal prices."
- "The Shanghai Composite Index gained 0.1 percent, to 3,244.21 points, while Shenzhen's start-up board ChiNext fell 0.3 percent."
- "Shares in China's major base metal producers, including Shenzhen Zhongjin Lingnan Nonfemet and Jiangxi Copper rose sharply as futures prices of copper, zinc and nickel jumped, maintaining strong upward momentum."
- "The Hang Seng index dropped 0.4 percent, to 22,597.88 points, while the Hong Kong China Enterprises Index lost 0.2 percent, to 9,646.98."
- "The prospect of rapid capital flight from emerging markets is a key risk factor for investors in Asia, especially under U.S. President-elect Donald Trump's policies. Traders are betting on a faster pace of monetary tightening by the Fed as Trump's policies are expected to boost domestic economic growth and push inflation higher."
Hang Seng Index Pivot Points Analysis: bounced from yearly Central Pivot to below for the bearish trend to be resumed
W1 price was on bearish breakdown since the end of 2015 by breaking Central Pivot to below for the reversal of the price movement to the primary bearish market condition. The bearish breakdown was going to be continuing since the Fenruary this year by the local uptrend as the bear market rally to be started: the price broke S1 Pivot at 20,251 to above for the Central Pivot at 24,437 to be tested for the bullish reversal to be started or for the bearish trend to be continuing.
For now, the price was bounced from Central Pivot at 24,437 for the rimary ebarish market condition to be started with 21,903 support level to be tested for the bearish trend to be continuing.
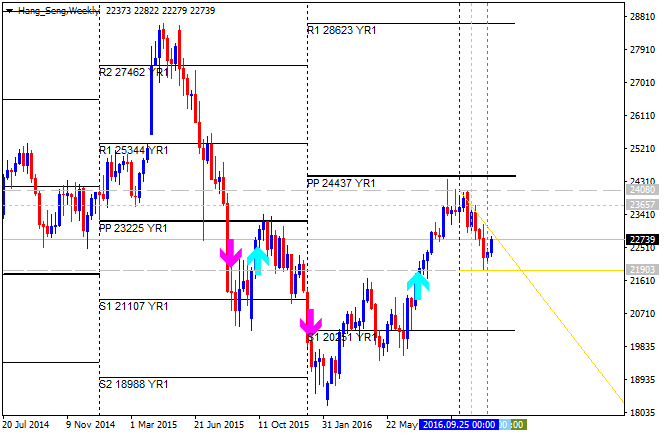
| Instrument | S1 Pivot | Yearly PP | R1 Pivot |
|---|---|---|---|
| Hang Seng |
20,251 | 24,437 | 28,623 |
Trend:
- W1 - bearish
Forum on trading, automated trading systems and testing trading strategies
Sergey Golubev, 2016.12.20 13:49
Quick technical Overview - Hang Seng Index: correction with the possible bearish ranging reversal (based on the article)
Weekly price is on the secondary correction within the primary bullish market condition: the price is testing 21,785 support level to below together with Senkou Span line to be reversed to the ranging bearish contion.
- "The Hang Seng Index tumbled over 1,200 points, or 5% over the last two weeks. The selling was accompanied by emerging market outflow as the US dollar surged to a decade’s high. The fast depreciating of RMB also urged outflow from the China market, further weighing on Hong Kong equities."
- Chinkou Span line is located above the price indicating the possible bearish breakdown in the near future. And Absolute Strength indicator is estimating the future possible trend as the primary bearish.
If price breaks 24,376 resistance level so the primary bullish trend will be resumed.
If the weekly price breaks 21,785 support level so bearish reversal will be started on the secondary ranging way: the price will be located inside Ichimoku cloud.
If not so the price will be on ranging within the levels.
- Free trading apps
- Over 8,000 signals for copying
- Economic news for exploring financial markets
You agree to website policy and terms of use
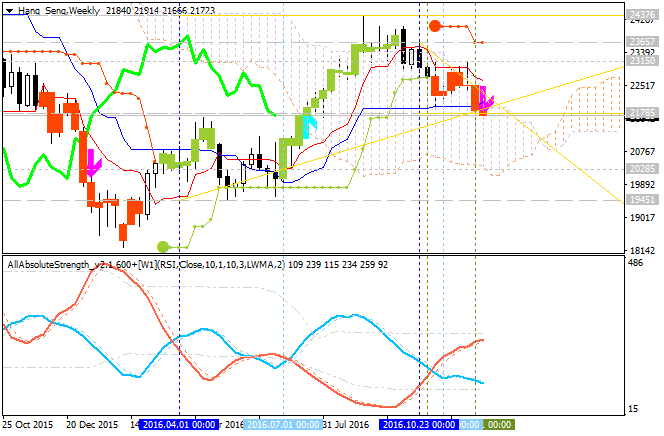
Hang Seng Index October-December 2016 Forecast: bullish trend to be continuing or the ranging to be started?
W1 price was on breakout with the bullish reversal: the price broke Ichimoku cloud to above to be reversed from the primary bearish to the primary bullish market condition. For now, the price is located near and above Senkou Span line which is the virtual border between the primary bearish and the primary bullish trend on the chart. Descending triangle pattern was formed by the price to be crossed to below for the ranging condition to be started.
Chinkou Span line is located above the price indicating the bullish market condition, Tenkan-sen line is above Kijun-sen line for the bullish trend to be continuing, and Absolute Strength indicator is estimating the trend to be ranging as well in the future.
W1 - bullish