EURUSD Technical Analysis 2016, 11.09 - 18.09: ranging above Ichimoku cloud
Forum on trading, automated trading systems and testing trading strategies
Sergey Golubev, 2016.09.11 19:02
Credit Agricole: Get Ready For Volatile Week (based on the article)
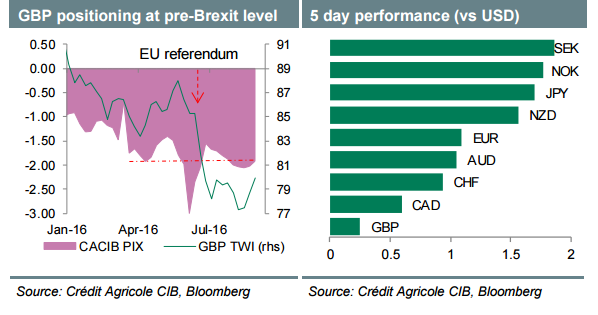
- "EUR should remain relatively supported in the aftermath of the September ECB meeting, which highlighted that the Governing Council may find it hard to add further stimulus in response to a persistently challenging economic outlook."
- "The USD-bulls may have to endure another volatile week, with August retail sales and industrial production likely to attract considerable attention. That said, we note that various Fed officials have signalled willingness to proceed with rate normalisation despite disappointing data of late. With the market rate hike expectations relative low at present, we believe that any positive economic surprises should have a disproportionately greater impact on USD."
- "We believe that the Fed is closer to hiking rates than rates markets seem to believe, while both the BoJ and the ECB are struggling to add fresh stimulus."
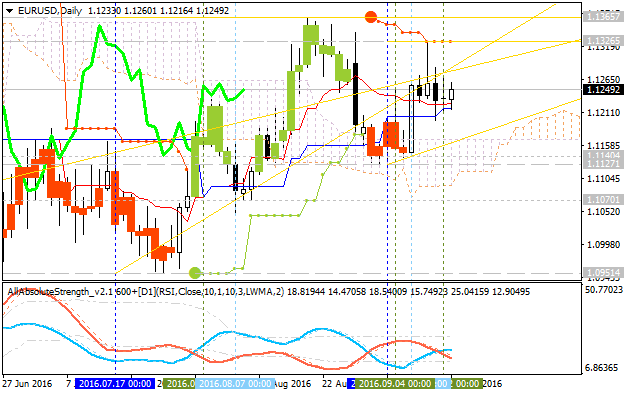
Daily price is on ranging market condition located above Ichimoku cloud in the bullish area of the chart within the following support/resistance levels:
- 1.1326 resistance level located above Ichimoku cloud in the bullish area, and
- 1.1122 support level located inside Ichimoku cloud to be near and above Senkou Span line in the beginning of the bearish trend to be started.
Absolute Strength indicator is estimating the bullish trend to be resumed, and Trend Strength indicator is evaluating the future possible trend as a secondary ranging.
If D1 price breaks 1.1326 resistance level on close bar from below to above so the bullish trend will be resumed with 1.1366 nearest bullish target to re-enter.
If not so the price will be on bullish ranging within the levels.
- Recommendation for long: watch close D1 price to break 1.1326 for possible buy trade
- Recommendation
to go short: watch D1 price to break 1.1122 support level for possible sell trade
- Trading Summary: ranging
| Resistance | Support |
|---|---|
| 1.1326 | 1.1122 |
| 1.1366 | 1.1045 |
SUMMARY : bullish
TREND : rangingDaily price is still on bullosh raanging within 1.1126 (former 1.1122) bearish reversal support level and 1.1326 bullish continuation level. Absolute Strength indicator is evaluating the bullish trend to be resumed but 1.1326 resistance level is very unlikely to bebroken for this week for example.
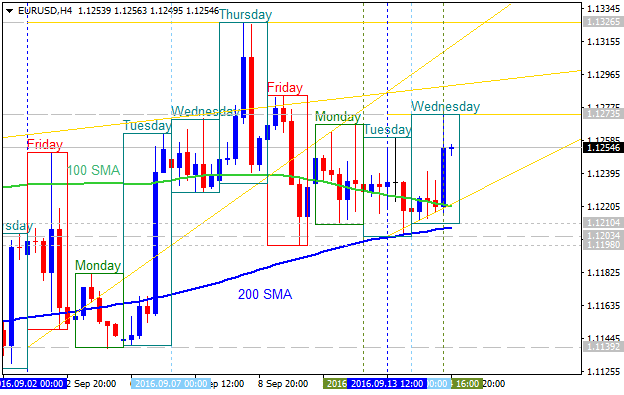
EUR/USD Intra-Day Technical Analysis - ascending triangle to be broken for the bullish trend to be continuing
H4 price
is located above SMA with period 100 (100 SMA) and SMA with the period
200 (200 SMA) in the bullish area of the chart: the price was bounced from 1.1210 support level to above for the bullish trend to be resumed. Ascending triangle pattern was formed by the price to be crossed to above for the bullish trend to be continuing with 1.1273 resistance level.
- If H4 price breaks 1.1273 resistance level to above on close bar so the primary bullish trend will be continuing.
- If the price breaks 1.1210 support so the reversal of the intra-day price movement from the bullish to the primary bearish market condition will be started.
- If not so the price will be ranging within the levels.
| Resistance | Support |
|---|---|
| 1.1273 | 1.1210 |
| 1.1326 | 1.1139 |
- Recommendation to go short: watch the price to break 1.1210 support level for possible sell trade
- Recommendation to go long: watch the price to break 1.1273 resistance level for possible buy trade
- Trading Summary: bullish
SUMMARY : bullish
Forum on trading, automated trading systems and testing trading strategies
Sergey Golubev, 2016.09.15 15:01
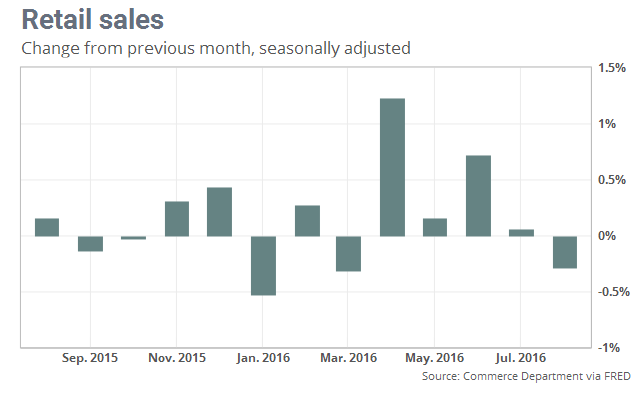
Intra-Day Fundamentals - EUR/USD, USD/CAD and AUD/USD: U.S. Retail Sales and U.S. Philadelphia Fed Business Outlook Survey
2016-09-15 12:30 GMT | [USD - Retail Sales]
- past data is 0.1%
- forecast data is -0.1%
- actual data is -0.3% according to the latest press release
if actual > forecast (or previous one) = good for currency (for USD in our case)
[USD - Retail Sales] = Change in the total value of sales at the retail level.
==========
==========
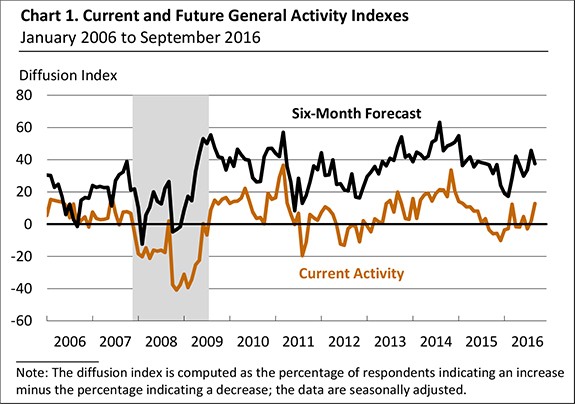
2016-09-15 12:30 GMT | [USD - Philly Fed Manufacturing Index]
- past data is 2.0
- forecast data is 1.1
- actual data is 12.8 according to the latest press release
if actual > forecast (or previous one) = good for currency (for USD in our case)
[USD - Philly Fed Manufacturing Index] = Level of a diffusion index based on surveyed manufacturers in Philadelphia.
==========
==========
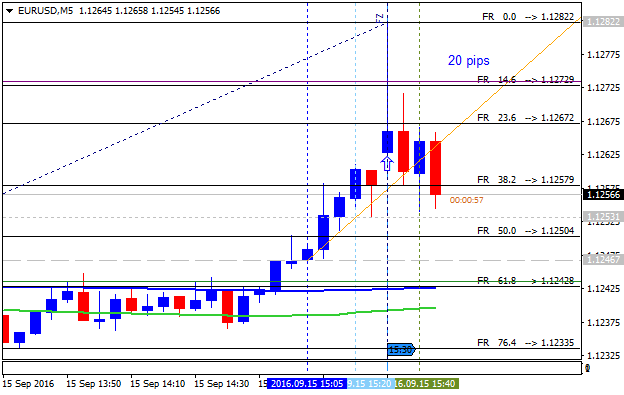
EUR/USD M5: 20 pips price movement by U.S. Retail Sales and Philly Fed Manufacturing Index news events
==========
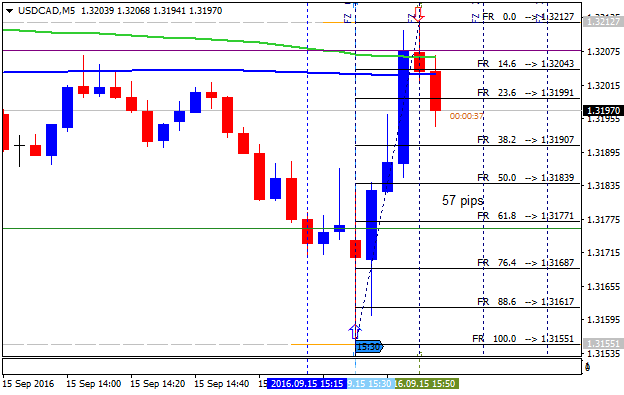
USD/CAD M5: 57 pips range price movement by U.S. Retail Sales and Philly Fed Manufacturing Index news events
==========
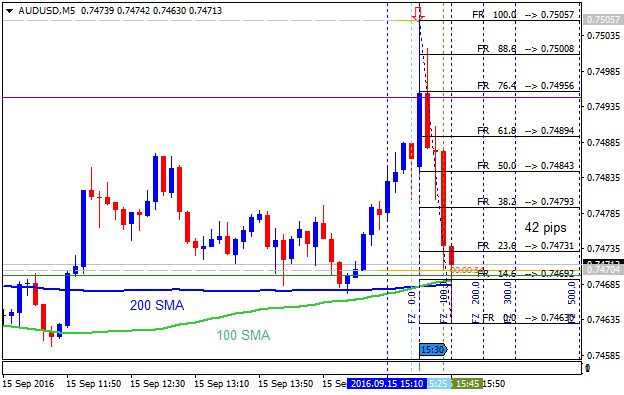
AUD/USD M5: 42 pips range price movement by U.S. Retail Sales and Philly Fed Manufacturing Index news events
Forum on trading, automated trading systems and testing trading strategies
Sergey Golubev, 2016.09.16 14:54
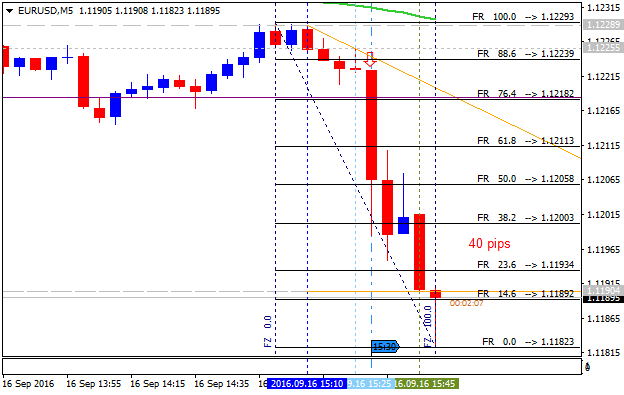
EUR/USD Intra-Day Fundamentals: U.S. Consumer Price Index and 40 pips price movement
2016-09-16 12:30 GMT | [USD - CPI]
- past data is 0.0%
- forecast data is 0.1%
- actual data is 0.2% according to the latest press release
if actual > forecast (or previous one) = good for currency (for USD in our case)
[USD - CPI] = Change in the price of goods and services purchased by consumers.
==========
==========
EUR/USD M5: 40 pips price movement by U.S. Consumer Price Index news event
- Free trading apps
- Over 8,000 signals for copying
- Economic news for exploring financial markets
You agree to website policy and terms of use
Daily price is on ranging market condition located above Ichimoku cloud in the bullish area of the chart within the following support/resistance levels:
Absolute Strength indicator is estimating the bullish trend to be resumed, and Trend Strength indicator is evaluating the future possible trend as a secondary ranging.
If D1 price breaks 1.1122 support level on close bar so the reversal of the daily price movement from the ranging bullish to the primary bearish market condition will be started with 1.1045 target.If D1 price breaks 1.1326 resistance level on close bar from below to above so the bullish trend will be resumed with 1.1366 nearest bullish target to re-enter.
If not so the price will be on bullish ranging within the levels.
SUMMARY : bullish
TREND : ranging