Something Interesting in Financial Video July 2015
Forum on trading, automated trading systems and testing trading strategies
Something Interesting in Financial Video June 2015
Sergey Golubev, 2015.06.29 11:31
Ichimoku: Strategies, Setups and What to Watch for
Many traders have had challenges trading the JPY pairs. However the
Japanese traders have had large amounts of success in trading their
native currency. This is not just due to familiarity, but the approach
and indicators they use to measure key levels for these pairs - the
Ichimoku Cloud.
This indicator is not only easy to learn, but highly accurate in giving JPY trading signals. When one learns how to use it correctly, one can build a very high accuracy and profit ratio trading the JPY pairs which can be some of the most volatile. Taking this class can give you a chance to master trading the yen and learn a unique approach to trading the Asian pairs as a whole.
Forum on trading, automated trading systems and testing trading strategies
Something Interesting in Financial Video January 2014
Sergey Golubev, 2014.01.19 07:43
01: NON FARM PAYROLL (Part 1) - ECONOMIC REPORTS FOR ALL MARKETSThis is the 1st video in a series on economic reports created for all markets, or for those who simply have an interest in economics. In this and the next lesson, we cover the Employment Situation Report, also known as Non Farm Payroll.
============
Non-farm Payrolls (metatrader5.com)Non-farm Payrolls is the assessment of the total number of employees recorded in payrolls.
This is a very strong indicator that shows the change in employment in the country. The growth of this indicator characterizes the increase in employment and leads to the growth of the dollar. It is considered an indicator tending to move the market. There is a rule of thumb that an increase in its value by 200,000 per month equates to an increase in GDP by 3.0%.
- Release Frequency: monthly.
- Release Schedule: 08:30 EST, the first Friday of the month.
- Source: Bureau of Labor Statistics, U.S. Department of Labor.
============
FF forum economic calendar :
- Source : Bureau of Labor Statistics
- Measures : Change in the number of employed people during the previous month, excluding the farming industry
- Usual Effect : Actual > Forecast = Good for currency
- Frequency : Released monthly, usually on the first Friday after the month ends
- Why Traders Care : Job creation is an important leading indicator of consumer spending, which accounts for a majority of overall economic activity
- Also Called : Non-Farm Payrolls, NFP, Employment Change
============
mql5 forum thread : Non-Farm Employment Strategy
============
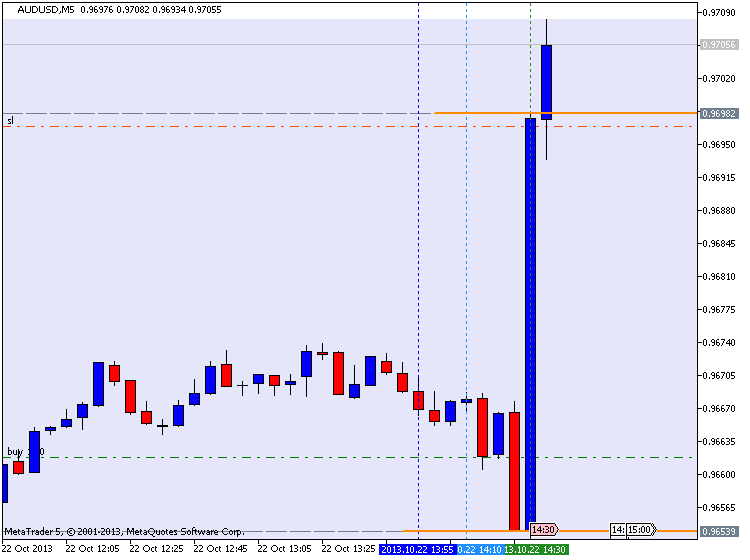
AUDUSD M5 with 45 pips in profit (by equity) for NFP :
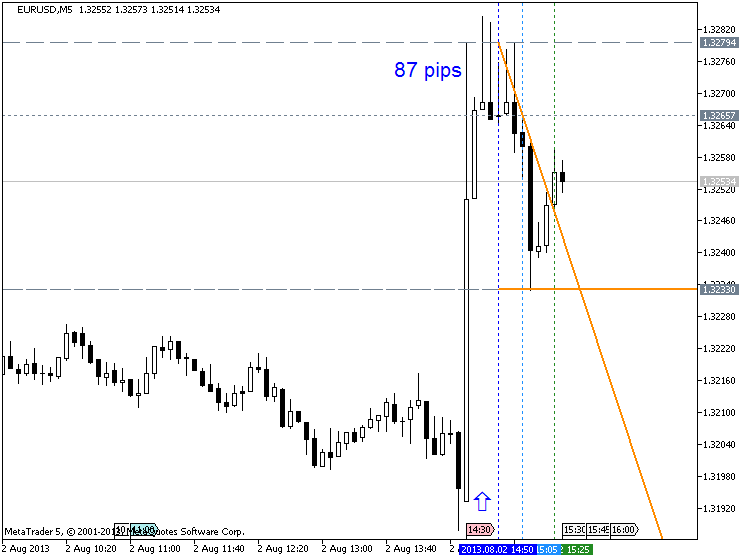
EURUSD M5 : 87 pips price movement by NFP news event :
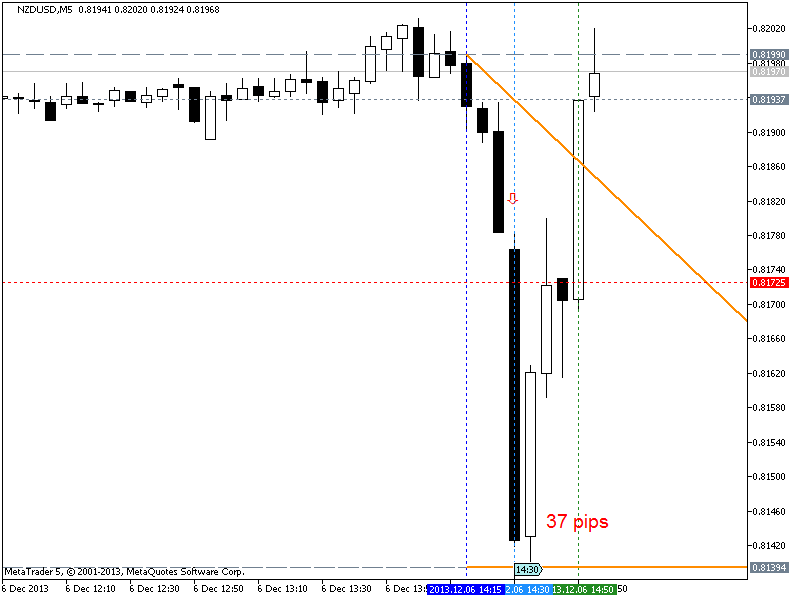
NZDUSD M5 : 37 pips price movement by USD - Non-Farm Employment Change :
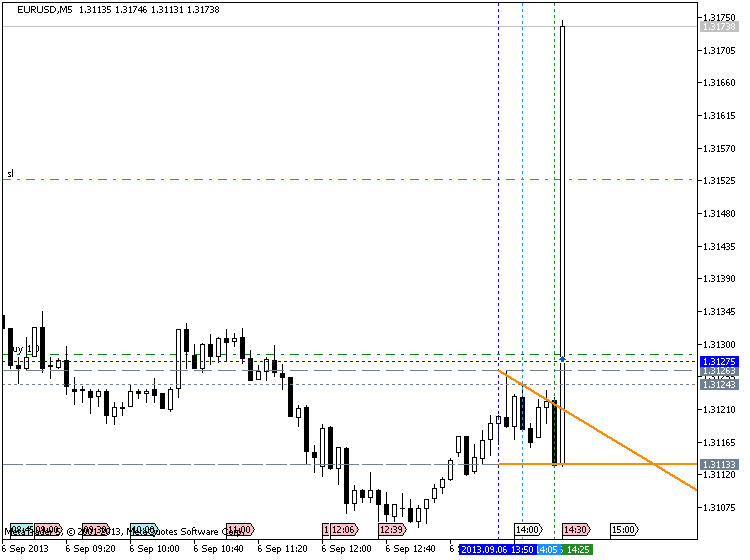
Trading EURUSD during NFP :
==================
Forum on trading, automated trading systems and testing trading strategies
Something Interesting in Financial Video January 2014
Sergey Golubev, 2014.01.23 12:58
02: NON FARM PAYROLL (Part 2)- ECONOMIC REPORTS FOR ALL MARKETS
This is the second part of video lesson about nfp. The first part of the lesson is on this post :
============
Gold, Silver and Greek Referendum and propaganda machine
This is the interview about the problem in Greece and about the precious metals miners, and the positive (long term) outlook of that beaten down industry. This lead to gold and silver, and what is happening with the massive open interest on silver.
Forum on trading, automated trading systems and testing trading strategies
Something Interesting in Financial Video April 2014
Sergey Golubev, 2014.04.02 08:47
Technical Analysis Indicator MACD part one
Most technical analysis indicators are lagging. Let show you how to use MACD properly and its Leading indicator values.
Forum on trading, automated trading systems and testing trading strategies
Sergey Golubev, 2014.01.28 07:59
What is the MACD Indicator? How do I use it? (based on dailyforex article)
One of the most common technical indicators that is used by day traders in the financial markets can be seen in the Moving Average Convergence Divergence -- more commonly referred to as the MACD. But one mistake that many new traders make is that they will simply start using this indicator without really understanding how it functions or makes its calculations. This can lead to costly mistakes that should have been completely avoidable. So, it makes sense to study the logic and calculations behind the MACD (and all other indicators) in order to more accurately configure your day trading positions and generate gains on a consistent basis.
The Moving Average Convergence Divergence (MACD) Defined
Anyone with any experience in the forex markets and in technical
analysis strategies has likely heard a great deal about the Moving
Average Convergence Divergence (MACD). But what exactly does the MACD
tell us -- and how is it calculated? Without an understanding of these
areas, it can be difficult to see trading signals as they emerge. Here,
will deconstruct the MACD indicator and explain how and why it is
commonly used.
“In its most basic form,” said Haris Constantinou, markets analyst, “the
MACD is a momentum indicator that is designed to follow existing trends
and find new ones.” The MACD does this by showing the differences and
relationships between a two-level combination of moving averages and
price activity itself.
MACD Calculations
To determine and calculate the MACD, we must subtract a 26 period
Exponential Moving Average (EMA) from a 12 period EMA. Then, a 9 period
EMA of the MACD is plotted, and this becomes the Signal Line for the
indicator. The Signal Line is plotted over the MACD and this will be
used as the trigger reading for trading signals (both buy signals and
sell signals). These elements form the basis of the MACD construction,
and it is important to have a strong understanding of these elements if
you plan on using the indicator in your daily trading.
Three Common Approaches to the MACD
Now that we understand the basics of how the MACD is calculated, it is a
good idea to look at some of the common ways that the MACD is viewed by
traders so that we can get a sense of how exactly the indicator is used
to identify trading opportunities. There are a few different ways the
indicator can be interpreted, and the three of the most common methods
proven to be the most effective for traders include
- Crossovers,
- Divergences,
- and in identifying Overbought / Oversold conditions
Forum on trading, automated trading systems and testing trading strategies
Something Interesting in Financial Video April 2014
Sergey Golubev, 2014.04.02 08:51
Technical Analysis Indicator MACD part twoPart two of the three part series on MACD
Forum on trading, automated trading systems and testing trading strategies
Something Interesting in Financial Video April 2014
Sergey Golubev, 2014.04.02 08:57
Technical Analysis Indicator MACD part three
The final wrap up in the three part series on MACD
Forum on trading, automated trading systems and testing trading strategies
Something Interesting in Financial Video April 2015
Sergey Golubev, 2015.04.20 08:13
Order Flow Scalping with John Grady
What is happening? Why do prices fluctuate? Why should order flow play a critical role in your methodology? It's an auction. When buyers overwhelm sellers, the market goes up. When sellers overwhelm buyers, the market goes down. This is why size matters. What we're trying to do is ride the coattails of guys who move size and ride the wave created by all the small traders who pile on board and help create the domino effect.
The importance of a good DOM
Most people do not understand why order flow is important because they have never seen a good DOM.
An inside look into the world of proprietary trading firms
Explanation of how prop firms work and how they train traders.
Charts only show you the past price. They do not show you how the market traded at that price. How much volume changed hands and the way that exchange affected price makes a difference if you are contemplating getting involved in that area.
Predicting the future
Believing I know where
the market will be an hour from now, let alone three days from now, is
believing that I know something the rest of the world does not know. If
large institutions, speculators and high frequency trading programs who
move thousands of contracts and actually move the market are not
currently involved and showing no signs of playing the game (i.e. a slow
market with very little volatility), why would I want to be involved?
Video samples showing different types of action
Would
like to show a few samples of prices being hit during fast action vs.
dead action. Not going to show any actual trades as I do not want it to
look like I'm pitching myself or cherry picking winners. Just want to
demonstrate how sometimes it's obvious that you should probably be going
one way if you're contemplating an entry and other times there's simply
no educated guess to be made. This is clearly seen in the order flow.
Methodology vs. psychology
Developing a winning methodology is only the first part. The next part, which is equally important, is developing a proper risk methodology and understanding your own psychology when it comes to adhering to this risk methodology.
The Quantitative Discretionary Trader with Adam Grimes
Adam has two decades of experience in the industry as a trader, analyst and system developer, covering the full range of liquid markets and timeframes from scalping to long-term investing. He has traded privately for his own account, held a number of positions for investment firms, spent a few years at the Nymex, and now is a Managing Partner and CIO at Waverly Advisors - a boutique research and advisory firm for which he writes daily market commentary and trade notes.
- Why blend quantitative and discretionary tools?
- How to understand randomness and why it matters.
- Tools for analyzing market problems.
- Specific trading patterns.
- Putting it all together: the process of becoming a trader.
Forum on trading, automated trading systems and testing trading strategies
Something Interesting in Financial Video February 2014
Sergey Golubev, 2014.02.02 09:07
Ichimoku - Kumo Cloud Studies I
- Ichimoku - about this indicator in general, what every line of this indicator means.
- Ichimoku cloud, how to use it with trading
- Ichimoku Trading - Ichimoku Training - Support and Resistance with the Ichimoku Cloud Trading
- Kumo Breakout Trading with the Ichimoku System.
- Ichimoku vs Moving Average Trade Analysis.
- Ichimoku vs Moving Average Trade Analysis
- Technical Analysis Course - Module 10: Cloud Charts: the Ichimoku Technique
- Ichimoku - Drawbacks Of Ichimoku Kinko Hyo
- Free trading apps
- Over 8,000 signals for copying
- Economic news for exploring financial markets
You agree to website policy and terms of use
Please upload forex video you consider as interesting one. No direct advertising and no offtopic please.
The comments without video will be deleted.