Discussing the article: "Algorithmic Trading Strategies: AI and Its Road to Golden Pinnacles"
After reading the article, I had an idea to play with the clustering process itself.
I wrote a variant that performs clustering in a sliding window instead of on the whole dataset. This may improve the partitioning of clusters, taking into account the temporal structure of BP.
def sliding_window_clustering(dataset, n_clusters: int, window_size=200) -> pd.DataFrame:
    import numpy as np

    data = dataset[(dataset.index < hyper_params['forward']) & (dataset.index > hyper_params['backward'])].copy()
    meta_X = data.loc[:, data.columns.str.contains('meta_feature')]

    # First we create global reference centroids
    global_kmeans = KMeans(n_clusters=n_clusters).fit(meta_X)
    global_centroids = global_kmeans.cluster_centers_

    clusters = np.zeros(len(data))

    # Apply clustering in a sliding window
    for i in range(0, len(data) - window_size + 1, window_size):
        window_data = meta_X.iloc[i:i+window_size]

        # Teach KMeans on the current window
        local_kmeans = KMeans(n_clusters=n_clusters).fit(window_data)
        local_centroids = local_kmeans.cluster_centers_

        # Match the local centroids to the global centroids
        # to ensure consistency of cluster labels
        centroid_mapping = {}
        for local_idx in range(n_clusters):
            # Find the nearest global centroid to this local centroid
            distances = np.linalg.norm(local_centroids[local_idx] - global_centroids, axis=1)
            global_idx = np.argmin(distances)
            centroid_mapping[local_idx] = global_idx + 1  # +1 to start numbering from 1

        # Get the labels for the current window
        local_labels = local_kmeans.predict(window_data)

        # Convert local labels to consistent global labels
        for j in range(window_size):
            if i+j < len(clusters):  # Checking for out of bounds
                clusters[i+j] = centroid_mapping[local_labels[j]]

    data['clusters'] = clusters
    return data
Insert this function into the code and replace clustering with sliding_window_clustering.
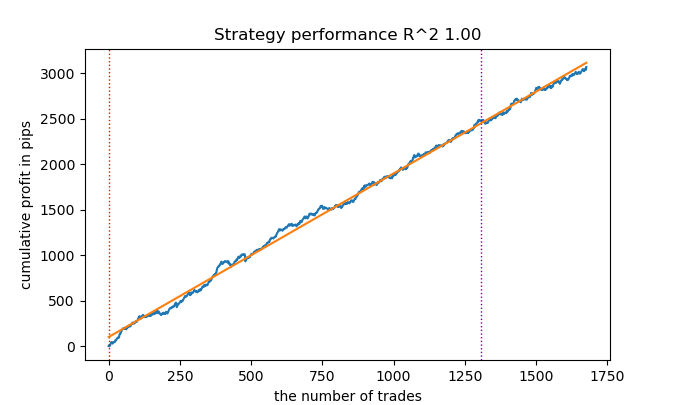
It seems to improve the results.
Still, sometimes it is useful to write articles.
Thanks for the article Dmitrievsky. It looks the uploaded EA and its include file are mismatch with each other. It refer the mpq file in the folder "Trend following", but the sample files were in "Mean reversion".
And the function get_features in the "causal one direction.py" are not the same as what appears in the article. Besides that, the mqh file generated by "causal one direction.py" when exporting .onnx is not the same as what offered in MQL5_files.zip.
Very appriciate if you can make necessary clarification.
Paul
Updated the archives + added a new clustering method.
Now all paths and functions match.
So you have R2 is a modified index, the efficiency of which is based on the profit in pips. What about drawdown and other performance indicators? If we get a model that gives more than 90% on training and at least 85% on the test, then your index will give impressive figures. No matter how many times I have run the tester on MT5, I have never received a profit on the history. The deposit is drained. This is despite the fact that your tester on Python gives out 0.97-0.98
I don't understand what this has to do with CV.
All these strategies have low proving power, because they are based only on the history of non-stationary quotes. But you can catch trends.- Free trading apps
- Over 8,000 signals for copying
- Economic news for exploring financial markets
You agree to website policy and terms of use
Check out the new article: Algorithmic Trading Strategies: AI and Its Road to Golden Pinnacles.
The evolution of understanding the capabilities of machine learning methods in trading has resulted in the creation of different algorithms. They are equally good at the same task, but fundamentally different. This article will consider a unidirectional trending trading system again in the case of gold, but using a clustering algorithm.
Considering this important approach to the analysis and forecasting of time series from different angles, it is possible to determine its advantages and disadvantages in comparison with other ways of creating trading systems which are based solely on the analysis and forecasting of financial time series. In some cases, these algorithms become quite effective and surpass classical approaches both in terms of the speed of creation and the quality of trading systems at the exit.
In this article, we will focus on unidirectional trading, where the algorithm will only open buy or sell trades. CatBoost and K-Means algorithms will be used as basic algorithms. CatBoost is a basic model that performs functions of a binary classifier for classifying trades. Whereas, K-Means is used to determine market modes at the preprocessing phase.
Author: dmitrievsky