-
Why did you post your MT4 question in the MT5 General section instead of the MQL4 section, (bottom of the Root page)?
General rules and best pratices of the Forum. - General - MQL5 programming forum? (2017)
Next time, post in the correct place. The moderators will likely move this thread there soon. -
Please edit your (original) post and use the CODE button (or Alt+S)! (For large amounts of code, attach it.)
General rules and best pratices of the Forum. - General - MQL5 programming forum #25 (2019)
Forum rules and recommendations - General - MQL5 programming forum (2023)
Messages Editor - rollincajun: draws a dashed line from the daily open price to maybe 15 bars past
Your code is drawing from bar two to bar zero of the current chart's timeframe, not the D1.
Always post all relevant code (using Code button) or attach the source file.
-
Why did you post your MT4 question in the MT5 General section instead of the MQL4 section, (bottom of the Root page)?
General rules and best pratices of the Forum. - General - MQL5 programming forum? (2017)
Next time, post in the correct place. The moderators will likely move this thread there soon. -
Please edit your (original) post and use the CODE button (or Alt+S)! (For large amounts of code, attach it.)
General rules and best pratices of the Forum. - General - MQL5 programming forum #25 (2019)
Forum rules and recommendations - General - MQL5 programming forum (2023)
Messages Editor -
Your code is drawing from bar two to bar zero of the current chart's timeframe, not the D1.
Always post all relevant code (using Code button) or attach the source file.
I was using that as an example not my actual code. I was showing the syntax I was using. This forum is super hard to navigate and had no idea I was even in the MQL5 forums. Both the MQL4 and MQL5 Forums link at the top of both pages points to this forum. So honestly there is no reason to be rude to new people who have no clue what is going on with this forum. This forum is the worst layout I've ever seen.
This is my full code and nothing draws on the chart. I have no idea what is going on and why I'm having such a hard time drawing a simple line.
#property strict
#property indicator_chart_window

string name="MyLine";
input int lineOffset = 10;

int OnInit()
  {
   return(INIT_SUCCEEDED);
  }


void OnDeinit(const int reason)
  {
   ObjectDelete(name);
  }


int OnCalculate(const int rates_total,
                const int prev_calculated,
                const datetime &time[],
                const double &open[],
                const double &high[],
                const double &low[],
                const double &close[],
                const long &tick_volume[],
                const long &volume[],
                const int &spread[])
  {

  // Calculate the index of the daily opening price
    datetime openTime = iTime(_Symbol, PERIOD_D1, 0);
    int openIndex = iBarShift(_Symbol, PERIOD_D1, openTime);

    // Calculate the index of the current bar
    int currentBar = Bars - 1;

    // Calculate the end index of the trendline
    int endIndex = currentBar + lineOffset;

    // Calculate the price level of the opening bar
    double openPrice = iOpen(_Symbol, PERIOD_D1, openIndex);

    // Calculate the price level for the end of the trendline
    double endPrice = iClose(_Symbol, PERIOD_M1, endIndex);

   static bool IsDrawn=false;
   if(!IsDrawn)
     {
      ObjectCreate(ChartID(), name, OBJ_TREND, 0, openIndex, openPrice, endIndex, endPrice);
      ObjectSetInteger(0,name,OBJPROP_RAY,false);
      IsDrawn=true;
     }
   return(rates_total);
  }
All I want is a line that starts at the opening price of the day drawing across the chart and extends past the current bar by 10 or 15 bars just so the line isn't sitting on top of the current bar. So it looks nicer. This also allows me to print a label above the line identifying what the line is that's pretty hard to do if the line stops at the current bar and I don't want it to go to the end of the chart at the right.
-
    datetime openTime = iTime(_Symbol, PERIOD_D1, 0);
    int openIndex = iBarShift(_Symbol, PERIOD_D1, openTime);
On MT4: Unless the current chart is that specific symbol(s)/TF(s) referenced, you must handle 4066/4073 errors before accessing candle/indicator values.
Download history in MQL4 EA - MQL4 programming forum - Page 3 #26.4 (2019) -
ObjectCreate(ChartID(), name, OBJ_TREND, 0, openIndex, openPrice, endIndex, endPrice);
Perhaps you should read the manual. ObjectCreate does not use indexes.
How To Ask Questions The Smart Way. (2004)
How To Interpret Answers.
RTFM and STFW: How To Tell You've Seriously Screwed Up.
-
On MT4: Unless the current chart is that specific symbol(s)/TF(s) referenced, you must handle 4066/4073 errors before accessing candle/indicator values.
Download history in MQL4 EA - MQL4 programming forum - Page 3 #26.4 (2019) -
Perhaps you should read the manual. ObjectCreate does not use indexes.
How To Ask Questions The Smart Way. (2004)
How To Interpret Answers.
RTFM and STFW: How To Tell You've Seriously Screwed Up.
I appreciate the respones thatnks for pointing that out I'm still new to coding. I have a lot to learn and the actual manual is hard to navigate too honestly.
I have the trend line at least drawing and it's horizontal but I'm having a hard time figuring out how to draw the line to a future bar. Instead of the line drawing to the end of the chart like a hline would do or a ray that extends to the right I would like the line to stop 10-15 bars past the current bar. I have yet to figure it out. Every time I try it's doing the opposite. It's drawing the line 15 bars shorter instead of longer. I tried - and it doesn't work either. I guess I'm terrible at math.
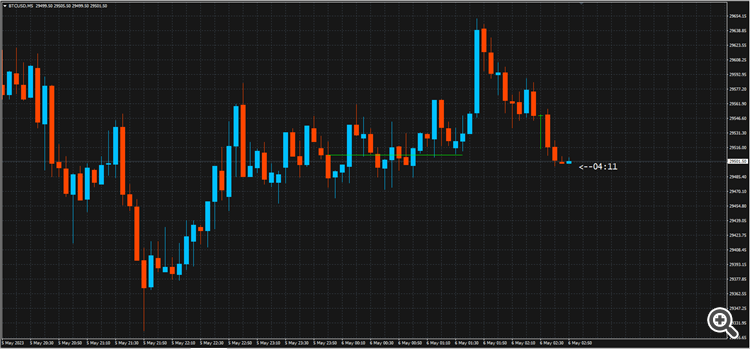
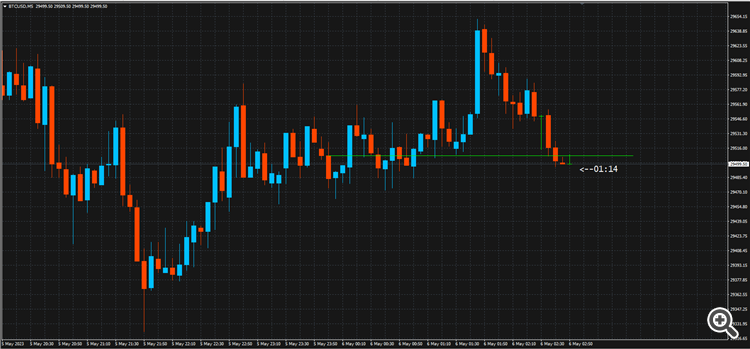
This is the result I'm getting
This is what I want.
This is my code so far.
#property indicator_chart_window

string lineName = "OpenLine";

void OnDeinit(const int reason)
{
    // Delete the trendline when the indicator is closed
    ObjectDelete(0, lineName);
}

int OnCalculate(const int rates_total,
                const int prev_calculated,
                const datetime& time[],
                const double& open[],
                const double& high[],
                const double& low[],
                const double& close[],
                const long& tick_volume[],
                const long& volume[],
                const int& spread[])
{
    // Calculate the opening time of the current day
    datetime openTime = iTime(_Symbol, PERIOD_D1, 0);

    // Calculate the opening price of the current day
    double openPrice = iOpen(_Symbol, PERIOD_D1, 0);

    // Calculate the time 15 bars in the future
    int futureIndex = MathMax(0, rates_total - prev_calculated - 1) + 15;
    datetime futureTime = time[futureIndex];

    // Remove the previous trendline
    ObjectDelete(0, lineName);

    // Draw the line using OBJ_TREND
    ObjectCreate(0, lineName, OBJ_TREND, 0, openTime, openPrice, futureTime, openPrice);
    ObjectSetInteger(0, lineName, OBJPROP_COLOR, clrLime);
    ObjectSetInteger(0, lineName, OBJPROP_STYLE, STYLE_SOLID);
    ObjectSetInteger(0, lineName, OBJPROP_WIDTH, 1);
    ObjectSetInteger(0, lineName, OBJPROP_RAY, false);

    // Bring the line to the foreground
    ObjectMove(0, lineName, 0, openTime, openPrice);

    return(rates_total);
}
  int futureIndex = MathMax(0, rates_total - prev_calculated - 1) + 15;
    datetime futureTime = time[futureIndex];
- Your +15 is 15 bars in the past.
- You can't access the future, it does not exist.
- If you assume that all bars will exist, then futureTime = Time[0] + 15*PeriodSeconds()
- Your +15 is 15 bars in the past.
- You can't access the future, it does not exist.
- If you assume that all bars will exist, then futureTime = Time[0] + 15*PeriodSeconds()
That worked great thanks a lot!
I'm having another issue. I want to add yesterday high and yesterday low as well doing the same thing.
The lines are starting at the current day open just like the green line I'm assuming because I'm trying to draw something from a previous day on the current chart. I'm not exactly sure how to approach that.
This is the code I currently have but it's not working of course. Some pointers would help.
#property indicator_chart_window

input color LineColor = clrLime;
input color LabelColor = clrLime;
input color HighLowLineColor = clrWhite;
input color HighLowLabelColor = clrWhite;
input int FutureBars = 15;
string lineName = "DailyOpenLine";
string labelName = "DailyOpenLabel";
string highLineName = "YesterdayHighLine";
string highLabelName = "YesterdayHighLabel";
string lowLineName = "YesterdayLowLine";
string lowLabelName = "YesterdayLowLabel";

void OnDeinit(const int reason)
{
    // Delete the trendlines and labels when the indicator is closed
    ObjectDelete(0, lineName);
    ObjectDelete(0, labelName);
    ObjectDelete(0, highLineName);
    ObjectDelete(0, highLabelName);
    ObjectDelete(0, lowLineName);
    ObjectDelete(0, lowLabelName);
}

int OnCalculate(const int rates_total,
                const int prev_calculated,
                const datetime& time[],
                const double& open[],
                const double& high[],
                const double& low[],
                const double& close[],
                const long& tick_volume[],
                const long& volume[],
                const int& spread[])
{
    // Calculate the opening time of the current day
    datetime openTime = iTime(_Symbol, PERIOD_D1, 0);

    // Calculate the opening time of the previous day
    datetime prevDayOpenTime = iTime(_Symbol, PERIOD_D1, 1);

    // Calculate the opening price of the current day
    double openPrice = iOpen(_Symbol, PERIOD_D1, 0);

    // Calculate yesterday's high and low prices
    double yesterdayHigh = iHigh(_Symbol, PERIOD_D1, 1);
    double yesterdayLow = iLow(_Symbol, PERIOD_D1, 1);

    // Calculate the time in the future
    datetime futureTime = time[0] + FutureBars * PeriodSeconds();

    // Remove the previous trendlines and labels
    ObjectDelete(0, lineName);
    ObjectDelete(0, labelName);
    ObjectDelete(0, highLineName);
    ObjectDelete(0, highLabelName);
    ObjectDelete(0, lowLineName);
    ObjectDelete(0, lowLabelName);

    // Draw the line using OBJ_TREND
    ObjectCreate(0, lineName, OBJ_TREND, 0, openTime, openPrice, futureTime, openPrice);
    ObjectSetInteger(0, lineName, OBJPROP_COLOR, LineColor);
    ObjectSetInteger(0, lineName, OBJPROP_STYLE, STYLE_DOT);
    ObjectSetInteger(0, lineName, OBJPROP_WIDTH, 1);
    ObjectSetInteger(0, lineName, OBJPROP_RAY, false);

    // Draw the label using OBJ_TEXT
    string labelText = "Daily Open";
    double labelPrice = openPrice;
    datetime labelTime = futureTime;
    ObjectCreate(0, labelName, OBJ_TEXT, 0, labelTime, labelPrice);
    ObjectSetText(labelName, labelText, 10, "Arial", LabelColor);
    ObjectSetInteger(0, labelName, OBJPROP_COLOR, LabelColor);
    ObjectSetInteger(0, labelName, OBJPROP_XDISTANCE, 10);
    ObjectSetInteger(0, labelName, OBJPROP_YDISTANCE, -10);

    // Draw yesterday's high line and label
    ObjectCreate(0, highLineName, OBJ_TREND, 0, prevDayOpenTime, yesterdayHigh, futureTime, yesterdayHigh);
    ObjectSetInteger(0, highLineName, OBJPROP_COLOR, HighLowLineColor);
    ObjectSetInteger(0, highLineName, OBJPROP_STYLE, STYLE_DOT);
    ObjectSetInteger(0, highLineName, OBJPROP_WIDTH, 1);
    ObjectSetInteger(0, highLineName, OBJPROP_RAY, false);

    // Draw yesterday's high label
    string highLabelText = "Yesterday High";
    double highLabelPrice = yesterdayHigh;
    datetime highLabelTime = futureTime;
    ObjectCreate(0, highLabelName, OBJ_TEXT, 0, highLabelTime, highLabelPrice);
    ObjectSetText(highLabelName, highLabelText, 10, "Arial", HighLowLabelColor);
    ObjectSetInteger(0, highLabelName, OBJPROP_COLOR, HighLowLabelColor);
    ObjectSetInteger(0, highLabelName, OBJPROP_XDISTANCE, 10);
    ObjectSetInteger(0, highLabelName, OBJPROP_YDISTANCE, -10);

    // Draw yesterday's low line and label
    ObjectCreate(0, lowLineName, OBJ_TREND, 0, prevDayOpenTime, yesterdayLow, futureTime, yesterdayLow);
    ObjectSetInteger(0, lowLineName, OBJPROP_COLOR, HighLowLineColor);
    ObjectSetInteger(0, lowLineName, OBJPROP_STYLE, STYLE_DOT);
    ObjectSetInteger(0, lowLineName, OBJPROP_WIDTH, 1);
    ObjectSetInteger(0, lowLineName, OBJPROP_RAY, false);

    // Draw yesterday's low label
    string lowLabelText = "Yesterday Low";
    double lowLabelPrice = yesterdayLow;
    datetime lowLabelTime = futureTime;
    ObjectCreate(0, lowLabelName, OBJ_TEXT, 0, lowLabelTime, lowLabelPrice);
    ObjectSetText(lowLabelName, lowLabelText, 10, "Arial", HighLowLabelColor);
    ObjectSetInteger(0, lowLabelName, OBJPROP_COLOR, HighLowLabelColor);
    ObjectSetInteger(0, lowLabelName, OBJPROP_XDISTANCE, 10);
    ObjectSetInteger(0, lowLabelName, OBJPROP_YDISTANCE, -10);

    // Bring the lines and labels to the foreground
    ObjectMove(0, lineName, 0, openTime, openPrice);
    ObjectMove(0, labelName, 0, labelTime, labelPrice);
    ObjectMove(0, highLineName, 0, openTime, yesterdayHigh);
    ObjectMove(0, highLabelName, 0, highLabelTime, highLabelPrice);
    ObjectMove(0, lowLineName, 0, openTime, yesterdayLow);
    ObjectMove(0, lowLabelName, 0, lowLabelTime, lowLabelPrice);

    return(rates_total);
}
- Free trading apps
- Over 8,000 signals for copying
- Economic news for exploring financial markets
You agree to website policy and terms of use


I've been trying codes for two days and nothing is working.
I want to make an indicator that draws a dashed line from the daily open price to maybe 15 bars past the current price just showing a line where the daily open is but I want the line to start at the actual open price.
I came across a thread from 2015 of guy trying to do just this and he was using a code like so.
but every time I've tried to do it like this nothing draws on the chart.
maybe this code is obsolete now I am not sure. I just want to draw out all the most important price lines and put a nice label above them saying what they are so I can see when price reacts to them.
I would prefer not to have a horizontal line across the whole chart because it's messy and it just doesn't look that good.