Fractals, fractal structures, their graphic images + Canvas
In order for people to start using Canvas for useful things, you have to start by showing useless things. :))
If you drink strong "kvass", the world will sink into canvas. :)
The idea I'm proposing is for a practical application of canvas and it's a whole new direction.
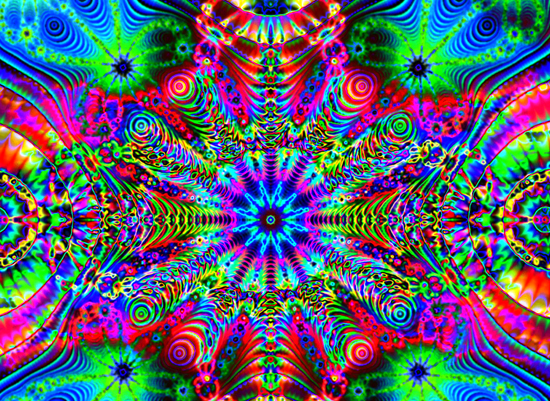
There is a fractal in the drawing. Maybe, we can calculate the fractal structures by history of quotations (sliding windows) and translate them into similar graphic images that will serve for identification of market conditions. We will get a peculiar indicator.For example, in physics (of a solid body) by the Fermi's surface one can judge about the state of the material, also one can judge about the state of the market by the fractal images, because as the empirical material accumulates, the language of the images' accordance with the concrete states of the market will be formed.
If you drink strong 'kvass', the world will sink into canvas. :)
I propose the idea for a practical application of canvas and it's a completely new direction.
There is a fractal in the picture. Maybe, we can calculate the fractal structure from the history of quotations (sliding windows) and translate it in similar graphic images that will serve for identification of market conditions. We will get a peculiar indicator.For example, in physics (of a solid body) by the Fermi's surface one can judge about the state of the material, also one can judge about the state of the market by the fractal images, because as the empirical material accumulates, the language of the images' accordance with the concrete states of the market will be formed.
There are two ways this can be implemented. The only thing I don't understand is that the scale of the pattern will change and we need to change the scale of the sliding window somehow.
Does it work in the tester?
There are two ways this can be implemented. The only thing I don't understand is that the scale of the pattern will change and we need to change the scale of the sliding window somehow.
Does it work in the tester?
What are the options?
I've been thinking about this for a long time, I still haven't been able to figure out how to convert the data to see the pattern. There are some options, but I don't really like all of them. Maybe together we can come up with something.
What are these options?
I developed the first one a long time ago. We create a window of n points vertically, divide it by 2 and start working in the middle. Then if the price makes a step up, we draw a vertical line up and if the price makes a step down, we draw a vertical line down. If price made a step upwards by 5 points and the next step down by 7 points, we draw a vertical line downwards and make the line a bit darker where the price was 2 times. In other words, we divide the palette into gradients and the more times the price has been at a certain point, the darker the pixels there. When the amplitude of the price becomes larger than the size of the window vertically, we start a new line, to the right of the previous one. You should get something like this:

There are several variants of work: 1- the next vertical line starts from the middle or from the bottom if the price is up, or from the top if the price is up, but invert the direction of movement in the next line (if the price is up, then draw down). Ideally, you should get a long line bounded by the vertical dimensions of the screen in pips and folded in several times
2- if on the new line the price has gone backwards, go to the previous line or not. I myself am inclined to go to the previous line, but it's better to make an adjustment and see how it works.
This way we will be able to clearly see how the price visits some points, creating thickening of lines and maybe see the pattern. All operations should be done point by point, if a candle came but price didn't move, then no step was made. In the settings, set the step size in pips, below which the movement is ignored.
The coloring can be done not only with the gradient from light to dark, but also with the colour from old. The more time has passed between two visits of the same point, the more the colour can move around the palette. Since time is not taken into account here, it is better to count steps done. Suppose, if price was at this point 2 steps back, then colours are similar, but if 100 steps, then it shifts from red to purple on the palette.
I even did a ToR for this long time ago, if you need it I'll look for it.
This is just an idea, I haven't thought about the algorithms yet, but I have a feeling that the prospects here are considerable. And, most likely, this task alone will indeed be difficult to solve.
I developed the first one a long time ago. We create a window of n pips vertically, divide it by 2 and start working in the middle. Then if price makes a step up, we draw a vertical line up and if price makes a step down, we draw a vertical line down. If price made a step upwards by 5 points and the next step down by 7 points, we draw a vertical line downwards and make the line a bit darker where the price was 2 times. In other words, we divide the palette into gradients and the more times the price has been at a certain point, the darker the pixels there. When the amplitude of the price becomes larger than the size of the window vertically, we start a new line, to the right of the previous one. It should turn out something like this:
It is not clear what the window for analysis should be, and the number of vertical lines depends on it, so as to be able to make a comparison. It's more like density than fractals...
Generally, a fractal is a pattern that repeats at different scales. Maybe, this regularity must be searched for in some frequency spectrum of quotes history, not necessarily in the Fourier spectrum, may be distributed in terms of convolutions (they seem to be more appropriate) or some other way. Cluster it all, investigate and see what happens. Or maybe someone has already researched it all, i.e. look at abstracts of articles in reviews.
I've tried frequency banding, the spectral density floats in the end at different scales. That is, at different scales, the instrument may or may not look like itself. The spectrum floats a lot over time, some frequencies may or may not remain, and the amplitudes also float. There is a strong time sampling, a lot of random component. If you oversample a sine by accident, it's very difficult to restore it to a sine. It's the same here. Temporal sampling equals random sampling. That's the big problem with determining spectral density.
More on this topic. A market may be harmonic, but it looks more like a Weierstrasse function (it is fractal). It is similar in that if we decompose it into a spectrum, we cannot predict the future if we are inside a period, i.e. it has not gone through a complete cycle, but it consists of a synsoid. This is where the similarity starts. The period of the smallest frequency in the market is always increasing, i.e. there is always a certain number of harmonics whose period increases as the transactions occur, and new frequencies appear inside as the new transactions occur. That is, as the market develops, the number of harmonics is calculated and the period of those harmonics increases. It starts with 1 transaction and 1 frequency and so on.
I have been thinking how to correctly discretize the price; I have some ideas about it, too.
It is not clear what the window for analysis should be, and the number of vertical lines depends on this in order to be able to make comparisons. It's more like density than fractals...
that's the problem, it's not clear. Most likely the window should be floating, along with the floating pitch. The best thing I've come up with is to keep the density stable and change the window pitch and width under it.
- Free trading apps
- Over 8,000 signals for copying
- Economic news for exploring financial markets
You agree to website policy and terms of use