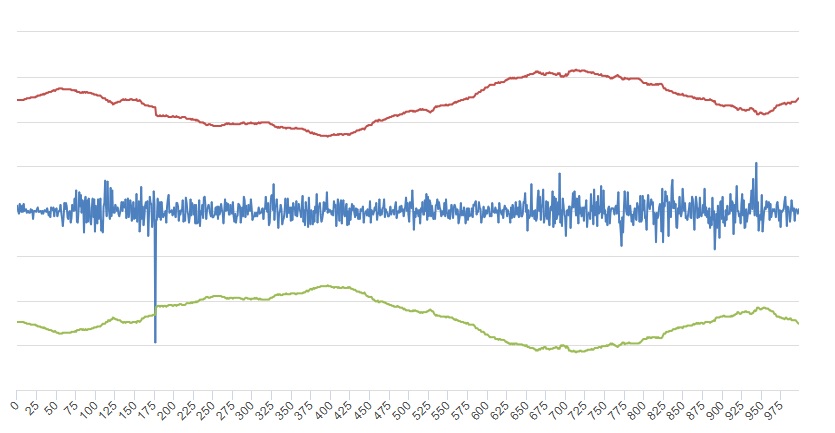
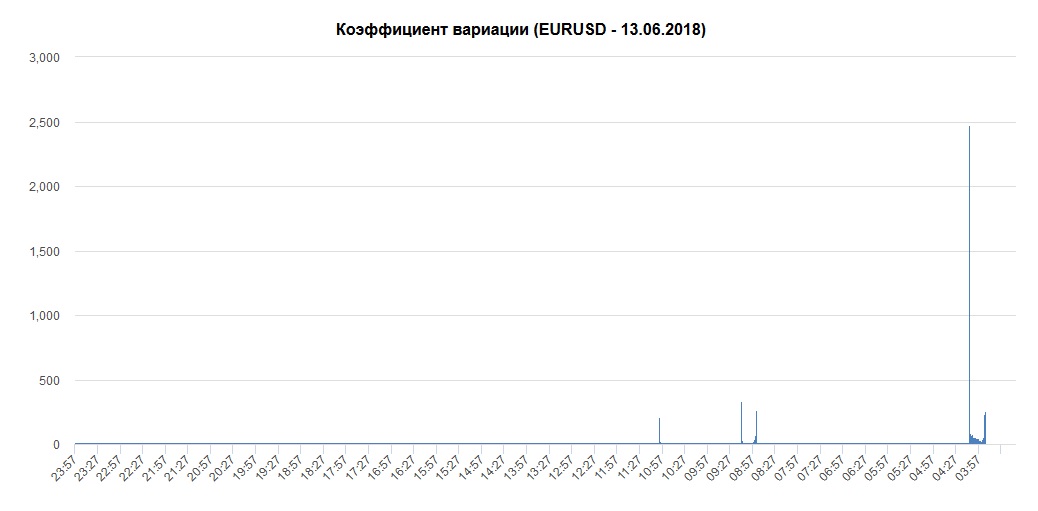
Distribution of a continuous value
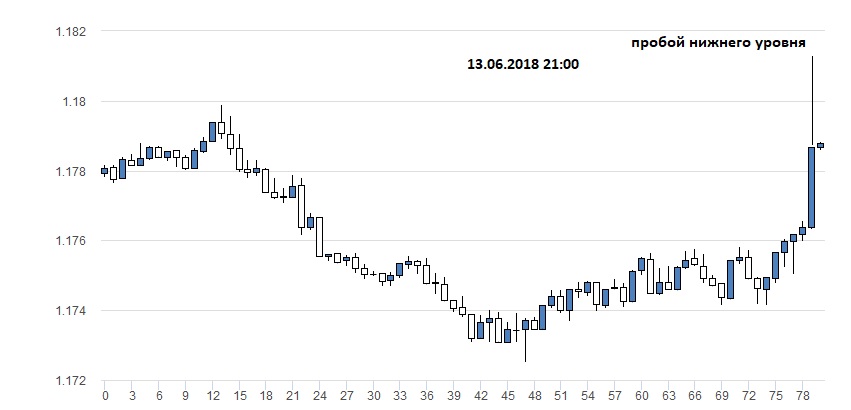
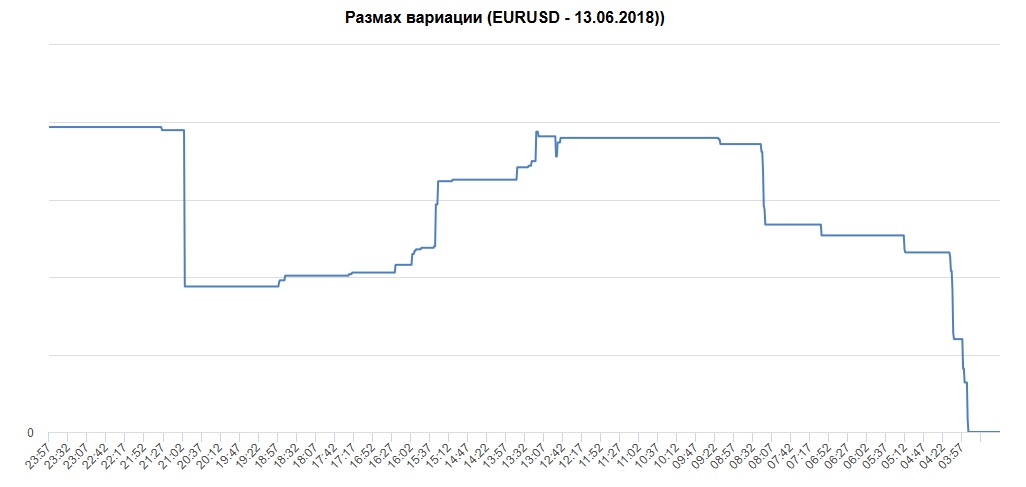
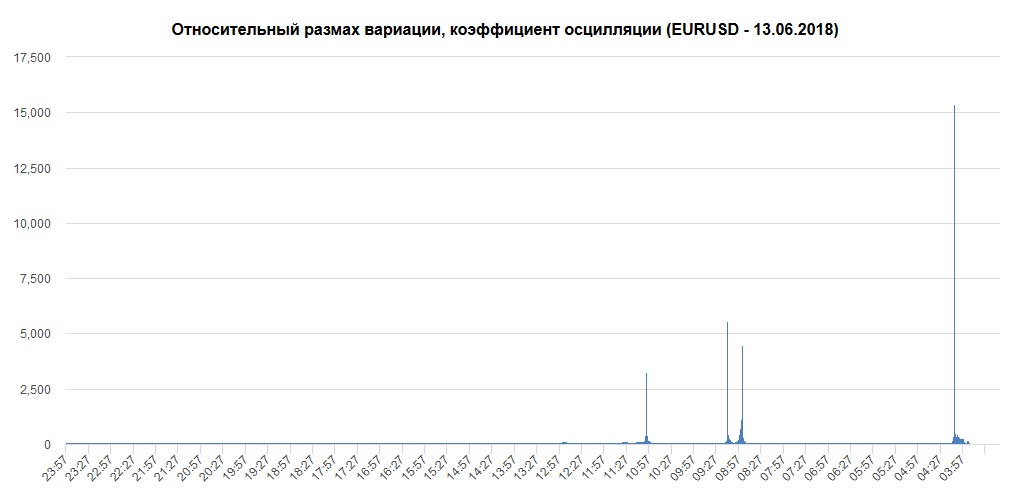
EURUSD 13.06.2018
Channel Dispersion.
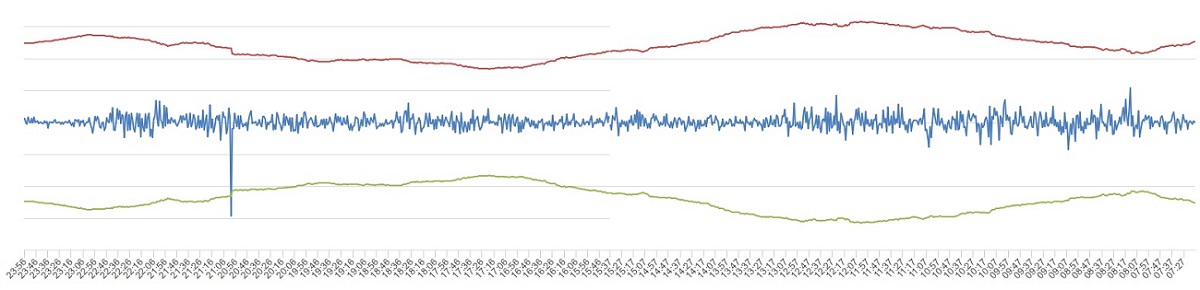
Price after a breakdown of the lower channel level:
@Evgeniy Chumakov, could you please tell me which continuous random variable we are talking about?
If you mean the rates sent by DCs very often, up to several times a second, then they are discrete. They are sent as changes of a point or more. Also, these rates are not random, but are the result of quite deterministic filtering algorithms.In order not to clutter up the author's thread with my statements, I'm creating a separate thread.
A branch where all began, so to say the creative inspirer@Alexander_K, aka@Alexander_K2, and also some more people and cat in one person : https://www.mql5.com/ru/forum/221552
- To formulate the conclusions of your mathematical intricacies at least in terms of "and then we buy (sell)", for we are not here at crosses
The zeros are going to win, and the money we need to buy and sell accordingly.
- Perhaps even at the beginning you should consider the influence of such topics as optimal deal volumes, trading sessions,
news (and holidays), Level2, execution delays, slippages and many other things. For, Dear, even without the use of high,
The Expert Advisor and the robot can be written in five minutes, or you can Google an Expert Advisor on an abstract price chart.
will give you millions of interest a year. Especially if you test at zero spread and zero other transaction costs.
- Do not publish screenshots of charts and calculations that show only that on X day there was a solar flare (on the price chart)
and at the same time there was a polar luminosity (a significant shift in statistical characteristics). It is always possible to find on a price series
over several years a number of moments (times, not probability-statistical moments) when the craziest
mathematical theory. As in any scientific experiment, a statistically significant probability of repeatability is important.
And especially repeatability in the future, which as I dare remind you is "yet to be determined".
You are trying to determine which moment (not time, but in the statistical sense) is more like a grail bell, without realising,
that all your grails are upside down and can only drain. And draining regardless of the presence of thick and thin tails, guts, horns and hooves.
Drain only because you are looking perhaps for the wrong thing and perhaps the wrong place, perhaps a black cat or an alien intelligence.
And you have to look for where it is cheaper to buy and where it is more expensive to sell.
And in conclusion, pictures of grails:
The wrong grail (for you can't keep the profits in it - they will drain out):

The right grail:

@Evgeniy Chumakov, could you please tell me which continuous random variable we are talking about?
If you mean the rates sent by DCs very often, up to several times a second, then they are discrete. They are sent as changes of a point or more. Also these rates are not random, but result from quite deterministic filtering algorithms.OK, let it be not random, I've renamed the branch. I also remind you that unlike Alexander, I work with minute charts.
For the esteemed readers of the thread:
1. Unlike Alexander, I never said that I was chasing a grail.
2. No one here has promised profits to anyone.
3) You should not look at graphs and draw your fantasies to them and pass them off as truth.
4. I am not urging anyone to trade on these charts.
5. I do not have to prove anything to anyone, and therefore I am free to post pictures of any day and time frame at my discretion.
For the esteemed readers of the thread:
1. I have never, unlike Alexander, said that I was chasing a grail.
2. No one here has ever promised profits to anyone.
3. you should not look at graphs and draw your fantasies to them and pass them off as truth.
4. I am not urging anyone to trade on these charts.
5. I dont have to prove anything to anyone and therefore I am free to post pictures of any day and time period at my discretion.
Then what is the point of this thread?
Actually, the topic has been covered to the bones in a very clear language, for example:
A Continuous Random Value and its Distribution Function.
http://mathprofi.ru/nepreryvnaya_sluchaynaya_velichina.html
Why do you need graphs that you don't need to trade on?
Maybe it would be better to publish such ideas in forums devoted to pure mathematics not compromised by heretical trading?
Although if you don't prove anything to anyone, they will probably kick you out...
This is a dead-end road.
You should open your textbooks and get to grips with the basic concepts of TViMS (as well as the grammar), rather than blindly repeating nonsense sketched out by your "physicist".
- Free trading apps
- Over 8,000 signals for copying
- Economic news for exploring financial markets
You agree to website policy and terms of use
In order not to clutter up the author's thread with my statements, I'm creating a separate thread.
Branch where it all began, so to say the creative inspirer@Alexander_K, aka@Alexander_K2, as well as several other people and the cat in one person: https: //www.mql5.com/ru/forum/221552
For the esteemed readers of the thread:
1. I have never said that I, unlike Alexander, am chasing a grail.
2. No one here has ever promised profit. 3.
3) You should not look at graphs and draw your fantasies to them and pass them off as truth.
4. I am not urging anyone to trade on these charts.
5. I do not have to prove anything to anyone, and therefore I am free to post pictures of any day and time frame at my discretion.