Weekend evening - page 32
You are missing trading opportunities:
- Free trading apps
- Over 8,000 signals for copying
- Economic news for exploring financial markets
Registration
Log in
You agree to website policy and terms of use
If you do not have an account, please register
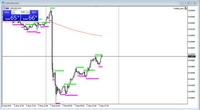
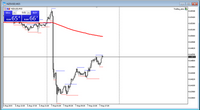
So the two indicators are already displayed, it will now draw
"The green rectangle is equal to the value of the H1 eight-hour candle, for the time from 07:00 to 12:00. "
This rectangle is drawn on MT4 by indicator, on MT5 I have adapted i-AnyRangeCldTail_System indicator by time 03:00 to 07:00.
We will have an advisor to do everything - it's not just an advisor, it will be a trading system (although it may not be fully automatic, but as an aid to manual trading).
We will have an advisor to do everything - it's not just an advisor, it will be a trading system (although it may not be fully automatic, but as an aid to manual trading).
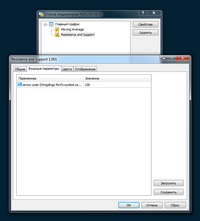
It is possible to change the symbol 159 to 158 (small dots) and
colour to blue and red ?
I am changing it on the chart, it is not saved.
You could change the Resistance and Support indicator from 159 to 158 (small dots) and
to blue and red ?
I change it on the chart, it doesn't save.
What do you mean it's not saved? Everything is configurable: both the character number and the colour.
Your homework for tomorrow: learn how to change the parameters in the incoming parameters. Learn to describe your actions - so that you can understand - "What are you doing and where do you press??"
What do you mean it's not saved? Everything is configurable: character number and colour.
Your homework for tomorrow: learn how to change the parameters in the incoming parameters. Learn to describe your actions - so you can understand - "What are you doing and where are you clicking???"
Understood.
Thank you !
What do you mean, it's not saved? Everything is configurable: character number and colour.
Your homework for tomorrow: learn how to change the parameters in the incoming parameters. Learn to describe your actions - so that you can understand - "What are YOU doing and where are you pressing???"
I transfer the Expert Advisor to a clean chart and get a picture.
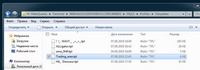
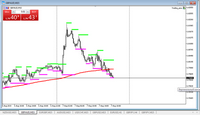
I call the template "Trading_area" and save it.
I open the list of indicators, there are two of them.
I change thickness of MA.
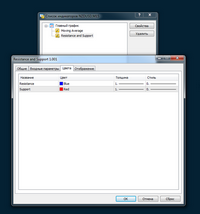
I change Resistance and Support indicator symbol to 158
I change point colour.
I get a nice picture.
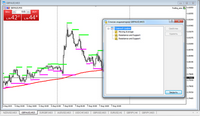
I save this template, open a chart of another symbol and open the saved template
I save the pattern and open the saved template "Trading_area". I get the picture.
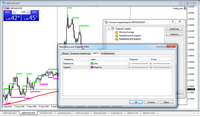
I open the list of indicators and see three indicators, the second Resistance and Support has appeared.
I have changed parameters in the first one, the second one has not changed.
I had to miniaturize them.
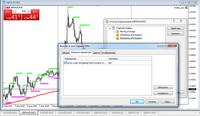
One more thing. I put the Expert Advisor on the chart, open the list of Expert Advisors and there are two of them.
My observation: I had my Expert Advisor on two symbols, two of them on each chart.
I have deleted them both from one chart. the other chart is clean by itself.
One more thing. I put the Expert Advisor on the chart, open the list of Expert Advisors, there are two of them.
You just saved it all into a template.
You just saved it all into a template.
Just did it all over again, same thing. Two.
I remove it from one chart, the second chart becomes clear on its own.
Yes, I see what you want now.
It will not work that way - because the EA does not use indicators, but creates these indicators and displays them on the chart. Why exactly so: let's imagine the situation: the user did not put the indicator on the chart - how will the EA get the data from the indicator? Well, you can not!
I have found the way out just for you: DISCONNECT THE AUTHORITY BUTTON and put the Expert Advisor on a clean chart and carefully set two parameters in it:
ATTENTION: The Expert Advisor will be attached, but the indicators will be hidden.
You save the template under your own name.
You can apply the template to another chart, but AFTER applying the template, put Use indicator visualization -> true. That is first you apply a template, then Use indicator visualization -> true.